
FOUR Reports Third Quarter 2020 Results November 5, 2020 ALLENTOWN, PA – (BUSINESS WIRE) Shift4 Payments, Inc. (NYSE: FOUR “the Company”), a leading provider of integrated payment processing solutions, today announced its third quarter 2020 results. “We are very pleased with our third quarter 2020 results, which exhibited Shift4’s ability to grow, in what remains a challenging market for many merchants. Shift4 continues to prove our unique value to both existing and new merchants across a growing set of retail verticals. The company strengthened its liquidity with successful capital offerings in September and October, and also executed two acquisitions. Overall, Shift4 is incredibly excited about our competitive advantage and ability to execute in a widening market opportunity.” Gross revenue for the third quarter of 2020 increased 11% to $214.8 million from $193.8 million in the prior year period, as we saw a significant recovery within our merchant base from the depths of the COVID-19 pandemic. Net loss was $9.9 million or a net loss of $0.12 per share (basic and diluted) for our Class A and Class C common stock. Adjusted net loss was $2.0 million compared to a loss of $5.0 million for the prior year period. End-to-end payment volume was $7.1 billion for the third quarter of 2020, which resulted in gross revenue less network fees of $87.7 million. This compares with $5.9 billion and $79.7 million for the prior year period; an increase of 20% and 10%, respectively. Adjusted EBITDA was $28.7 million, up 17% from $24.5 million during the prior year period. A detailed investor presentation can be found at investors.shift4.com. Exhibit 99.1
Quarterly Investor Call Details: Management will host a conference call today (November 5, 2020) at 8:30 am ET to discuss its third quarter 2020 financial results. To register for this conference call, please use the link: http://www.directeventreg.com/registration/event/2090479. After registering, a confirmation will be sent through email, including dial-in details and unique conference call codes for entry. Registration is open through the live call, but to ensure you are connected for the full call we suggest registering at least 10 minutes before the start of the call. The conference call will also be webcast live through the Company’s website at https://investors.shift4.com/overview/default.aspx. About Shift4 Payments, Inc. Shift4 Payments, Inc. is a leading provider of integrated payment processing and technology solutions, delivering a complete omnichannel ecosystem that extends beyond payments to include a wide range of commerce-enabling services. The Company’s technologies help power over 350 software providers in numerous industries, including hospitality, retail, F&B, ecommerce, lodging, gaming, and many more. With over 7,000 sales partners, the Company securely processed more than $200 billion in payments volume for over 200,000 businesses in 2019. For additional information, visit shift4.com. Investor Relations: Sloan Bohlen 610.596.4475 | investors@shift4.com Media Contact: James McCusker jmccusker@soleburytrout.com
Safe Harbor Statement and Forward Looking Information This presentation contains forward-looking statements within the meaning of the Private Securities Litigation Reform Act of 1995. All statements contained in this presentation that do not relate to matters of historical fact should be considered forward-looking statements, including statements regarding Shift4 Payment, Inc.’s (“our”, the “Company” or Shift4”) anticipated financial performance, including our financial outlook for the fourth quarter of 2020. These statements are neither promises nor guarantees, but involve known and unknown risks, uncertainties and other important factors that may cause our actual results, performance or achievements to be materially different from any future results, performance or achievements expressed or implied by the forward-looking statements, including, but not limited to, the following: the effect of the COVID-19 global pandemic on our business and results of operations; our ability to differentiate ourselves from our competitors and compete effectively; our ability to anticipate and respond to changing industry trends and merchant and consumer needs; our ability to continue making acquisitions of businesses or assets; our ability to continue to expand our market share or expand into new markets; our reliance on third-party vendors to provide products and services; our ability to integrate our services and products with operating systems, devices, software and web browsers; our ability to maintain merchant and software partner relationships and strategic partnerships; the effects of global economic, political and other conditions on consumer, business and government spending; our compliance with governmental regulation and other legal obligations, particularly related to privacy, data protection and information security, and consumer protection laws; our ability to establish, maintain and enforce effective risk management policies and procedures; our ability to protect our systems and data from continually evolving cybersecurity risks, security breaches and other technological risks; potential harm caused by software defects, computer viruses and development delays; the effect of degradation of the quality of the products and services we offer; potential harm caused by increased customer attrition; potential harm caused by fraud by merchants or others; potential harm caused by damage to our reputation or brands; our ability to recruit, retain and develop qualified personnel; our reliance on a single or limited number of suppliers; the effects of seasonality and volatility on our operating results; the effect of various legal proceedings; our ability to raise additional capital to fund our operations; our ability to protect, enforce and defend our intellectual property rights; our ability to establish and maintain effective internal control over financial reporting and disclosure controls and procedures; our compliance with laws, regulations and enforcement activities that affect our industry; our dependence on distributions from Shift4 Payments, LLC to pay our taxes and expenses, including payments under the Tax Receivable Agreement; and the significant influence Rook and Searchlight have over us, including control over decisions that require the approval of stockholders. These and other important factors are discussed under the caption “Risk Factors” in our final Quarterly Report on Form 10-Q for the quarter ended September 30, 2020 and our other filings with the SEC could cause actual results to differ materially from those indicated by the forward-looking statements made in this presentation. Any such forward-looking statements represent management’s estimates as of the date of this presentation. While we may elect to update such forward-looking statements at some point in the future, we disclaim any obligation to do so, even if subsequent events cause our views to change.
Non-GAAP Financial Measures and Key Performance Indicators We use supplemental measures of our performance which are derived from our consolidated financial information but which are not presented in our consolidated financial statements prepared in accordance with generally accepted accounting principles, or GAAP. These non-GAAP financial measures include: gross revenue less network fees, which includes interchange and assessment fees; adjusted net loss; earnings before interest expense, income taxes, depreciation, and amortization, or EBITDA; and adjusted EBITDA. Gross revenue less network fees represents a key performance metric that management uses to measure changes in the mix and value derived from our customer base as we continue to execute our strategy to expand our reach to serve larger, complex merchants. Adjusted EBITDA is the primary financial performance measure used by management to evaluate its business and monitor results of operations. Adjusted EBITDA represents EBITDA further adjusted for certain non-cash and other non-recurring items that management believes are not indicative of ongoing operations. These adjustments include acquisition, restructuring and integration costs, equity-based compensation expense, management fees and other nonrecurring items. We use non-GAAP financial measures to supplement financial information presented on a GAAP basis. We believe that excluding certain items from our GAAP results allows management to better understand our consolidated financial performance from period to period and better project our future consolidated financial performance as forecasts are developed at a level of detail different from that used to prepare GAAP-based financial measures. Moreover, we believe these non-GAAP financial measures provide our stakeholders with useful information to help them evaluate our operating results by facilitating an enhanced understanding of our operating performance and enabling them to make more meaningful period to period comparisons. There are limitations to the use of the non-GAAP financial measures presented in this presentation. Our non-GAAP financial measures may not be comparable to similarly titled measures of other companies. Other companies, including companies in our industry, may calculate non-GAAP financial measures differently than we do, limiting the usefulness of those measures for comparative purposes. The non-GAAP financial measures are not meant to be considered as indicators of performance in isolation from or as a substitute for net income (loss) prepared in accordance with GAAP, and should be read only in conjunction with financial information presented on a GAAP basis. Reconciliations of EBITDA and adjusted EBITDA, gross revenue less network fees, and adjusted net loss to its most directly comparable GAAP financial measure are presented at the end of this presentation. We encourage you to review the reconciliations in conjunction with the presentation of the non-GAAP financial measures for each of the periods presented. In future fiscal periods, we may exclude such items and may incur income and expenses similar to these excluded items. In addition, we present end-to-end payment volume, a key performance indicator, which is defined as the total dollar amount of card payments that we authorize and settle on behalf of our merchants. This volume does not include volume processed through our gateway-only merchants.

Earnings Presentation NOVEMBER 5, 2020
Dear Shareholders, It’s hard to write a letter highlighting our progress with so much unrest in the world. I will temper my enthusiasm and state that Q3 was a reasonably good quarter. In all measurable ways, we delivered better than expected results including strong year-over-year growth. We also completed two acquisitions, one of which will significantly expand the breadth of our ecommerce capabilities. It’s important to realize that we will never sit still. We have evolved this company many times over the last 20 years to ensure our relevancy. We are an incredibly ambitious organization, but we can’t achieve any of our goals without a lot of employees and software partners that are passionate about simplifying commerce. Suffice to say, I am incredibly proud of our team and their accomplishments. On that note, I also don’t believe in leading from behind. If I can ever personally be of assistance, be that with new customer opportunities or partnerships, or simply working through an issue, please don’t hesitate to contact me directly. My e-mail address is below. For all of us, 2020 will be a year to remember. It feels like the pandemic, social and political issues have consumed more heart beats in 6 months than we are afforded in a lifetime. We all have a role to play in making the world a healthier place, and you have my commitment that Shift4 will take our responsibilities towards social and environmental issues seriously. Like all of us, I hope 2021 is a year of healing in more ways than one.. Sincerely, Jared Isaacman Founder & CEO Jared@shift4.com
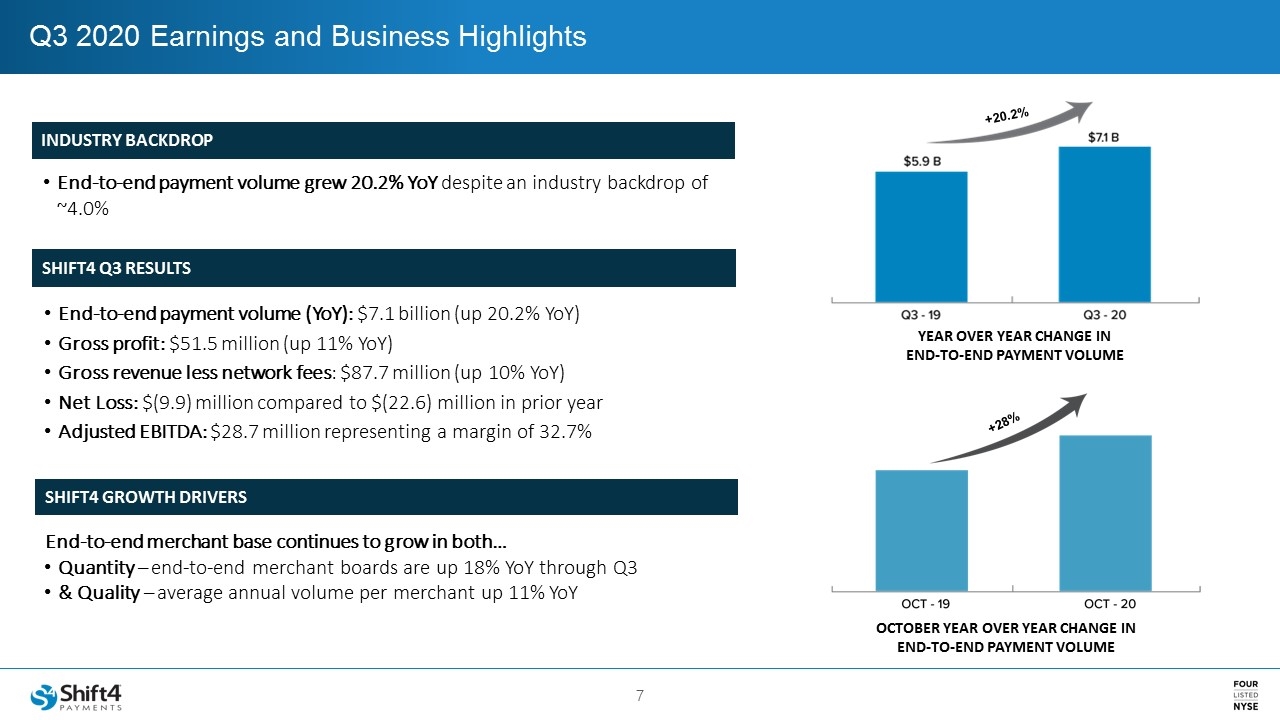
Q3 2020 Earnings and Business Highlights End-to-end payment volume (YoY): $7.1 billion (up 20.2% YoY) Gross profit: $51.5 million (up 11% YoY) Gross revenue less network fees: $87.7 million (up 10% YoY) Net Loss: $(9.9) million compared to $(22.6) million in prior year Adjusted EBITDA: $28.7 million representing a margin of 32.7% INDUSTRY BACKDROP End-to-end payment volume grew 20.2% YoY despite an industry backdrop of ~4.0% SHIFT4 Q3 RESULTS End-to-end merchant base continues to grow in both… Quantity – end-to-end merchant boards are up 18% YoY through Q3 & Quality – average annual volume per merchant up 11% YoY SHIFT4 GROWTH DRIVERS YEAR OVER YEAR CHANGE IN END-TO-END PAYMENT VOLUME OCTOBER YEAR OVER YEAR CHANGE IN END-TO-END PAYMENT VOLUME +20.2% +28%
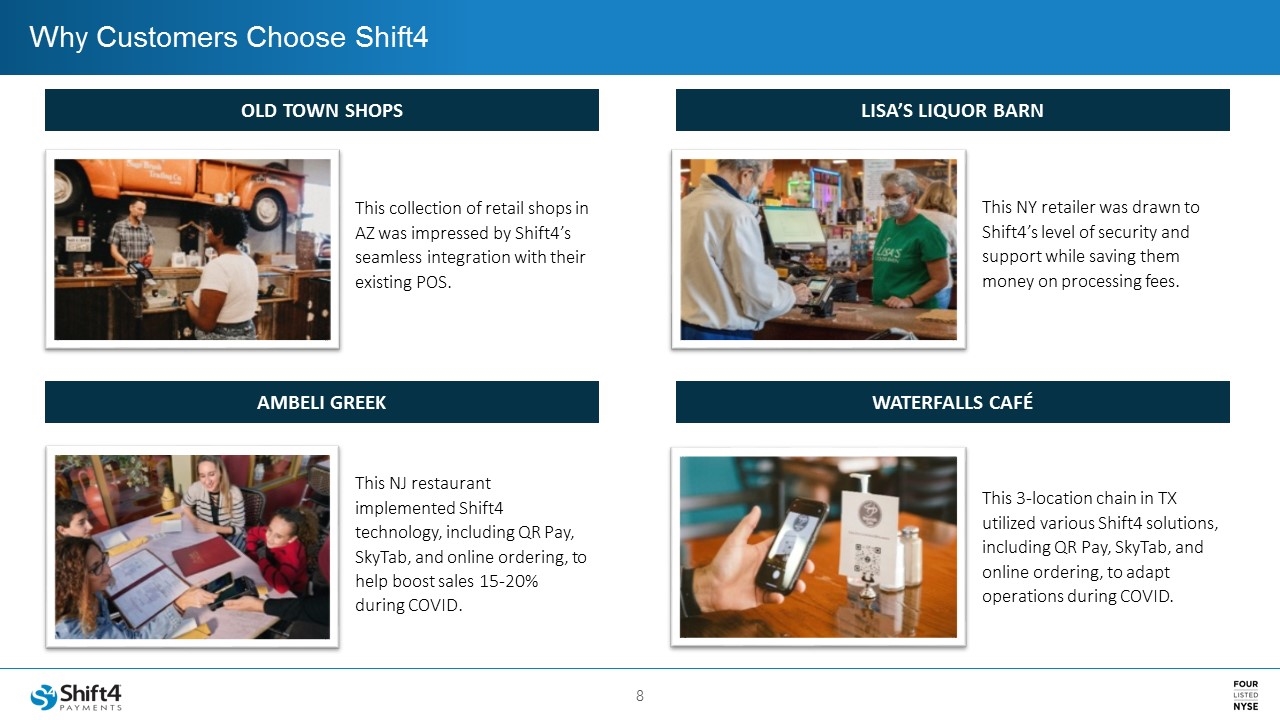
Why Customers Choose Shift4 This NJ restaurant implemented Shift4 technology, including QR Pay, SkyTab, and online ordering, to help boost sales 15-20% during COVID. This 3-location chain in TX utilized various Shift4 solutions, including QR Pay, SkyTab, and online ordering, to adapt operations during COVID. This collection of retail shops in AZ was impressed by Shift4’s seamless integration with their existing POS. This NY retailer was drawn to Shift4’s level of security and support while saving them money on processing fees. OLD TOWN SHOPS WATERFALLS CAFÉ LISA’S LIQUOR BARN AMBELI GREEK

3dcart Acquisition
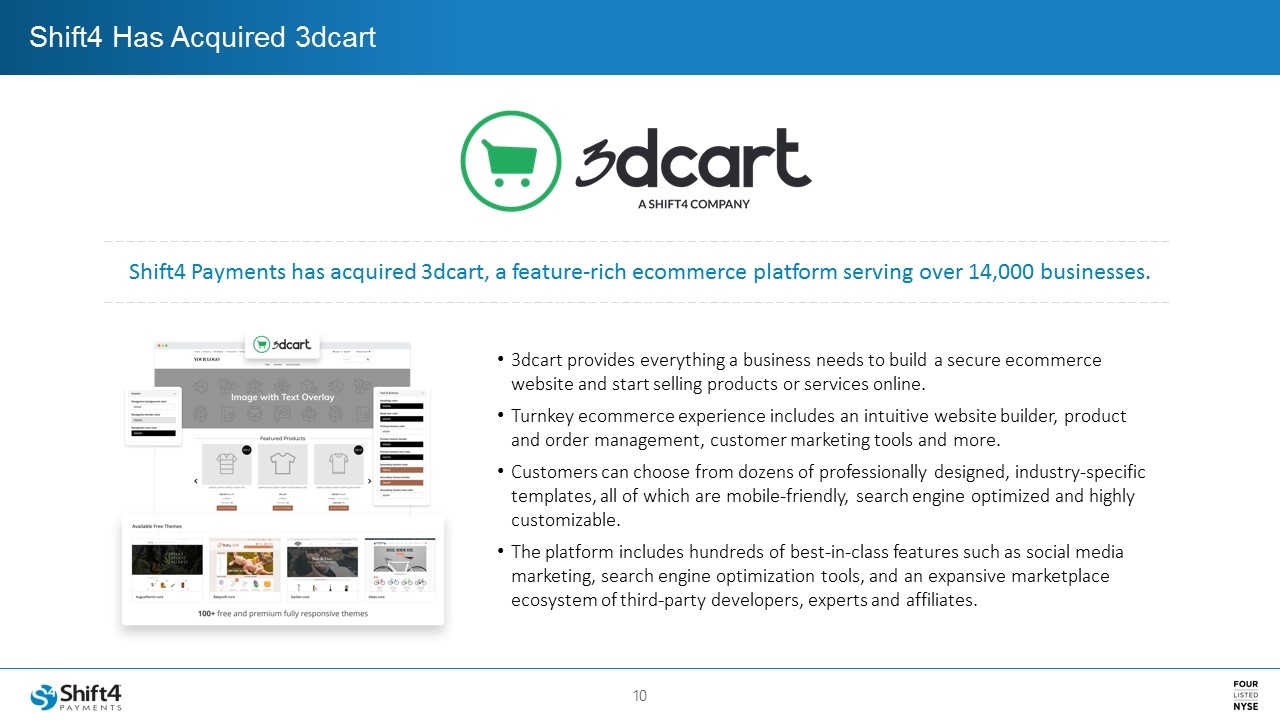
Shift4 Has Acquired 3dcart 3dcart provides everything a business needs to build a secure ecommerce website and start selling products or services online. Turnkey ecommerce experience includes an intuitive website builder, product and order management, customer marketing tools and more. Customers can choose from dozens of professionally designed, industry-specific templates, all of which are mobile-friendly, search engine optimized and highly customizable. The platform includes hundreds of best-in-class features such as social media marketing, search engine optimization tools, and an expansive marketplace ecosystem of third-party developers, experts and affiliates. Shift4 Payments has acquired 3dcart, a feature-rich ecommerce platform serving over 14,000 businesses.
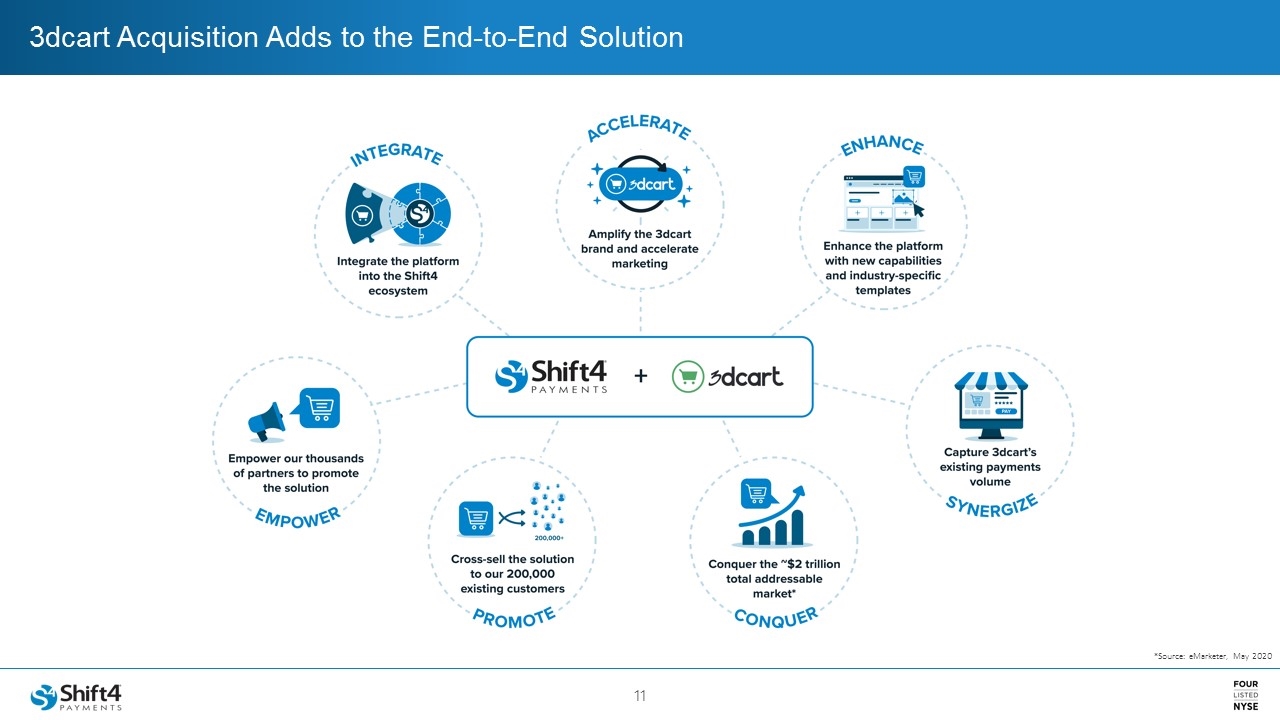
3dcart Acquisition Adds to the End-to-End Solution *Source: eMarketer, May 2020
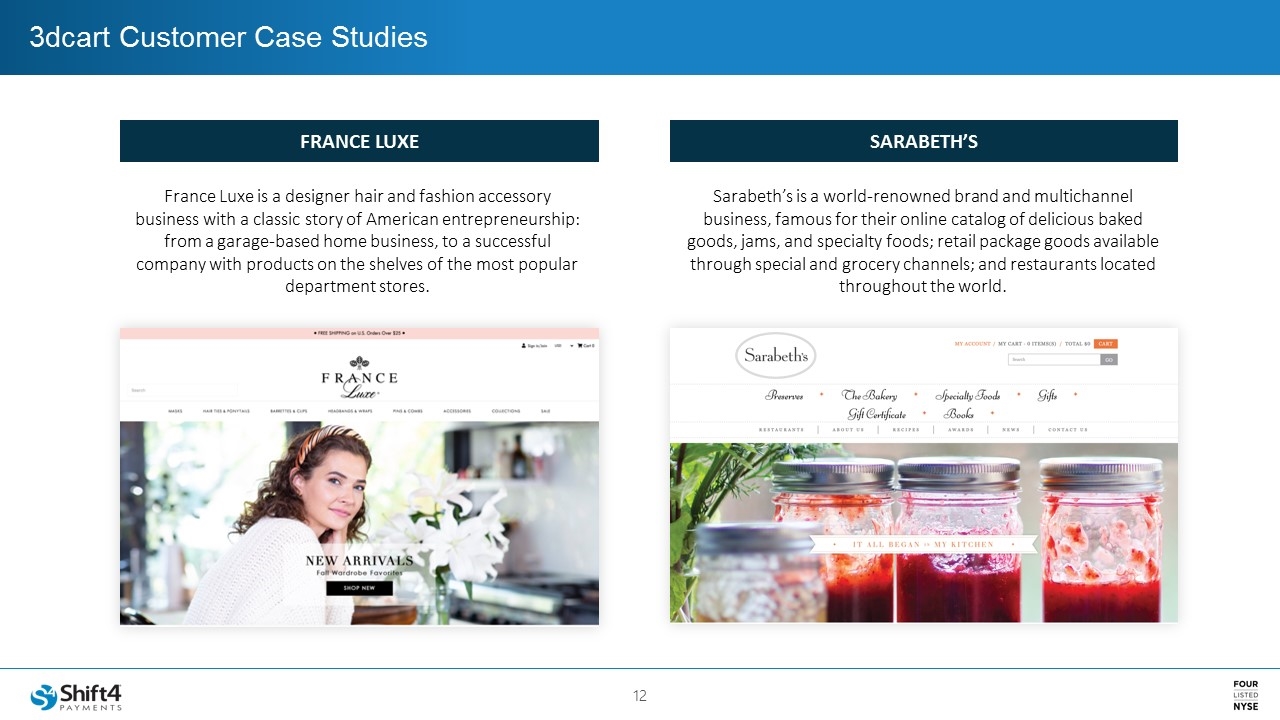
3dcart Customer Case Studies FRANCE LUXE SARABETH’S Sarabeth’s is a world-renowned brand and multichannel business, famous for their online catalog of delicious baked goods, jams, and specialty foods; retail package goods available through special and grocery channels; and restaurants located throughout the world. France Luxe is a designer hair and fashion accessory business with a classic story of American entrepreneurship: from a garage-based home business, to a successful company with products on the shelves of the most popular department stores.

Our Vision
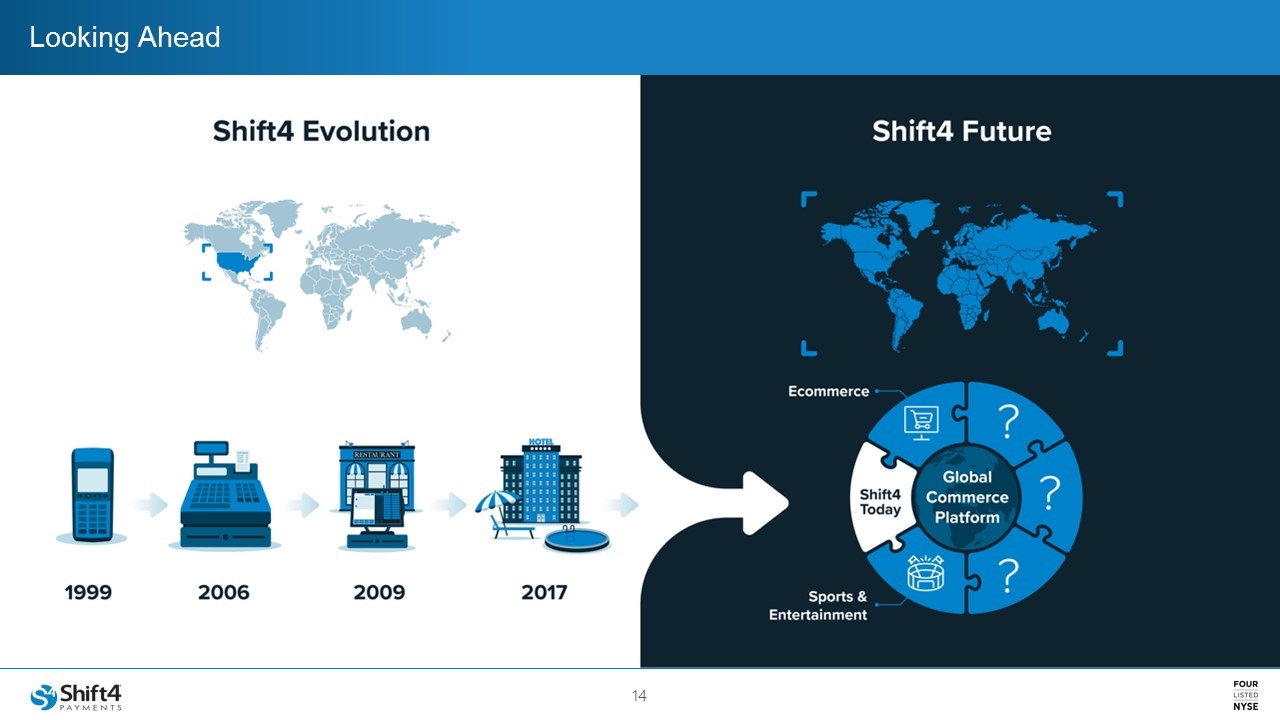
Looking Ahead
Financial Summary
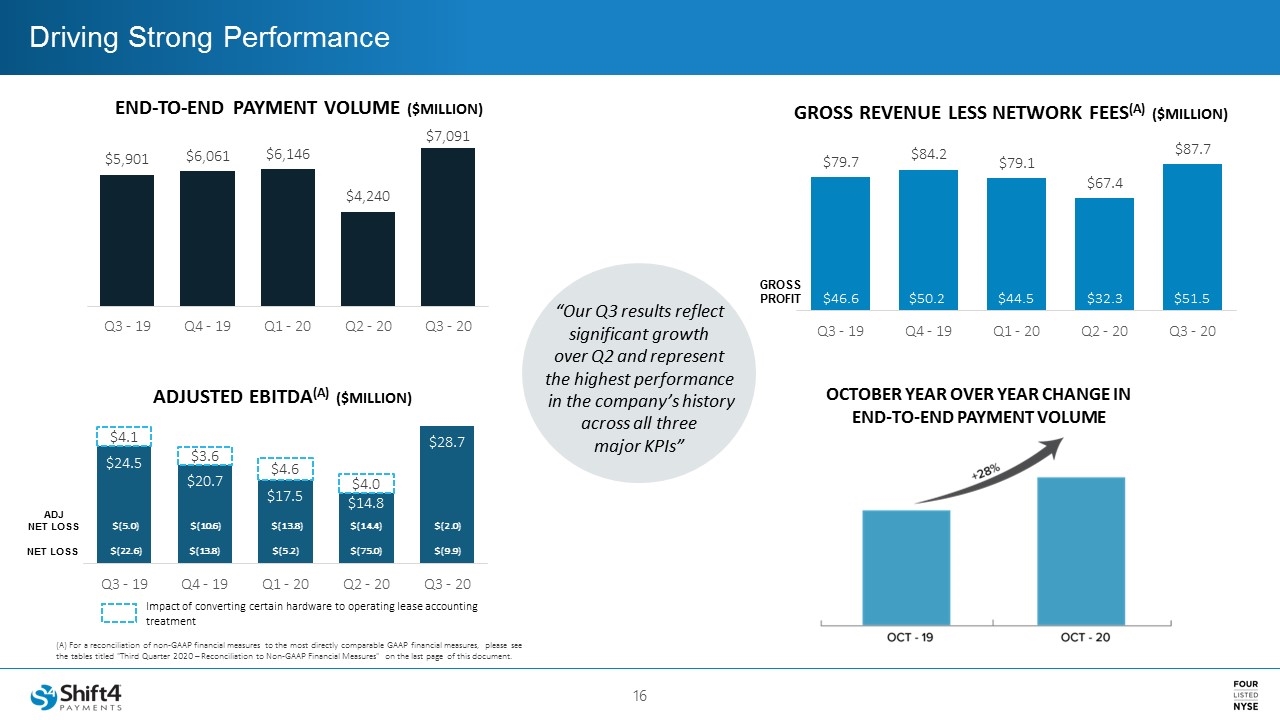
Driving Strong Performance GROSS PROFIT $46.6 $50.2 $44.5 $32.3 $51.5 NET LOSS $(22.6) $(13.8) $(5.2) $(75.0) $(9.9) Impact of converting certain hardware to operating lease accounting treatment (A) For a reconciliation of non-GAAP financial measures to the most directly comparable GAAP financial measures, please see the tables titled "Third Quarter 2020 – Reconciliation to Non-GAAP Financial Measures" on the last page of this document. END-TO-END PAYMENT VOLUME ($MILLION) GROSS REVENUE LESS NETWORK FEES(A) ($MILLION) ADJUSTED EBITDA(A) ($MILLION) “Our Q3 results reflect significant growth over Q2 and represent the highest performance in the company’s history across all three major KPIs” OCTOBER YEAR OVER YEAR CHANGE IN END-TO-END PAYMENT VOLUME ADJ NET LOSS $(5.0) $(10.6) $(13.8) $(14.4) $(2.0)
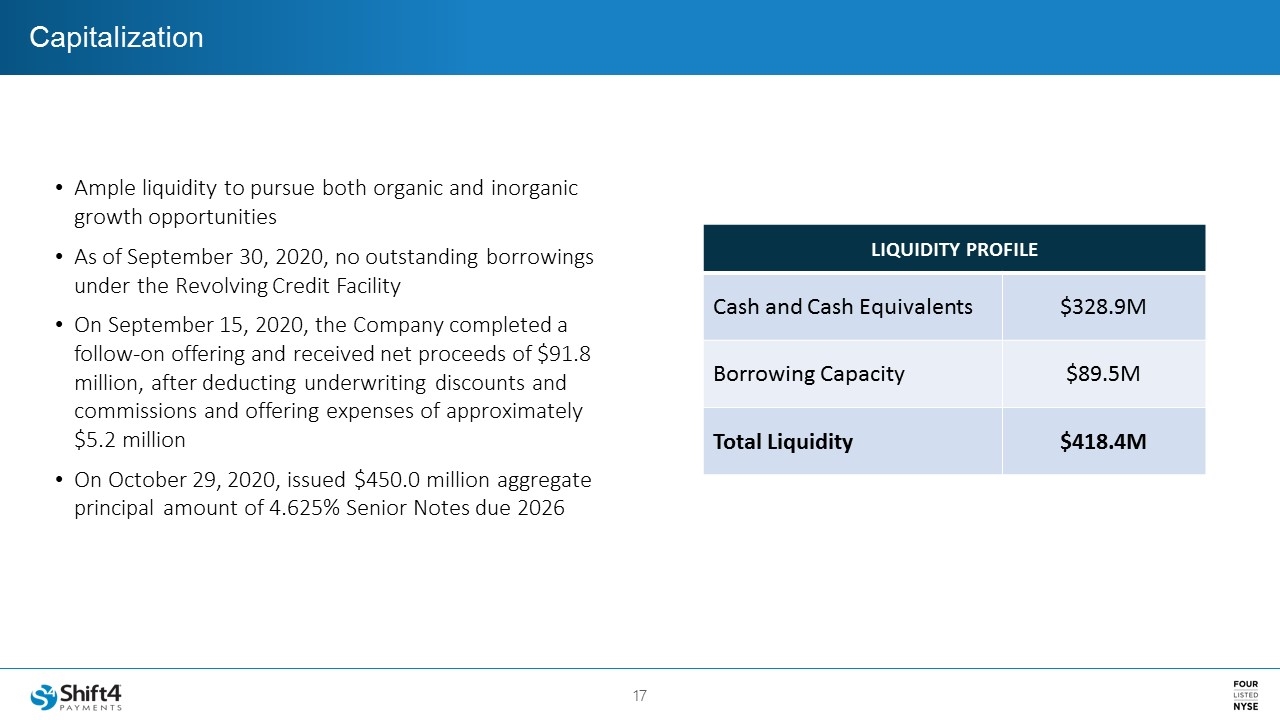
Capitalization Ample liquidity to pursue both organic and inorganic growth opportunities As of September 30, 2020, no outstanding borrowings under the Revolving Credit Facility On September 15, 2020, the Company completed a follow-on offering and received net proceeds of $91.8 million, after deducting underwriting discounts and commissions and offering expenses of approximately $5.2 million On October 29, 2020, issued $450.0 million aggregate principal amount of 4.625% Senior Notes due 2026 LIQUIDITY PROFILE Cash and Cash Equivalents $328.9M Borrowing Capacity $89.5M Total Liquidity $418.4M
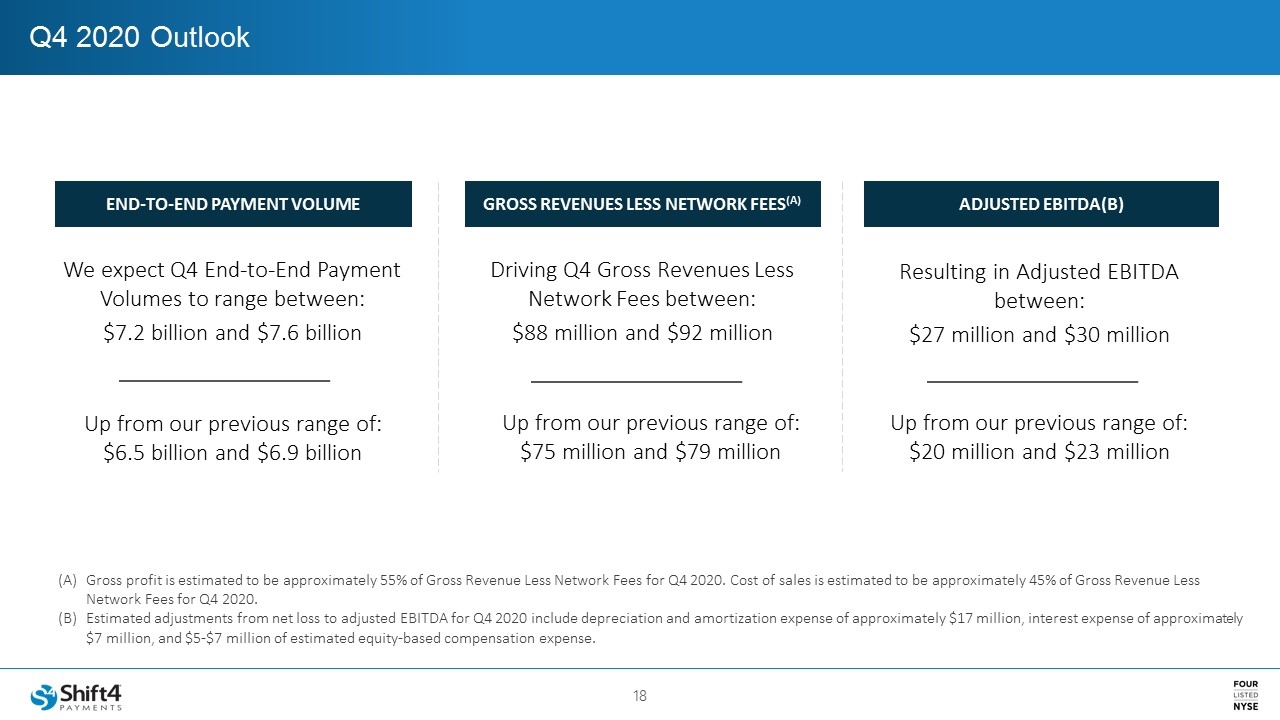
Q4 2020 Outlook END-TO-END PAYMENT VOLUME We expect Q4 End-to-End Payment Volumes to range between: $7.2 billion and $7.6 billion GROSS REVENUES LESS NETWORK FEES(A) Driving Q4 Gross Revenues Less Network Fees between: $88 million and $92 million ADJUSTED EBITDA(B) Resulting in Adjusted EBITDA between: $27 million and $30 million Gross profit is estimated to be approximately 55% of Gross Revenue Less Network Fees for Q4 2020. Cost of sales is estimated to be approximately 45% of Gross Revenue Less Network Fees for Q4 2020. Estimated adjustments from net loss to adjusted EBITDA for Q4 2020 include depreciation and amortization expense of approximately $17 million, interest expense of approximately $7 million, and $5-$7 million of estimated equity-based compensation expense. Up from our previous range of: $6.5 billion and $6.9 billion Up from our previous range of: $75 million and $79 million Up from our previous range of: $20 million and $23 million
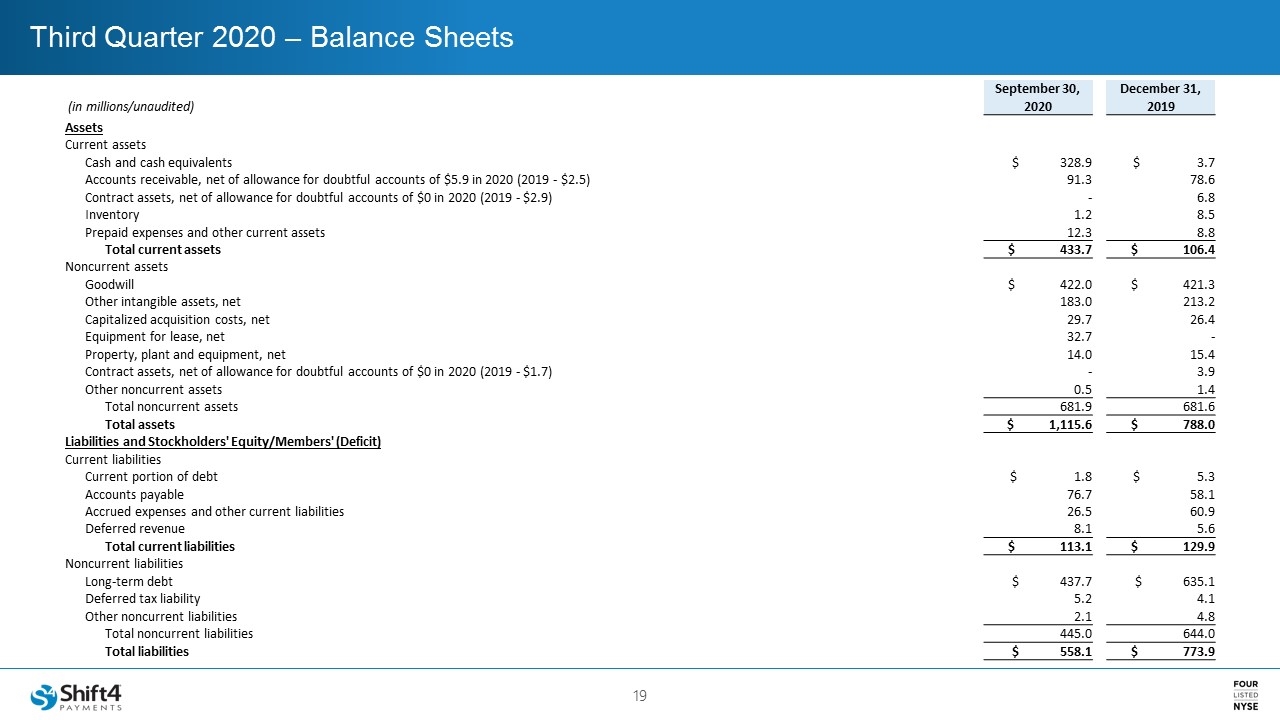
Third Quarter 2020 – Balance Sheets September 30, December 31, (in millions/unaudited) 2020 2019 Assets Current assets Cash and cash equivalents $ 328.9 $ 3.7 Accounts receivable, net of allowance for doubtful accounts of $5.9 in 2020 (2019 - $2.5) 91.3 78.6 Contract assets, net of allowance for doubtful accounts of $0 in 2020 (2019 - $2.9) - 6.8 Inventory 1.2 8.5 Prepaid expenses and other current assets 12.3 8.8 Total current assets $ 433.7 $ 106.4 Noncurrent assets Goodwill $ 422.0 $ 421.3 Other intangible assets, net 183.0 213.2 Capitalized acquisition costs, net 29.7 26.4 Equipment for lease, net 32.7 - Property, plant and equipment, net 14.0 15.4 Contract assets, net of allowance for doubtful accounts of $0 in 2020 (2019 - $1.7) - 3.9 Other noncurrent assets 0.5 1.4 Total noncurrent assets 681.9 681.6 Total assets $ 1,115.6 $ 788.0 Liabilities and Stockholders' Equity/Members' (Deficit) Current liabilities Current portion of debt $ 1.8 $ 5.3 Accounts payable 76.7 58.1 Accrued expenses and other current liabilities 26.5 60.9 Deferred revenue 8.1 5.6 Total current liabilities $ 113.1 $ 129.9 Noncurrent liabilities Long-term debt $ 437.7 $ 635.1 Deferred tax liability 5.2 4.1 Other noncurrent liabilities 2.1 4.8 Total noncurrent liabilities 445.0 644.0 Total liabilities $ 558.1 $ 773.9
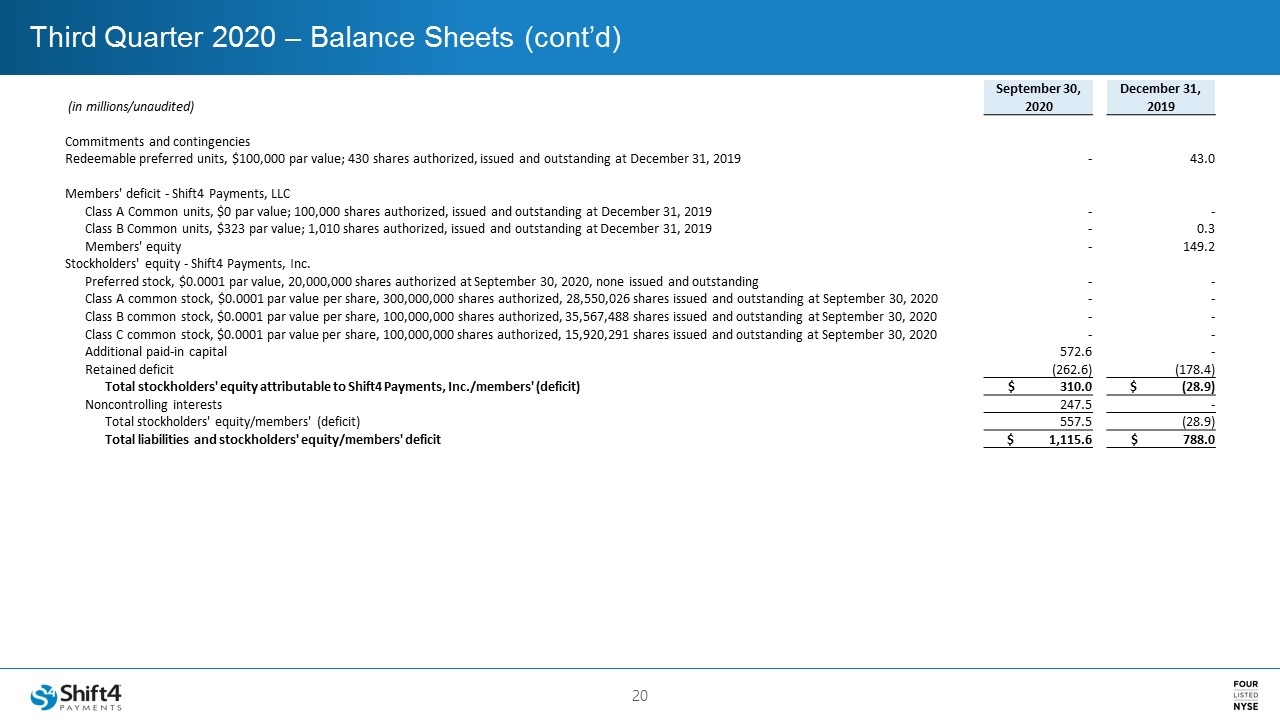
Third Quarter 2020 – Balance Sheets (cont’d) September 30, December 31, (in millions/unaudited) 2020 2019 Commitments and contingencies Redeemable preferred units, $100,000 par value; 430 shares authorized, issued and outstanding at December 31, 2019 - 43.0 Members' deficit - Shift4 Payments, LLC Class A Common units, $0 par value; 100,000 shares authorized, issued and outstanding at December 31, 2019 - - Class B Common units, $323 par value; 1,010 shares authorized, issued and outstanding at December 31, 2019 - 0.3 Members' equity - 149.2 Stockholders' equity - Shift4 Payments, Inc. Preferred stock, $0.0001 par value, 20,000,000 shares authorized at September 30, 2020, none issued and outstanding - - Class A common stock, $0.0001 par value per share, 300,000,000 shares authorized, 28,550,026 shares issued and outstanding at September 30, 2020 - - Class B common stock, $0.0001 par value per share, 100,000,000 shares authorized, 35,567,488 shares issued and outstanding at September 30, 2020 - - Class C common stock, $0.0001 par value per share, 100,000,000 shares authorized, 15,920,291 shares issued and outstanding at September 30, 2020 - - Additional paid-in capital 572.6 - Retained deficit (262.6) (178.4) Total stockholders' equity attributable to Shift4 Payments, Inc./members' (deficit) $ 310.0 $ (28.9) Noncontrolling interests 247.5 - Total stockholders' equity/members' (deficit) 557.5 (28.9) Total liabilities and stockholders' equity/members' deficit $ 1,115.6 $ 788.0
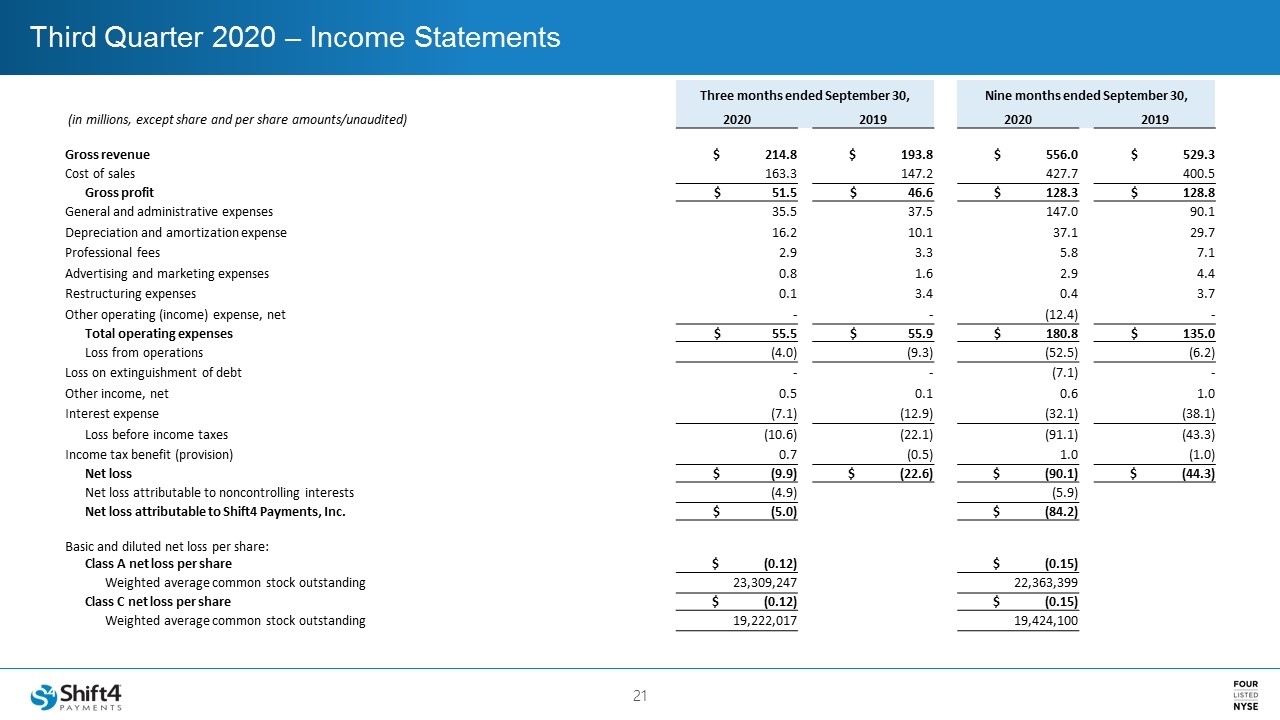
Third Quarter 2020 – Income Statements Three months ended September 30, Nine months ended September 30, (in millions, except share and per share amounts/unaudited) 2020 2019 2020 2019 Gross revenue $ 214.8 $ 193.8 $ 556.0 $ 529.3 Cost of sales 163.3 147.2 427.7 400.5 Gross profit $ 51.5 $ 46.6 $ 128.3 $ 128.8 General and administrative expenses 35.5 37.5 147.0 90.1 Depreciation and amortization expense 16.2 10.1 37.1 29.7 Professional fees 2.9 3.3 5.8 7.1 Advertising and marketing expenses 0.8 1.6 2.9 4.4 Restructuring expenses 0.1 3.4 0.4 3.7 Other operating (income) expense, net - - (12.4) - Total operating expenses $ 55.5 $ 55.9 $ 180.8 $ 135.0 Loss from operations (4.0) (9.3) (52.5) (6.2) Loss on extinguishment of debt - - (7.1) - Other income, net 0.5 0.1 0.6 1.0 Interest expense (7.1) (12.9) (32.1) (38.1) Loss before income taxes (10.6) (22.1) (91.1) (43.3) Income tax benefit (provision) 0.7 (0.5) 1.0 (1.0) Net loss $ (9.9) $ (22.6) $ (90.1) $ (44.3) Net loss attributable to noncontrolling interests (4.9) (5.9) Net loss attributable to Shift4 Payments, Inc. $ (5.0) $ (84.2) Basic and diluted net loss per share: Class A net loss per share $ (0.12) $ (0.15) Weighted average common stock outstanding 23,309,247 22,363,399 Class C net loss per share $ (0.12) $ (0.15) Weighted average common stock outstanding 19,222,017 19,424,100
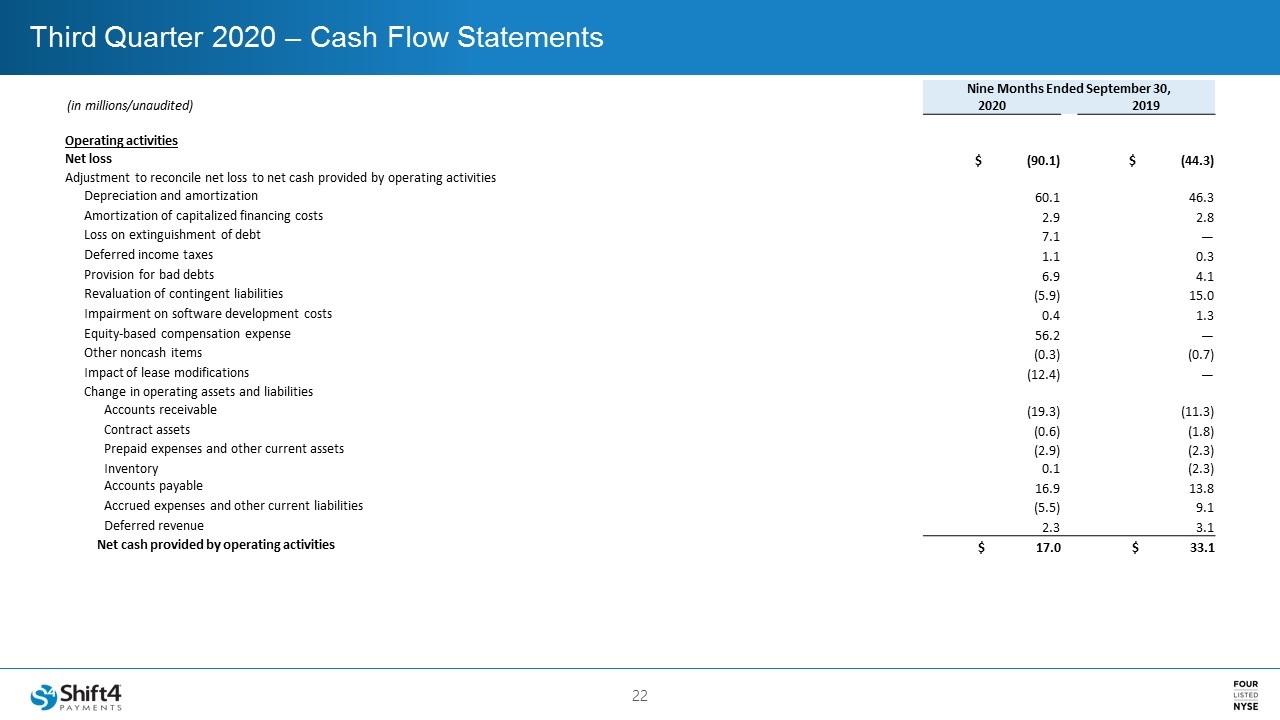
Third Quarter 2020 – Cash Flow Statements Nine Months Ended September 30, (in millions/unaudited) 2020 2019 Operating activities Net loss $ (90.1) $ (44.3) Adjustment to reconcile net loss to net cash provided by operating activities Depreciation and amortization 60.1 46.3 Amortization of capitalized financing costs 2.9 2.8 Loss on extinguishment of debt 7.1 — Deferred income taxes 1.1 0.3 Provision for bad debts 6.9 4.1 Revaluation of contingent liabilities (5.9) 15.0 Impairment on software development costs 0.4 1.3 Equity-based compensation expense 56.2 — Other noncash items (0.3) (0.7) Impact of lease modifications (12.4) — Change in operating assets and liabilities Accounts receivable (19.3) (11.3) Contract assets (0.6) (1.8) Prepaid expenses and other current assets (2.9) (2.3) Inventory 0.1 (2.3) Accounts payable 16.9 13.8 Accrued expenses and other current liabilities (5.5) 9.1 Deferred revenue 2.3 3.1 Net cash provided by operating activities $ 17.0 $ 33.1
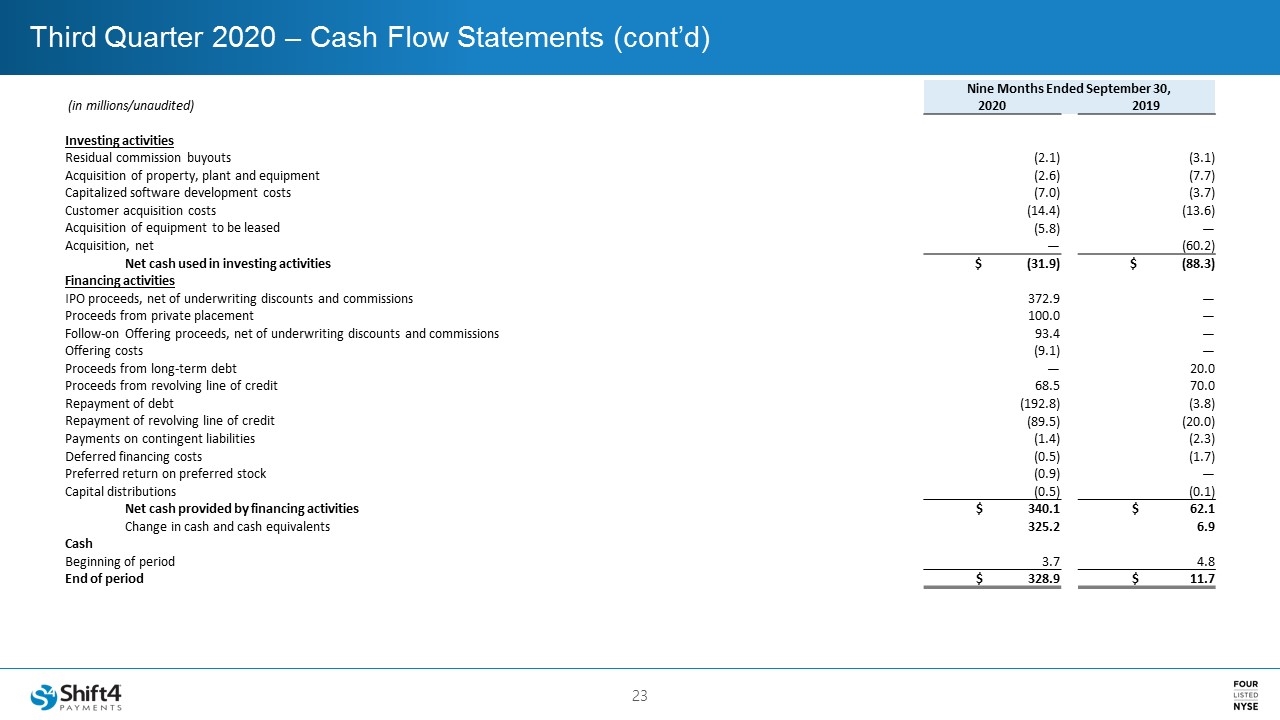
Third Quarter 2020 – Cash Flow Statements (cont’d) Nine Months Ended September 30, (in millions/unaudited) 2020 2019 Investing activities Residual commission buyouts (2.1) (3.1) Acquisition of property, plant and equipment (2.6) (7.7) Capitalized software development costs (7.0) (3.7) Customer acquisition costs (14.4) (13.6) Acquisition of equipment to be leased (5.8) — Acquisition, net — (60.2) Net cash used in investing activities $ (31.9) $ (88.3) Financing activities IPO proceeds, net of underwriting discounts and commissions 372.9 — Proceeds from private placement 100.0 — Follow-on Offering proceeds, net of underwriting discounts and commissions 93.4 — Offering costs (9.1) — Proceeds from long-term debt — 20.0 Proceeds from revolving line of credit 68.5 70.0 Repayment of debt (192.8) (3.8) Repayment of revolving line of credit (89.5) (20.0) Payments on contingent liabilities (1.4) (2.3) Deferred financing costs (0.5) (1.7) Preferred return on preferred stock (0.9) — Capital distributions (0.5) (0.1) Net cash provided by financing activities $ 340.1 $ 62.1 Change in cash and cash equivalents 325.2 6.9 Cash Beginning of period 3.7 4.8 End of period $ 328.9 $ 11.7
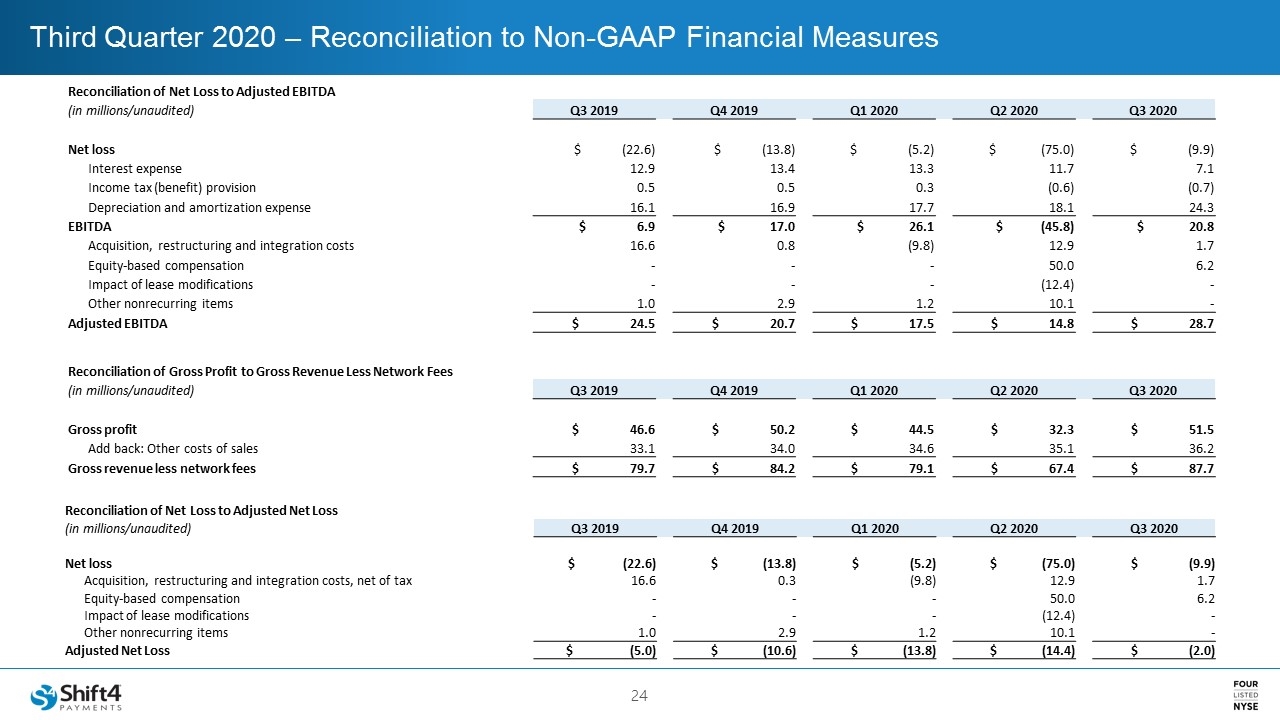
Third Quarter 2020 – Reconciliation to Non-GAAP Financial Measures Reconciliation of Net Loss to Adjusted EBITDA (in millions/unaudited) Q3 2019 Q4 2019 Q1 2020 Q2 2020 Q3 2020 Net loss $ (22.6) $ (13.8) $ (5.2) $ (75.0) $ (9.9) Interest expense 12.9 13.4 13.3 11.7 7.1 Income tax (benefit) provision 0.5 0.5 0.3 (0.6) (0.7) Depreciation and amortization expense 16.1 16.9 17.7 18.1 24.3 EBITDA $ 6.9 $ 17.0 $ 26.1 $ (45.8) $ 20.8 Acquisition, restructuring and integration costs 16.6 0.8 (9.8) 12.9 1.7 Equity-based compensation - - - 50.0 6.2 Impact of lease modifications - - - (12.4) - Other nonrecurring items 1.0 2.9 1.2 10.1 - Adjusted EBITDA $ 24.5 $ 20.7 $ 17.5 $ 14.8 $ 28.7 Reconciliation of Gross Profit to Gross Revenue Less Network Fees (in millions/unaudited) Q3 2019 Q4 2019 Q1 2020 Q2 2020 Q3 2020 Gross profit $ 46.6 $ 50.2 $ 44.5 $ 32.3 $ 51.5 Add back: Other costs of sales 33.1 34.0 34.6 35.1 36.2 Gross revenue less network fees $ 79.7 $ 84.2 $ 79.1 $ 67.4 $ 87.7 Reconciliation of Net Loss to Adjusted Net Loss (in millions/unaudited) Q3 2019 Q4 2019 Q1 2020 Q2 2020 Q3 2020 Net loss $ (22.6) $ (13.8) $ (5.2) $ (75.0) $ (9.9) Acquisition, restructuring and integration costs, net of tax 16.6 0.3 (9.8) 12.9 1.7 Equity-based compensation - - - 50.0 6.2 Impact of lease modifications - - - (12.4) - Other nonrecurring items 1.0 2.9 1.2 10.1 - Adjusted Net Loss $ (5.0) $ (10.6) $ (13.8) $ (14.4) $ (2.0)