
Q1 2022 SHAREHOLDER LETTER INVESTORS.SHIFT4.COM Exhibit 99.1
Non-GAAP Financial Measures and Key Performance Indicators Safe Harbor Statement and Forward Looking Information We use supplemental measures of our performance which are derived from our consolidated financial information but which are not presented in our consolidated financial statements prepared in accordance with generally accepted accounting principles ("GAAP"). These non-GAAP financial measures include: gross revenue less network fees, which includes interchange and assessment fees; adjusted net (loss) income; adjusted net income per share; free cash flow; adjusted free cash flow; earnings before interest expense, income taxes, depreciation, and amortization (“EBITDA”); and Adjusted EBITDA. Gross revenue less network fees represents a key performance metric that management uses to measure changes in the mix and value derived from our customer base as we continue to execute our strategy to expand our reach to serve larger, complex merchants. For the three months ended September 30, 2021 and December 31, 2021, gross revenue less network fees excludes the impact of the payments to merchants, included in "Gross revenue," and payments to partners and associated expenses due to the TSYS outage, included in "Network fees" and "Other costs of sales" in our Consolidated Statements of Operations for the same periods. These are nonrecurring payments that occurred outside of our day-to-day operations, and we have excluded them in order to provide more useful information to investors in the evaluation of our performance period-over period. Adjusted net (loss) income represents net (loss) income adjusted for certain non-cash and other nonrecurring items that management believes are not indicative of ongoing operations, such as the TSYS outage payments and associated costs, acquisition, restructuring and integration costs, equity-based compensation expense, and other nonrecurring items. Adjusted EBITDA is the primary financial performance measure used by management to evaluate its business and monitor results of operations. Adjusted EBITDA represents EBITDA further adjusted for certain non- cash and other nonrecurring items that management believes are not indicative of ongoing operations. These adjustments include TSYS outage payments and associated costs, acquisition, restructuring and This presentation contains forward-looking statements within the meaning of the Private Securities Litigation Reform Act of 1995. All statements contained in this presentation that do not relate to matters of historical fact should be considered forward-looking statements, including statements regarding Shift4 Payments, Inc.’s (“our”, the “Company” or "Shift4”) expectations regarding new customers; acquisitions and other transactions, including Finaro and The Giving Block and our ability to consummate the Finaro acquisition on the timeline we expect or at all; our plans and agreements regarding future payment processing commitments; our expectations with respect to economic recovery; and anticipated financial performance, including our financial outlook for fiscal year 2022 and future periods. These statements are neither promises nor guarantees, but involve known and unknown risks, uncertainties and other important factors that may cause our actual results, performance or achievements to be materially different from any future results, performance or achievements expressed or implied by the forward- looking statements, including, but not limited to, the following: the effect of the COVID-19 global pandemic and any variants of the virus on our business and results of operations; our ability to differentiate ourselves from our competitors and compete effectively; our ability to anticipate and respond to changing industry trends and merchant and consumer integration costs, equity-based compensation expense and other nonrecurring items. Free cash flow represents net cash provided by operating activities adjusted for non-discretionary capital expenditures. Adjusted free cash flow represents free cash flow further adjusted for certain transactions that are not indicative of future operating cash flows, including changes in working capital exclusively related to the calendar effect on settlement funding balances, supply chain purchases accelerated to avoid procurement issues, payments and costs associated with the TSYS outage, acquisition, restructuring and integration costs, the impact of timing of annual performance bonuses, and payroll taxes on IPO-related equity-based compensation that are not indicative of ongoing activities. We believe adjusted free cash flow is useful to measure the funds generated in a given period that are available to invest in the business, to repurchase stock and to make strategic decisions. We believe this supplemental information enhances shareholders’ ability to evaluate the Company’s performance. The Adjusted EBITDA conversion rate is calculated as Adjusted Free Cash Flow divided by Adjusted EBITDA. We use non-GAAP financial measures to supplement financial information presented on a GAAP basis. We believe that excluding certain items from our GAAP results allows management to better understand our consolidated financial performance from period to period and better project our future consolidated financial performance as forecasts are developed at a level of detail different from that used to prepare GAAP-based financial measures. Moreover, we believe these non- GAAP financial measures provide our stakeholders with useful information to help them evaluate our operating results by facilitating an enhanced understanding of our operating performance and enabling them to make more meaningful period to period comparisons. There are limitations to the use of the non-GAAP financial measures presented in this presentation. Our non-GAAP financial measures may not be comparable to similarly titled measures of needs; our ability to continue making acquisitions of businesses or assets; our ability to continue to expand our market share or expand into new markets; our reliance on third-party vendors to provide products and services; our ability to integrate our services and products with operating systems, devices, software and web browsers; our ability to maintain merchant and software partner relationships and strategic partnerships; the effects of global economic, political and other conditions on consumer, business and government spending; our compliance with governmental regulation and other legal obligations, particularly related to privacy, data protection and information security, and consumer protection laws; our ability to establish, maintain and enforce effective risk management policies and procedures; our ability to protect our systems and data from continually evolving cybersecurity risks, security breaches and other technological risks; potential harm caused by software defects, computer viruses and development delays; the effect of degradation of the quality of the products and services we offer; potential harm caused by increased customer attrition; potential harm caused by fraud by merchants or others; potential harm caused by damage to our reputation or brands; our ability to recruit, retain and develop qualified personnel; our reliance on a single or limited number of suppliers; the effects of seasonality and volatility on our operating other companies. Other companies, including companies in our industry, may calculate non-GAAP financial measures differently than we do, limiting the usefulness of those measures for comparative purposes. The non-GAAP financial measures are not meant to be considered as indicators of performance in isolation from or as a substitute for net income (loss) prepared in accordance with GAAP, and should be read only in conjunction with financial information presented on a GAAP basis. Reconciliations each of EBITDA and Adjusted EBITDA, gross revenue less network fees, adjusted net (loss) income, adjusted net income per share, free cash flow and adjusted free cash flow to its most directly comparable GAAP financial measure are presented at the end of this presentation. We are unable to provide a reconciliation of Adjusted EBITDA for 2023 to net loss, the nearest comparable GAAP measure, without unreasonable efforts. We encourage you to review the reconciliations in conjunction with the presentation of the non-GAAP financial measures for each of the periods presented. In future fiscal periods, we may exclude such items and may incur income and expenses similar to these excluded items. In addition, key performance indicators include end-to-end payment volume, spread and margin. End-to-end payment volume is defined as the total dollar amount of card payments that we authorize and settle on behalf of our merchants plus total cryptocurrency amounts transacted, translated at the spot price to U.S. dollars. This volume does not include volume processed through our gateway-only merchants. Spread represents the average yield Shift4 earns on the average end-to-end payment volume processed for a given period after network fees. Spread is calculated as payments-based revenue less gateway revenue and network fees for a given period divided by the end-to- end payment volume processed for the similar period. Margin represents Adjusted EBITDA divided by gross revenue less network fees. results; the effect of various legal proceedings; our ability to raise additional capital to fund our operations; our ability to protect, enforce and defend our intellectual property rights; our ability to establish and maintain effective internal control over financial reporting and disclosure controls and procedures; our compliance with laws, regulations and enforcement activities that affect our industry; our dependence on distributions from Shift4 Payments, LLC to pay our taxes and expenses, including payments under the Tax Receivable Agreement; and the significant influence Rook has over us, including control over decisions that require the approval of stockholders. These and other important factors are described in “Cautionary Note Regarding Forward-Looking Statements,” and “Risk Factors” in Part I, Item 1A. in our Annual Report on Form 10-K for the year ended December 31, 2021, could cause actual results to differ materially from those indicated by the forward-looking statements made in this presentation. Any such forward-looking statements represent management’s estimates as of the date of this presentation. While we may elect to update such forward-looking statements at some point in the future, we disclaim any obligation to do so, even if subsequent events cause our views to change. 2
Dear Shareholders, Over the last two years, the world has faced some unique and unpredictable challenges. These include the social distancing restrictions and various COVID variants that impacted families and businesses everywhere and especially the merchants we serve in our core restaurant and hospitality verticals. With COVID came tragedy, self- reflection, resignation, work-from-home productivity chaos, supply chain disruptions and, only recently, inflation. Additionally, the world was not spared from social injustice and humanitarian crisis with the conflict in Ukraine. The economic uncertainly that these factors present is notable. These hardships remind us that despite good progress since the pandemic began, the world is far from healthy. We are still a small company at Shift4, but we are trying to make global contributions through our technology and services. We also believe we can make an impact as individuals and through our various Shift4Cares initiatives. Turning to the business, we completed a reasonably strong quarter exceeding expectations in all key performance indicators. We grew end-to-end volume by approximately 70% YoY despite an unanticipated impact from the COVID Omicron variant, finishing with record March volumes. For comparison, end-to-end volume was 288% of pre-pandemic 2019 levels (Q1-2022 vs Q1-2019). Even more impressive, is we had virtually no payment volume contribution from our new verticals this past quarter. For example, we processed less than 1% of the anticipated annual volume from St. Jude and BetMGM, while Starlink and Allegiant Airlines are not expected to begin processing until later in the quarter. There is plenty to be excited about in terms of our major organic and inorganic initiatives. We have made considerable progress with Finaro while working through the regulatory approval process. Our progress includes developing commercial opportunities and even recently running successful cross-border test transactions between our two platforms. We are incredibly excited about our ongoing international expansion plans and the ability to serve our signature customers, like Starlink, all over the world. With respect to organic initiatives, we continue to ramp SkyTab POS production in preparation for our full launch. Similarly, we have begun two other major internal initiatives that we expect to accelerate the conversion of gateway volume to our end-to-end service, as well as increase the productivity and margin profile of our entire organization. Even with the early Omicron drag and the general macro uncertainty, we are reaffirming our previously provided 2022 guidance. We take further comfort having observed continued volume records in April and remain cautiously optimistic based on the demand signal we have observed across the travel and hospitality industries. It is also worth stating that the organic initiatives, referenced above, could potentially make a meaningful impact on 2022 performance, and as early as the second quarter. As mentioned above, our commitments go beyond the financial performance of the business and include individual and team contributions as part of our Shift4Cares program. Such commitments include volunteer work and numerous fundraisers. You can learn more at www.shift4cares.com, but I am so proud that our employees have teamed with numerous non-profits and have recently raised several million in donations. From March 1 - April 30, our Giving Block technology has powered more than $15 million in donations to non-profit organizations as part of our “Caring with Crypto” campaign. This is who we are at FOUR. Despite what was another interesting quarter in the world, I am proud of what our team has accomplished. As always, I welcome your feedback, ideas and opportunities as we move Boldly Forward together. 3 Jared Isaacman CEO jared@shift4.com
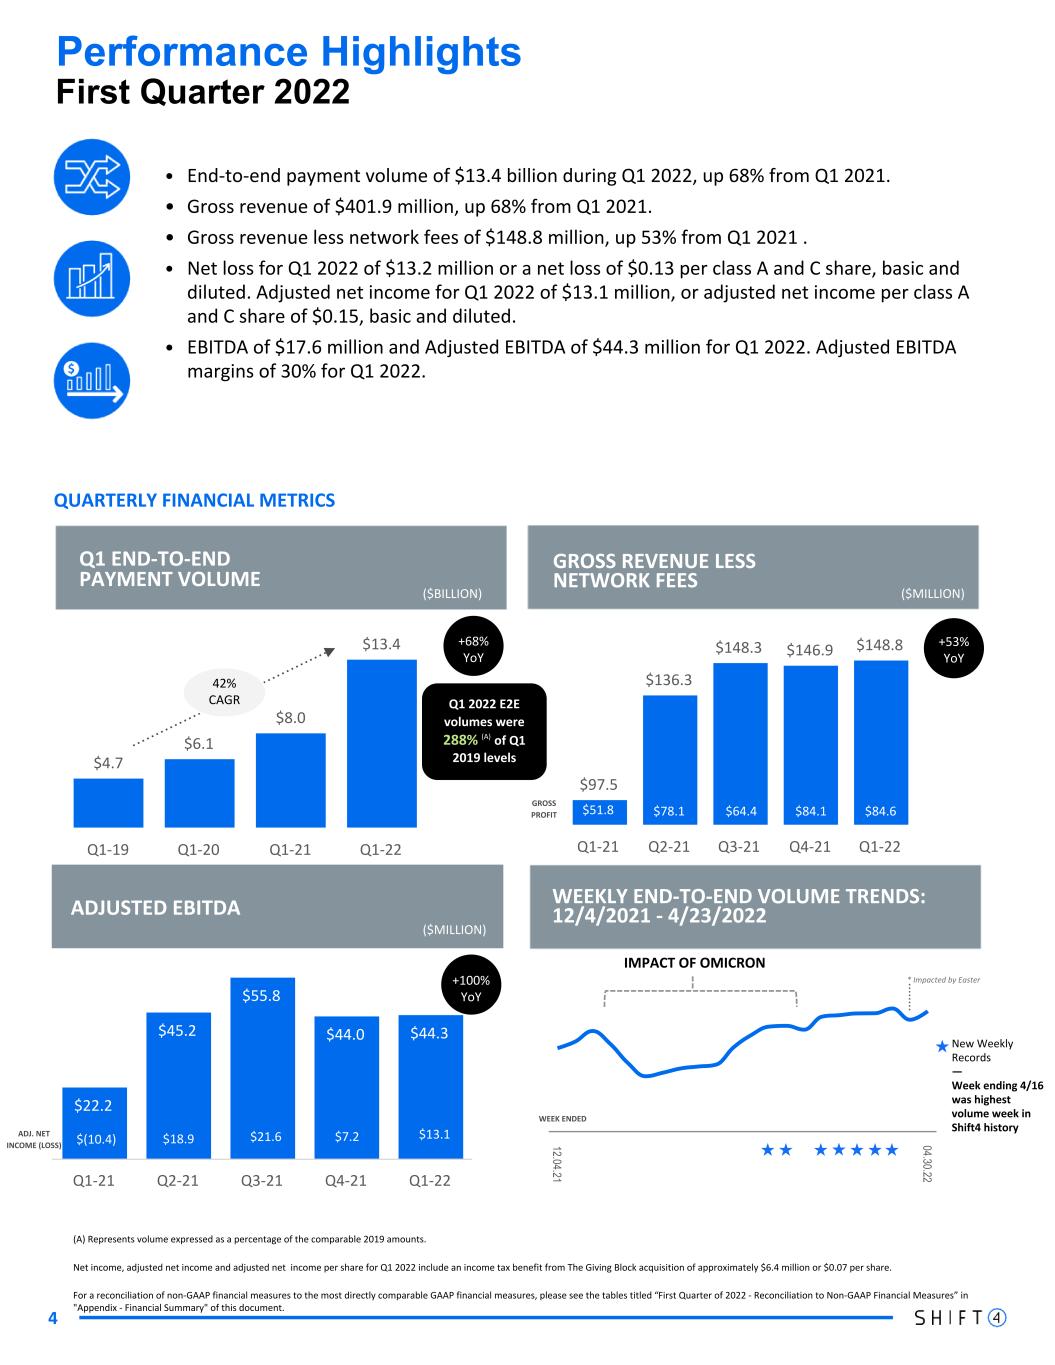
4 (A) Represents volume expressed as a percentage of the comparable 2019 amounts. Net income, adjusted net income and adjusted net income per share for Q1 2022 include an income tax benefit from The Giving Block acquisition of approximately $6.4 million or $0.07 per share. For a reconciliation of non-GAAP financial measures to the most directly comparable GAAP financial measures, please see the tables titled “First Quarter of 2022 - Reconciliation to Non-GAAP Financial Measures” in "Appendix - Financial Summary" of this document. Q1 END-TO-END PAYMENT VOLUME ADJUSTED EBITDA GROSS REVENUE LESS NETWORK FEES WEEKLY END-TO-END VOLUME TRENDS: 12/4/2021 - 4/23/2022 ($BILLION) ($MILLION) First Quarter 2022 $(1.9) QUARTERLY FINANCIAL METRICS • End-to-end payment volume of $13.4 billion during Q1 2022, up 68% from Q1 2021. • Gross revenue of $401.9 million, up 68% from Q1 2021. • Gross revenue less network fees of $148.8 million, up 53% from Q1 2021 . • Net loss for Q1 2022 of $13.2 million or a net loss of $0.13 per class A and C share, basic and diluted. Adjusted net income for Q1 2022 of $13.1 million, or adjusted net income per class A and C share of $0.15, basic and diluted. • EBITDA of $17.6 million and Adjusted EBITDA of $44.3 million for Q1 2022. Adjusted EBITDA margins of 30% for Q1 2022. Performance Highlights $4.7 $6.1 $8.0 $13.4 Q1-19 Q1-20 Q1-21 Q1-22 $22.2 $45.2 $55.8 $44.0 $44.3 Q1-21 Q2-21 Q3-21 Q4-21 Q1-22 ($MILLION) GROSS PROFIT $97.5 $136.3 $148.3 $146.9 $148.8 Q1-21 Q2-21 Q3-21 Q4-21 Q1-22 $64.4$51.8 $78.1 $84.1 $84.6 +53% YoY +100% YoY 12.04.21 04.30.22 IMPACT OF OMICRON ADJ. NET INCOME (LOSS) WEEK ENDED New Weekly Records — Week ending 4/16 was highest volume week in Shift4 history $(10.4) $21.6$18.9 $7.2 $13.1 42% CAGR +68% YoY * Impacted by Easter Q1 2022 E2E volumes were 288% (A) of Q1 2019 levels ★★ ★★★★ ★ ★
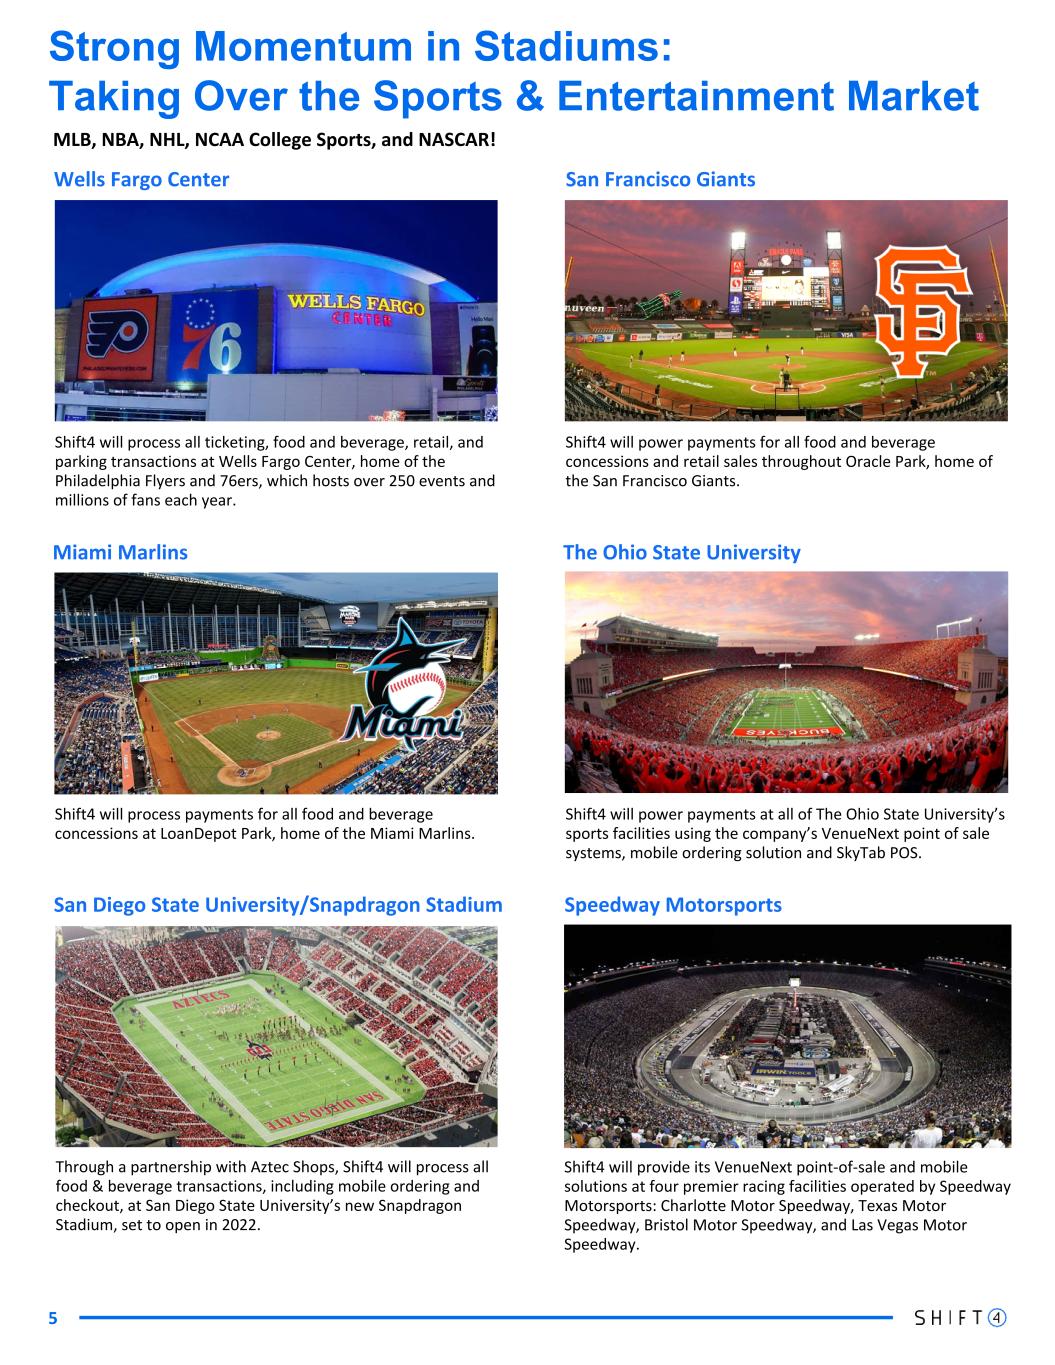
Strong Momentum in Stadiums: Taking Over the Sports & Entertainment Market MLB, NBA, NHL, NCAA College Sports, and NASCAR! Shift4 will process all ticketing, food and beverage, retail, and parking transactions at Wells Fargo Center, home of the Philadelphia Flyers and 76ers, which hosts over 250 events and millions of fans each year. 5 Shift4 will power payments for all food and beverage concessions and retail sales throughout Oracle Park, home of the San Francisco Giants. Wells Fargo Center San Francisco Giants Shift4 will process payments for all food and beverage concessions at LoanDepot Park, home of the Miami Marlins. Miami Marlins Through a partnership with Aztec Shops, Shift4 will process all food & beverage transactions, including mobile ordering and checkout, at San Diego State University’s new Snapdragon Stadium, set to open in 2022. San Diego State University/Snapdragon Stadium Shift4 will provide its VenueNext point-of-sale and mobile solutions at four premier racing facilities operated by Speedway Motorsports: Charlotte Motor Speedway, Texas Motor Speedway, Bristol Motor Speedway, and Las Vegas Motor Speedway. Speedway Motorsports Shift4 will power payments at all of The Ohio State University’s sports facilities using the company’s VenueNext point of sale systems, mobile ordering solution and SkyTab POS. The Ohio State University

Strong Momentum in High Growth Core: It's Not Slowing Down! Combination of gateway conversions and net new wins 6 Shift4 processes all front desk, food and beverage, and retail transactions at Santa Claran Casino Resort, located in northern New Mexico’s scenic Española Valley near Santa Fe. Santa Claran Through a partnership with Ark Restaurants Corp, Shift4 will power payments for all food and beverage facilities at New Jersey’s Meadowlands Racing and Entertainment, home to world- class horse racing, dining, entertainment & sports wagering. Meadowlands Racing & Entertainment Nestled among the hills of Indiana’s Hoosier National Forest, French Lick Resort is home to two AAA Four-Diamond hotels, three golf courses, two spas, impressive meeting venues and a Vegas-style casino. French Lick Resort Opening in 2022, Future Legends is a 118-acre sports complex near Denver, CO designed to host major tournaments, events, leagues, and more with state-of-the-art facilities for a wide range of sports as well as lodging, retail and more. Future Legends Set on 1,200 rolling acres in the heart of Napa Valley, Silverado Resort combines luxurious accommodations with contemporary meeting facilities, world-class dining, a full-service spa, two PGA championship golf courses, and more. Silverado Resort and Spa Featuring the collaboration of two-Michelin starred Chef Tetsuya Wakuda and award-winning restaurateur John Kunkel, WAKUDA will redefine authentic modern Japanese cuisine when it opens this summer at The Venetian Resort. WAKUDA Las Vegas
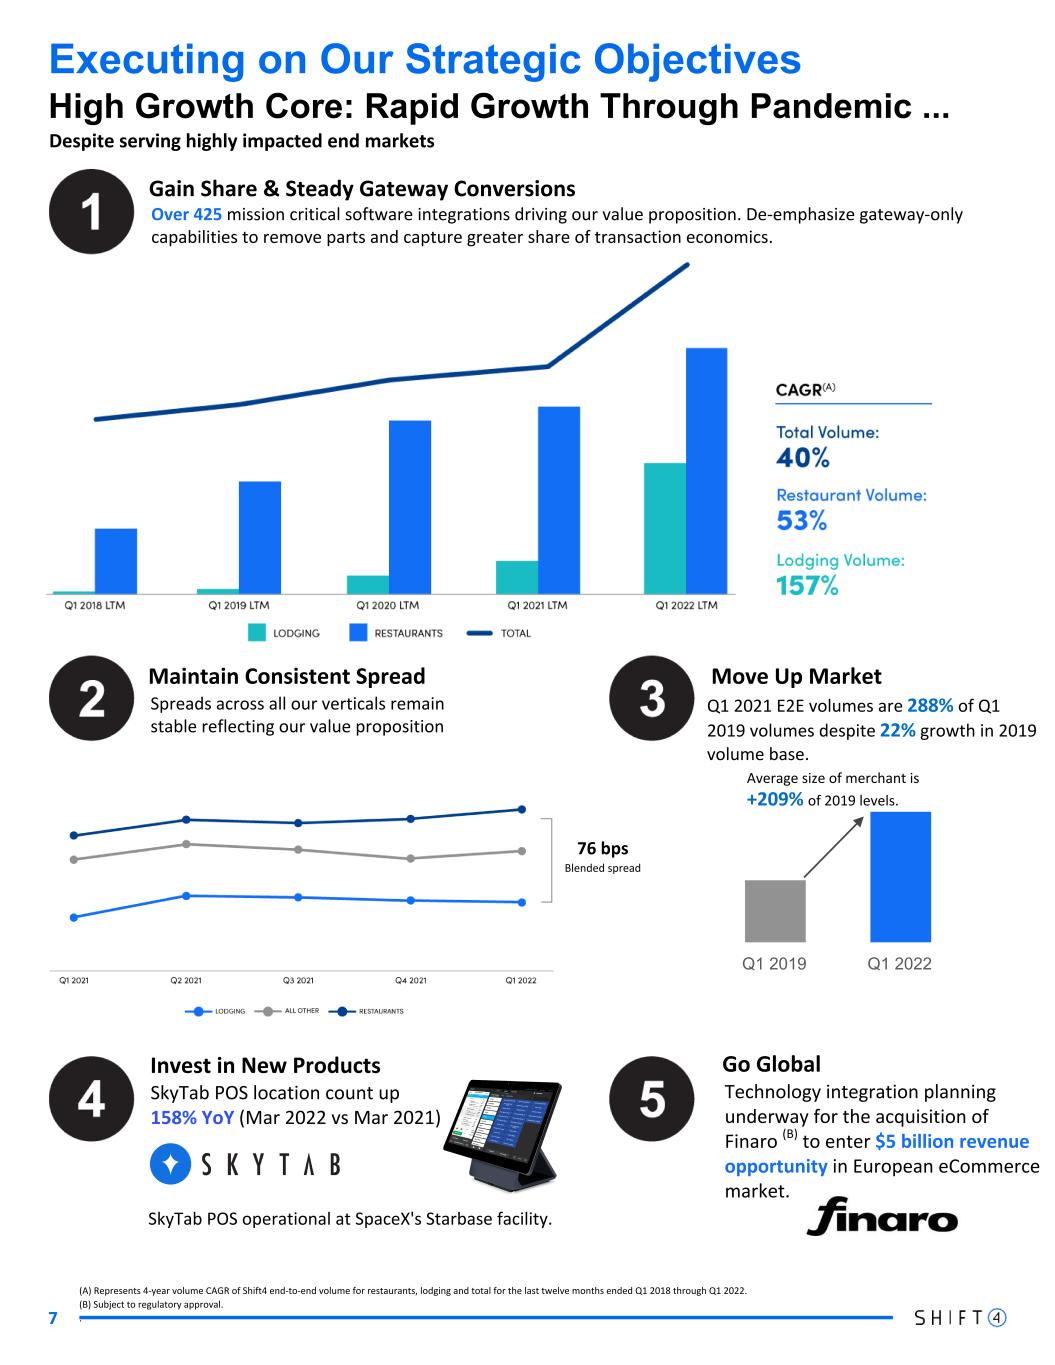
7 Executing on Our Strategic Objectives High Growth Core: Rapid Growth Through Pandemic ... (A) Represents 4-year volume CAGR of Shift4 end-to-end volume for restaurants, lodging and total for the last twelve months ended Q1 2018 through Q1 2022. (B) Subject to regulatory approval. . Over 425 mission critical software integrations driving our value proposition. De-emphasize gateway-only capabilities to remove parts and capture greater share of transaction economics. Gain Share & Steady Gateway Conversions Spreads across all our verticals remain stable reflecting our value proposition Maintain Consistent Spread Q1 2021 E2E volumes are 288% of Q1 2019 volumes despite 22% growth in 2019 volume base. Move Up Market Invest in New Products Go Global 76 bps Blended spread SkyTab POS location count up 158% YoY (Mar 2022 vs Mar 2021) Technology integration planning underway for the acquisition of Finaro (B) to enter $5 billion revenue opportunity in European eCommerce market. SkyTab POS operational at SpaceX's Starbase facility. Despite serving highly impacted end markets Q1 2019 Q1 2022 Average size of merchant is +209% of 2019 levels.
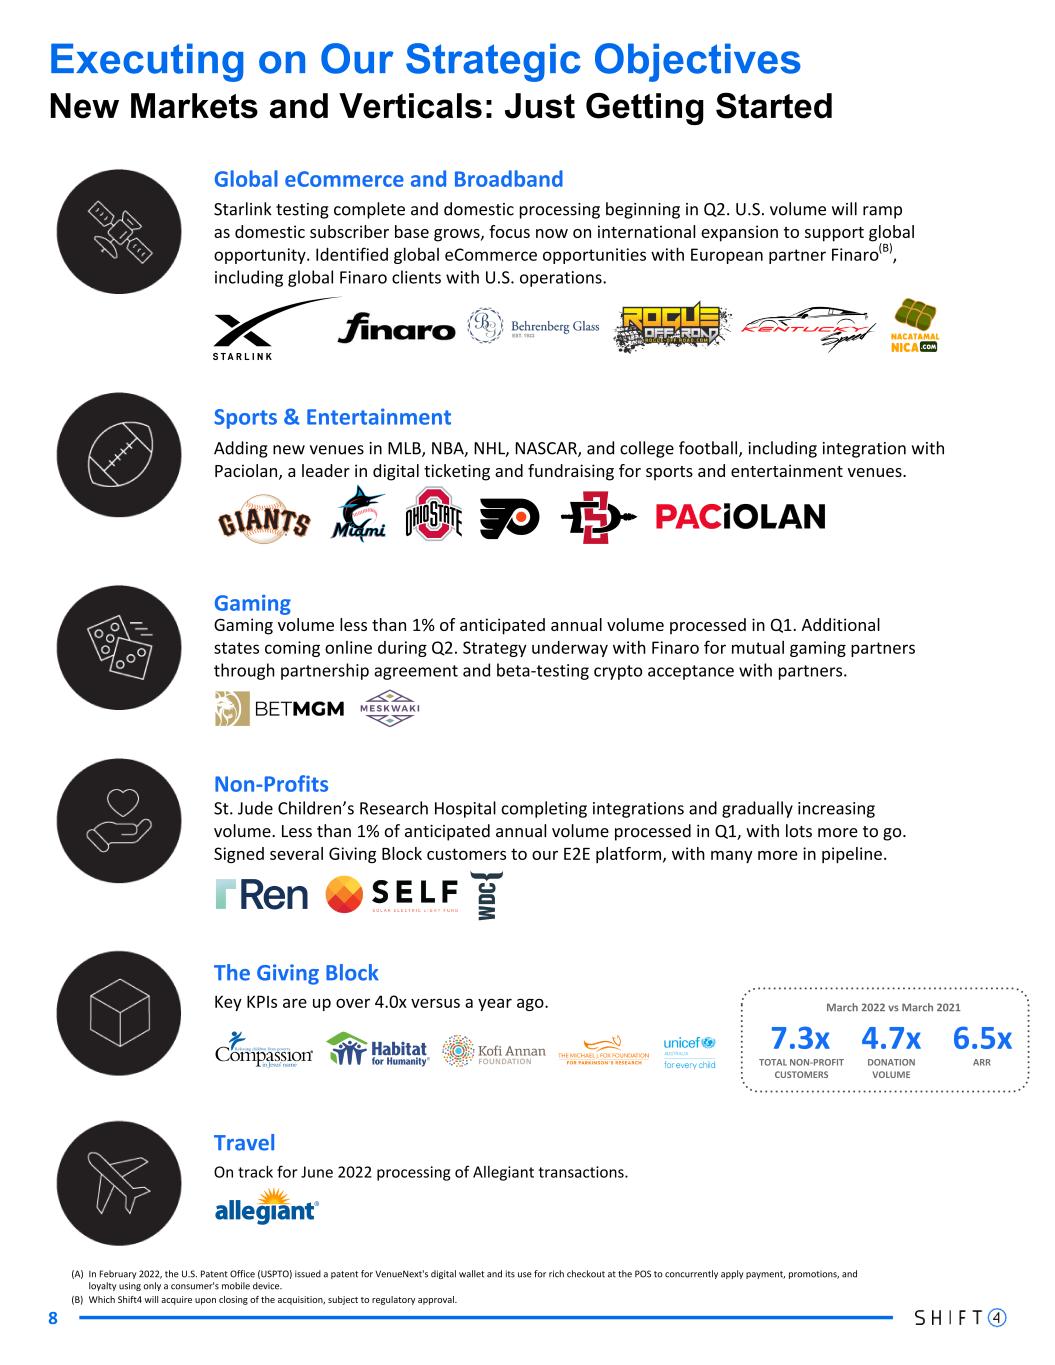
8 Executing on Our Strategic Objectives New Markets and Verticals: Just Getting Started (A) In February 2022, the U.S. Patent Office (USPTO) issued a patent for VenueNext's digital wallet and its use for rich checkout at the POS to concurrently apply payment, promotions, and loyalty using only a consumer's mobile device. (B) Which Shift4 will acquire upon closing of the acquisition, subject to regulatory approval. Starlink testing complete and domestic processing beginning in Q2. U.S. volume will ramp as domestic subscriber base grows, focus now on international expansion to support global opportunity. Identified global eCommerce opportunities with European partner Finaro(B), including global Finaro clients with U.S. operations. Adding new venues in MLB, NBA, NHL, NASCAR, and college football, including integration with Paciolan, a leader in digital ticketing and fundraising for sports and entertainment venues. On track for June 2022 processing of Allegiant transactions. St. Jude Children’s Research Hospital completing integrations and gradually increasing volume. Less than 1% of anticipated annual volume processed in Q1, with lots more to go. Signed several Giving Block customers to our E2E platform, with many more in pipeline. Gaming volume less than 1% of anticipated annual volume processed in Q1. Additional states coming online during Q2. Strategy underway with Finaro for mutual gaming partners through partnership agreement and beta-testing crypto acceptance with partners. Global eCommerce and Broadband Sports & Entertainment Gaming Non-Profits Travel Key KPIs are up over 4.0x versus a year ago. The Giving Block 7.3x 4.7x 6.5x ARRDONATION VOLUME TOTAL NON-PROFIT CUSTOMERS March 2022 vs March 2021
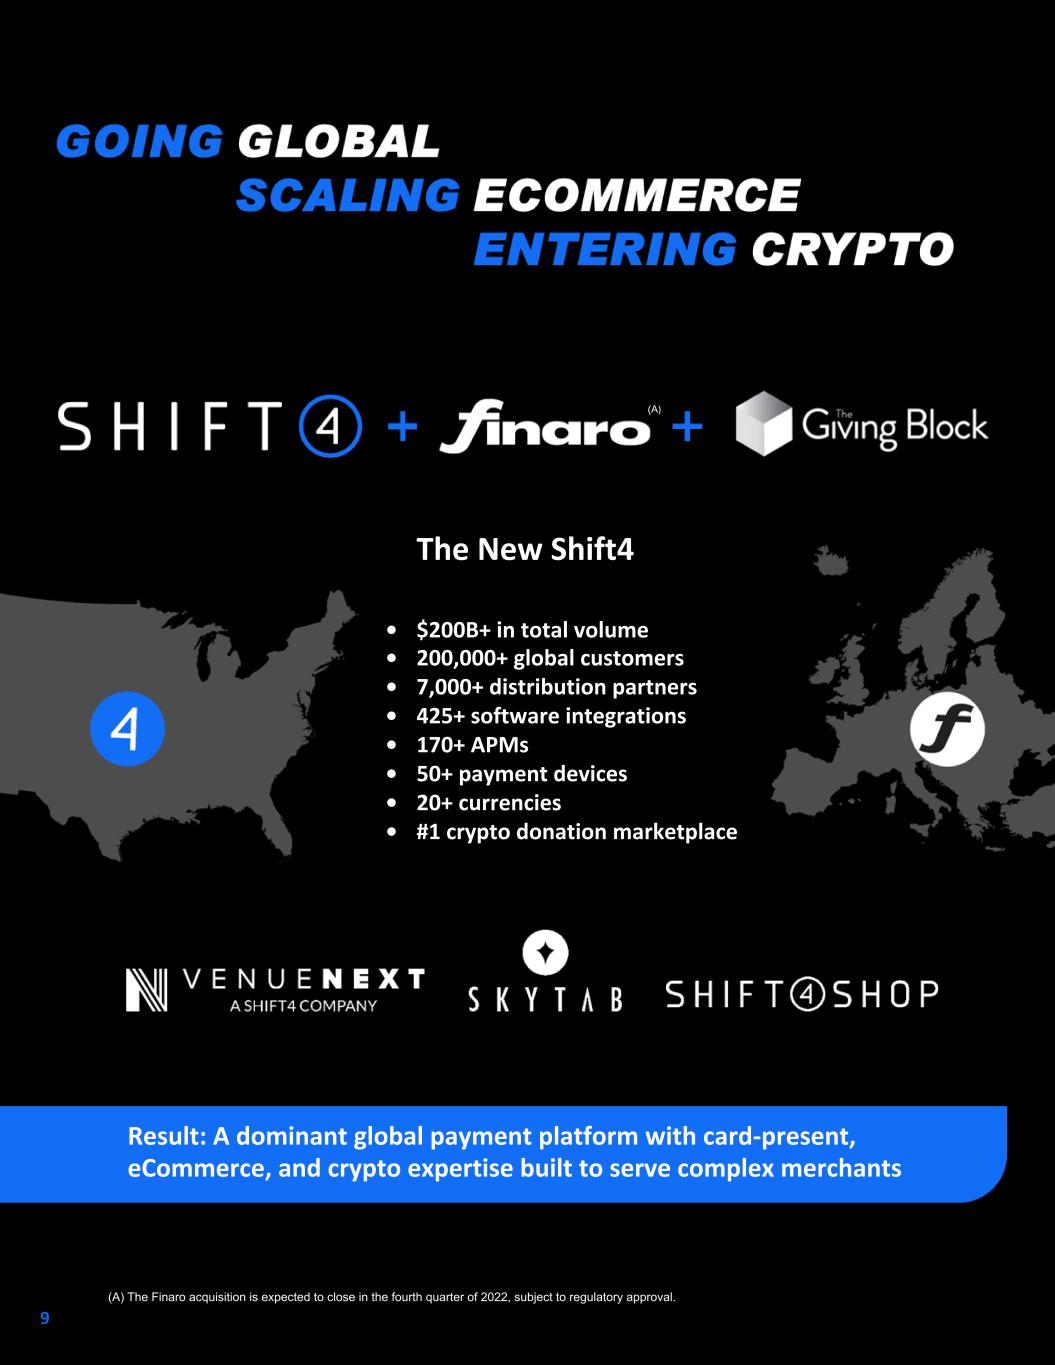
9 The New Shift4 • $200B+ in total volume • 200,000+ global customers • 7,000+ distribution partners • 425+ software integrations • 170+ APMs • 50+ payment devices • 20+ currencies • #1 crypto donation marketplace Result: A dominant global payment platform with card-present, eCommerce, and crypto expertise built to serve complex merchants (A) (A) The Finaro acquisition is expected to close in the fourth quarter of 2022, subject to regulatory approval.
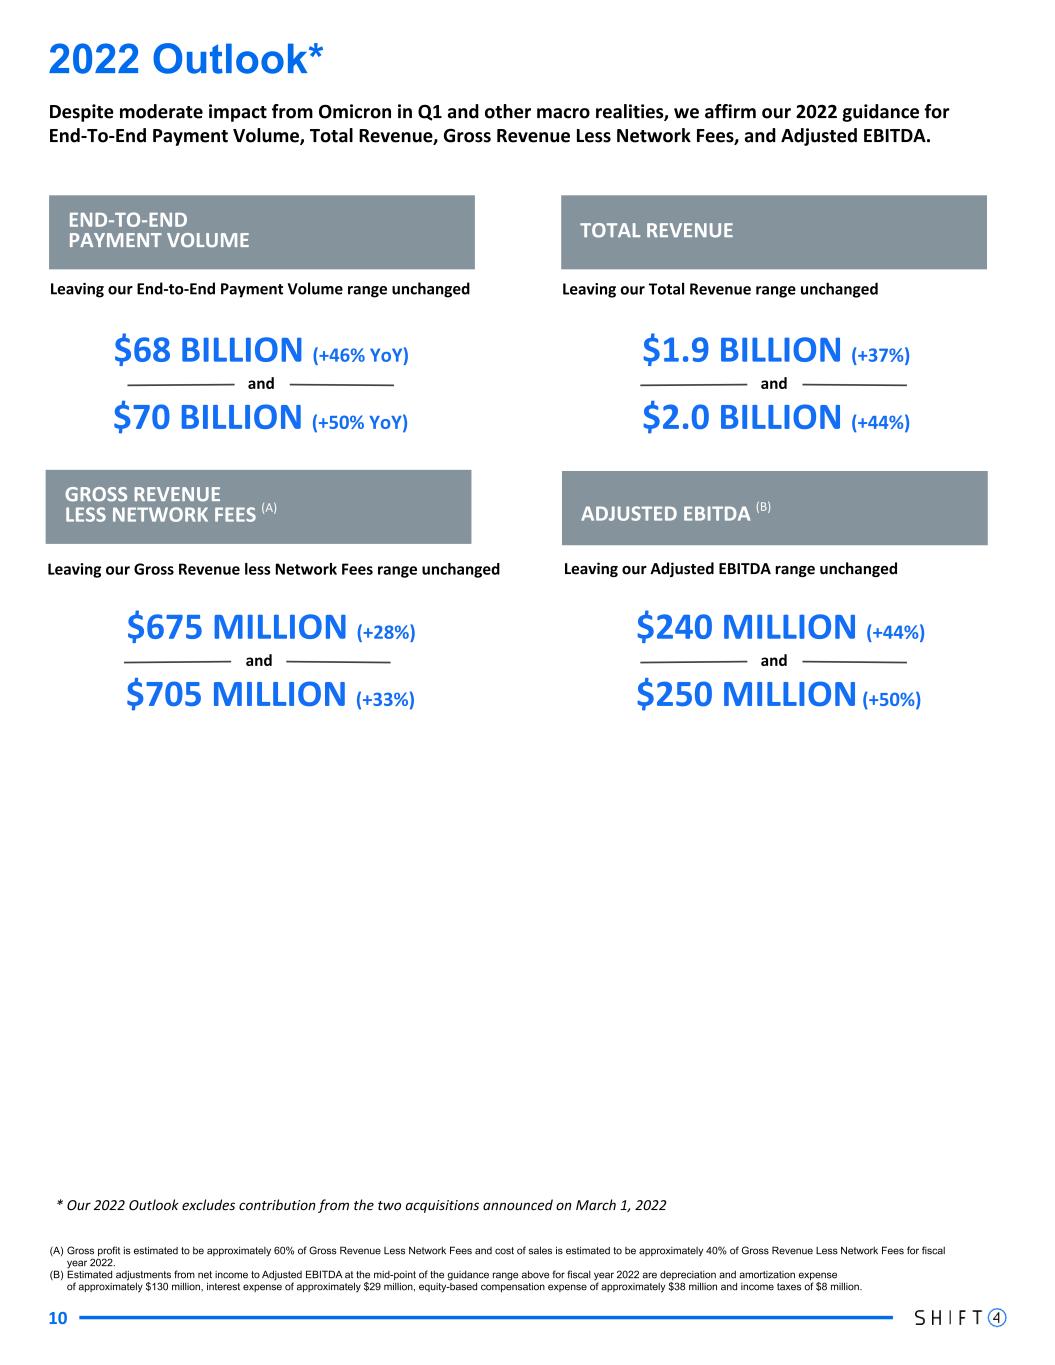
10 END-TO-END PAYMENT VOLUME ADJUSTED EBITDA (B) GROSS REVENUE LESS NETWORK FEES (A) TOTAL REVENUE Leaving our Adjusted EBITDA range unchangedLeaving our Gross Revenue less Network Fees range unchanged $68 BILLION (+46% YoY) $70 BILLION (+50% YoY) $240 MILLION (+44%) $250 MILLION (+50%) $675 MILLION (+28%) $705 MILLION (+33%) $1.9 BILLION (+37%) $2.0 BILLION (+44%) and andand and 2022 Outlook* (A) Gross profit is estimated to be approximately 60% of Gross Revenue Less Network Fees and cost of sales is estimated to be approximately 40% of Gross Revenue Less Network Fees for fiscal year 2022. (B) Estimated adjustments from net income to Adjusted EBITDA at the mid-point of the guidance range above for fiscal year 2022 are depreciation and amortization expense of approximately $130 million, interest expense of approximately $29 million, equity-based compensation expense of approximately $38 million and income taxes of $8 million. * Our 2022 Outlook excludes contribution from the two acquisitions announced on March 1, 2022 Despite moderate impact from Omicron in Q1 and other macro realities, we affirm our 2022 guidance for End-To-End Payment Volume, Total Revenue, Gross Revenue Less Network Fees, and Adjusted EBITDA. Leaving our End-to-End Payment Volume range unchanged Leaving our Total Revenue range unchanged
Appendix - Financial Information 11
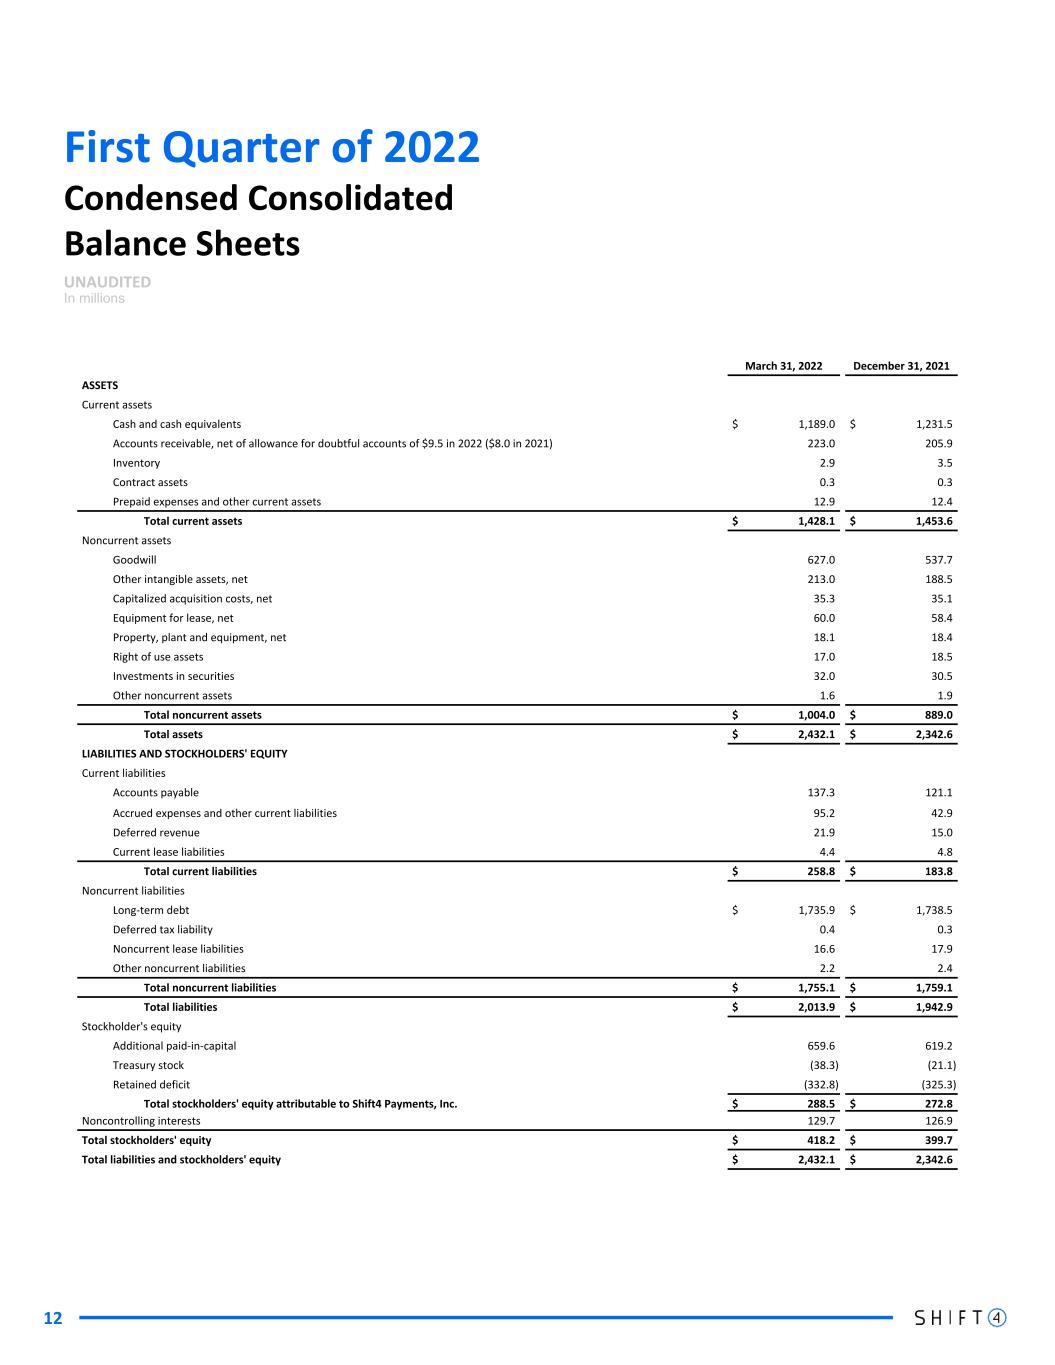
12 First Quarter of 2022 Condensed Consolidated Balance Sheets UNAUDITED In millions March 31, 2022 December 31, 2021 ASSETS Current assets Cash and cash equivalents $ 1,189.0 $ 1,231.5 Accounts receivable, net of allowance for doubtful accounts of $9.5 in 2022 ($8.0 in 2021) 223.0 205.9 Inventory 2.9 3.5 Contract assets 0.3 0.3 Prepaid expenses and other current assets 12.9 12.4 Total current assets $ 1,428.1 $ 1,453.6 Noncurrent assets Goodwill 627.0 537.7 Other intangible assets, net 213.0 188.5 Capitalized acquisition costs, net 35.3 35.1 Equipment for lease, net 60.0 58.4 Property, plant and equipment, net 18.1 18.4 Right of use assets 17.0 18.5 Investments in securities 32.0 30.5 Other noncurrent assets 1.6 1.9 Total noncurrent assets $ 1,004.0 $ 889.0 Total assets $ 2,432.1 $ 2,342.6 LIABILITIES AND STOCKHOLDERS' EQUITY Current liabilities Accounts payable 137.3 121.1 Accrued expenses and other current liabilities 95.2 42.9 Deferred revenue 21.9 15.0 Current lease liabilities 4.4 4.8 Total current liabilities $ 258.8 $ 183.8 Noncurrent liabilities Long-term debt $ 1,735.9 $ 1,738.5 Deferred tax liability 0.4 0.3 Noncurrent lease liabilities 16.6 17.9 Other noncurrent liabilities 2.2 2.4 Total noncurrent liabilities $ 1,755.1 $ 1,759.1 Total liabilities $ 2,013.9 $ 1,942.9 Stockholder's equity Additional paid-in-capital 659.6 619.2 Treasury stock (38.3) (21.1) Retained deficit (332.8) (325.3) Total stockholders' equity attributable to Shift4 Payments, Inc. $ 288.5 $ 272.8 Noncontrolling interests 129.7 126.9 Total stockholders' equity $ 418.2 $ 399.7 Total liabilities and stockholders' equity $ 2,432.1 $ 2,342.6
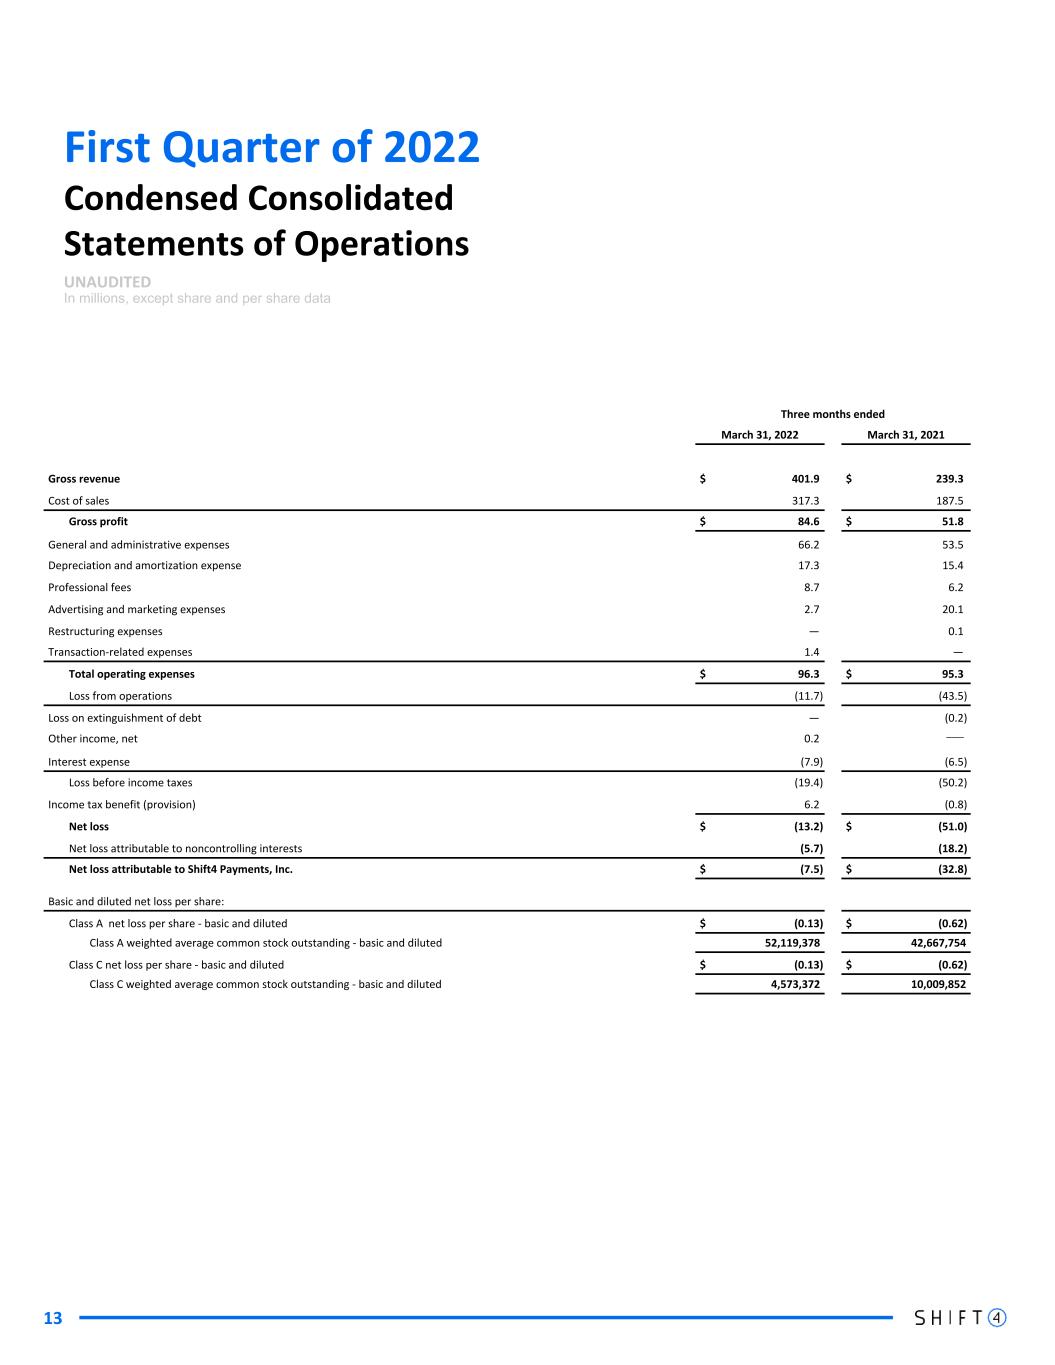
13 First Quarter of 2022 Condensed Consolidated Statements of Operations UNAUDITED In millions, except share and per share data Three months ended March 31, 2022 March 31, 2021 Gross revenue $ 401.9 $ 239.3 Cost of sales 317.3 187.5 Gross profit $ 84.6 $ 51.8 General and administrative expenses 66.2 53.5 Depreciation and amortization expense 17.3 15.4 Professional fees 8.7 6.2 Advertising and marketing expenses 2.7 20.1 Restructuring expenses — 0.1 Transaction-related expenses 1.4 — Total operating expenses $ 96.3 $ 95.3 Loss from operations (11.7) (43.5) Loss on extinguishment of debt — (0.2) Other income, net 0.2 — Interest expense (7.9) (6.5) Loss before income taxes (19.4) (50.2) Income tax benefit (provision) 6.2 (0.8) Net loss $ (13.2) $ (51.0) Net loss attributable to noncontrolling interests (5.7) (18.2) Net loss attributable to Shift4 Payments, Inc. $ (7.5) $ (32.8) Basic and diluted net loss per share: Class A net loss per share - basic and diluted $ (0.13) $ (0.62) Class A weighted average common stock outstanding - basic and diluted 52,119,378 42,667,754 Class C net loss per share - basic and diluted $ (0.13) $ (0.62) Class C weighted average common stock outstanding - basic and diluted 4,573,372 10,009,852
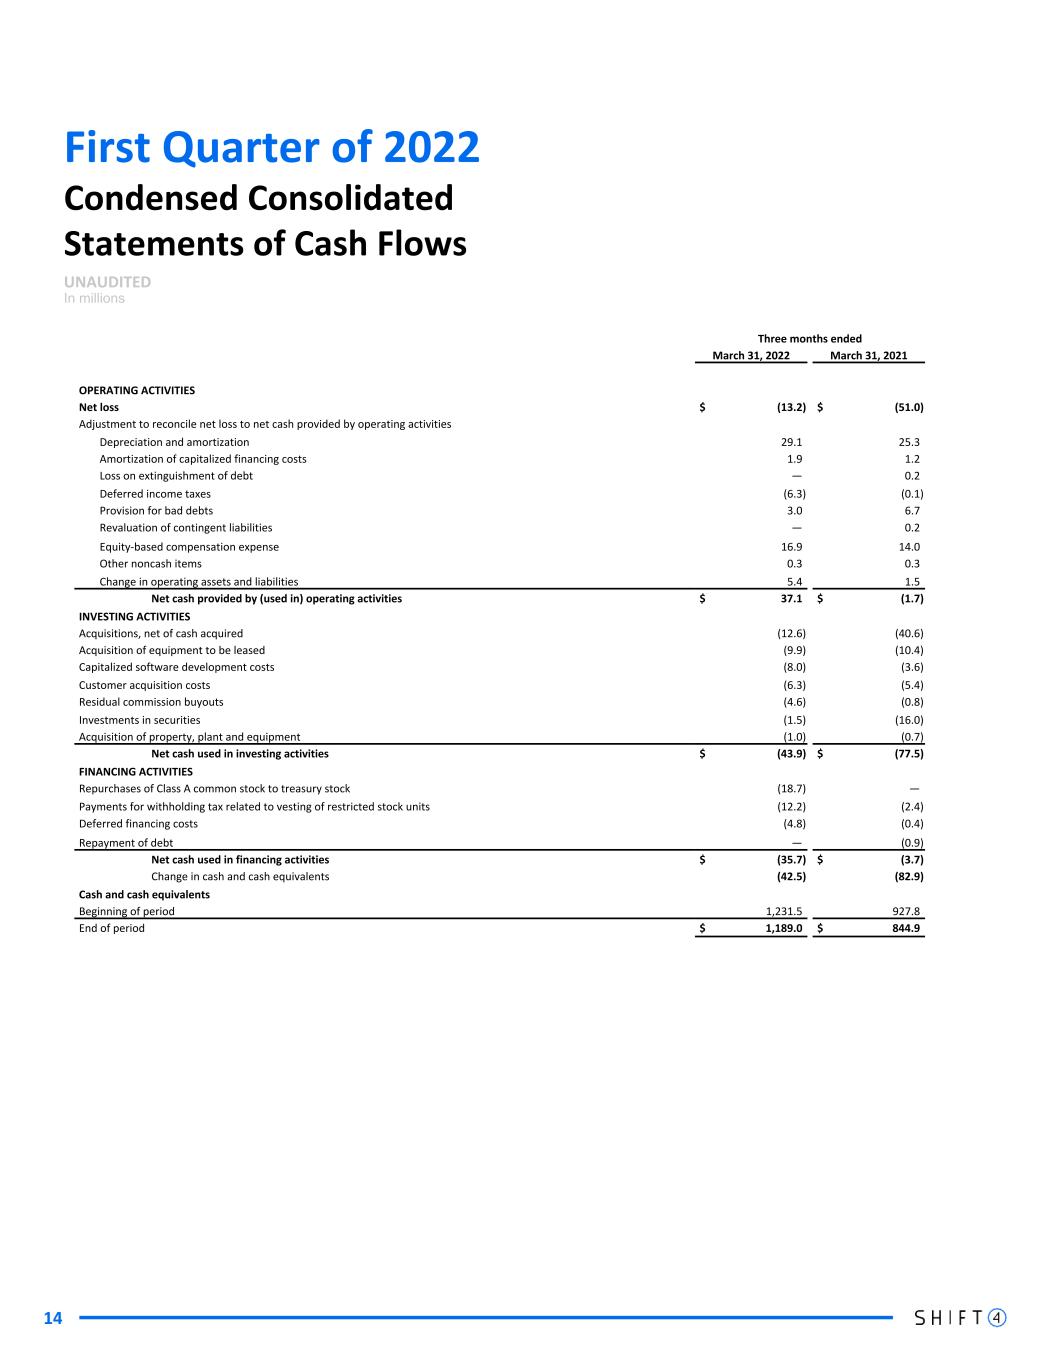
First Quarter of 2022 14 Condensed Consolidated Statements of Cash Flows UNAUDITED In millions Three months ended March 31, 2022 March 31, 2021 OPERATING ACTIVITIES Net loss $ (13.2) $ (51.0) Adjustment to reconcile net loss to net cash provided by operating activities Depreciation and amortization 29.1 25.3 Amortization of capitalized financing costs 1.9 1.2 Loss on extinguishment of debt — 0.2 Deferred income taxes (6.3) (0.1) Provision for bad debts 3.0 6.7 Revaluation of contingent liabilities — 0.2 Equity-based compensation expense 16.9 14.0 Other noncash items 0.3 0.3 Change in operating assets and liabilities 5.4 1.5 Net cash provided by (used in) operating activities $ 37.1 $ (1.7) INVESTING ACTIVITIES Acquisitions, net of cash acquired (12.6) (40.6) Acquisition of equipment to be leased (9.9) (10.4) Capitalized software development costs (8.0) (3.6) Customer acquisition costs (6.3) (5.4) Residual commission buyouts (4.6) (0.8) Investments in securities (1.5) (16.0) Acquisition of property, plant and equipment (1.0) (0.7) Net cash used in investing activities $ (43.9) $ (77.5) FINANCING ACTIVITIES Repurchases of Class A common stock to treasury stock (18.7) — Payments for withholding tax related to vesting of restricted stock units (12.2) (2.4) Deferred financing costs (4.8) (0.4) Repayment of debt — (0.9) Net cash used in financing activities $ (35.7) $ (3.7) Change in cash and cash equivalents (42.5) (82.9) Cash and cash equivalents Beginning of period 1,231.5 927.8 End of period $ 1,189.0 $ 844.9
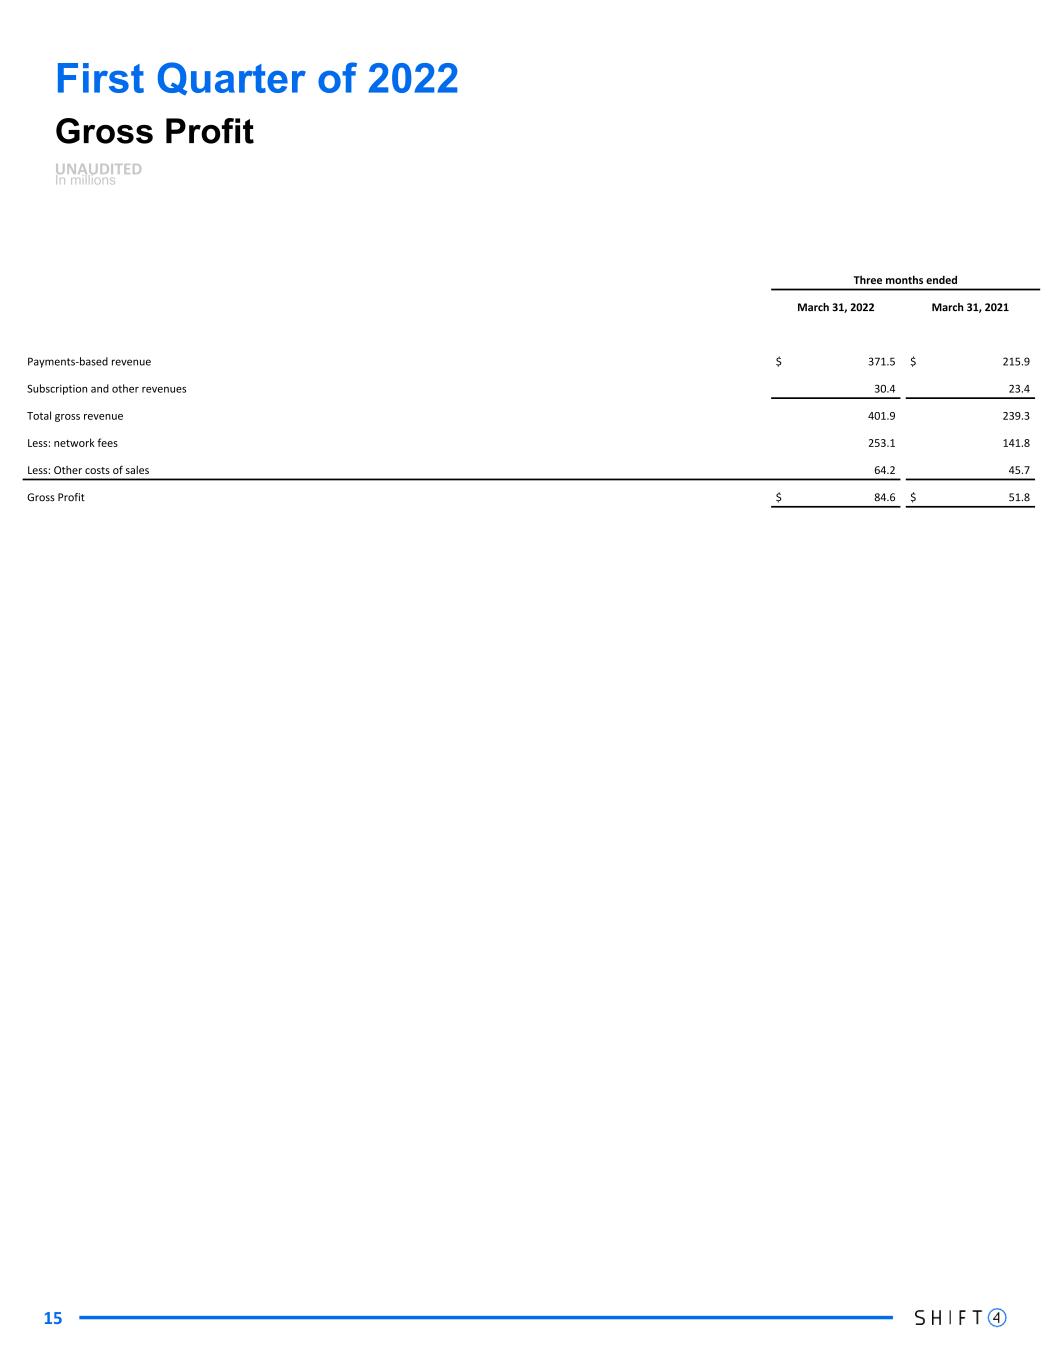
First Quarter of 2022 Gross Profit UNAUDITED In millions Three months ended March 31, 2022 March 31, 2021 Payments-based revenue $ 371.5 $ 215.9 Subscription and other revenues 30.4 23.4 Total gross revenue 401.9 239.3 Less: network fees 253.1 141.8 Less: Other costs of sales 64.2 45.7 Gross Profit $ 84.6 $ 51.8 15
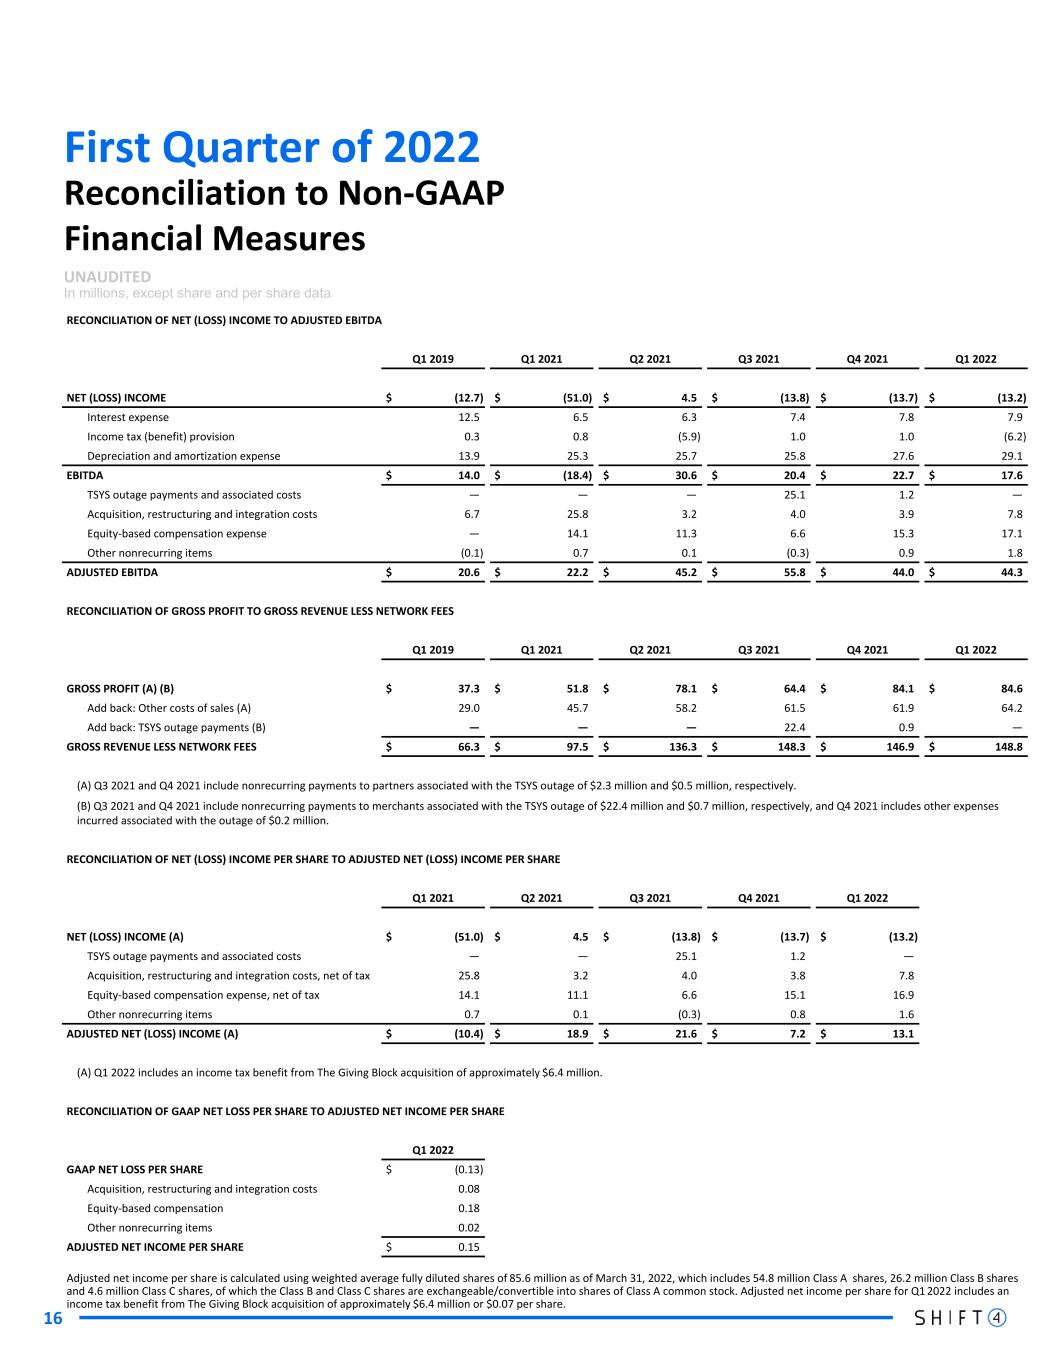
First Quarter of 2022 16 Reconciliation to Non-GAAP Financial Measures UNAUDITED In millions, except share and per share data RECONCILIATION OF NET (LOSS) INCOME TO ADJUSTED EBITDA Q1 2019 Q1 2021 Q2 2021 Q3 2021 Q4 2021 Q1 2022 NET (LOSS) INCOME $ (12.7) $ (51.0) $ 4.5 $ (13.8) $ (13.7) $ (13.2) Interest expense 12.5 6.5 6.3 7.4 7.8 7.9 Income tax (benefit) provision 0.3 0.8 (5.9) 1.0 1.0 (6.2) Depreciation and amortization expense 13.9 25.3 25.7 25.8 27.6 29.1 EBITDA $ 14.0 $ (18.4) $ 30.6 $ 20.4 $ 22.7 $ 17.6 TSYS outage payments and associated costs — — — 25.1 1.2 — Acquisition, restructuring and integration costs 6.7 25.8 3.2 4.0 3.9 7.8 Equity-based compensation expense — 14.1 11.3 6.6 15.3 17.1 Other nonrecurring items (0.1) 0.7 0.1 (0.3) 0.9 1.8 ADJUSTED EBITDA $ 20.6 $ 22.2 $ 45.2 $ 55.8 $ 44.0 $ 44.3 RECONCILIATION OF GROSS PROFIT TO GROSS REVENUE LESS NETWORK FEES Q1 2019 Q1 2021 Q2 2021 Q3 2021 Q4 2021 Q1 2022 GROSS PROFIT (A) (B) $ 37.3 $ 51.8 $ 78.1 $ 64.4 $ 84.1 $ 84.6 Add back: Other costs of sales (A) 29.0 45.7 58.2 61.5 61.9 64.2 Add back: TSYS outage payments (B) — — — 22.4 0.9 — GROSS REVENUE LESS NETWORK FEES $ 66.3 $ 97.5 $ 136.3 $ 148.3 $ 146.9 $ 148.8 (A) Q3 2021 and Q4 2021 include nonrecurring payments to partners associated with the TSYS outage of $2.3 million and $0.5 million, respectively. (B) Q3 2021 and Q4 2021 include nonrecurring payments to merchants associated with the TSYS outage of $22.4 million and $0.7 million, respectively, and Q4 2021 includes other expenses incurred associated with the outage of $0.2 million. RECONCILIATION OF NET (LOSS) INCOME PER SHARE TO ADJUSTED NET (LOSS) INCOME PER SHARE Q1 2021 Q2 2021 Q3 2021 Q4 2021 Q1 2022 NET (LOSS) INCOME (A) $ (51.0) $ 4.5 $ (13.8) $ (13.7) $ (13.2) TSYS outage payments and associated costs — — 25.1 1.2 — Acquisition, restructuring and integration costs, net of tax 25.8 3.2 4.0 3.8 7.8 Equity-based compensation expense, net of tax 14.1 11.1 6.6 15.1 16.9 Other nonrecurring items 0.7 0.1 (0.3) 0.8 1.6 ADJUSTED NET (LOSS) INCOME (A) $ (10.4) $ 18.9 $ 21.6 $ 7.2 $ 13.1 (A) Q1 2022 includes an income tax benefit from The Giving Block acquisition of approximately $6.4 million. RECONCILIATION OF GAAP NET LOSS PER SHARE TO ADJUSTED NET INCOME PER SHARE Q1 2022 GAAP NET LOSS PER SHARE $ (0.13) Acquisition, restructuring and integration costs 0.08 Equity-based compensation 0.18 Other nonrecurring items 0.02 ADJUSTED NET INCOME PER SHARE $ 0.15 Adjusted net income per share is calculated using weighted average fully diluted shares of 85.6 million as of March 31, 2022, which includes 54.8 million Class A shares, 26.2 million Class B shares and 4.6 million Class C shares, of which the Class B and Class C shares are exchangeable/convertible into shares of Class A common stock. Adjusted net income per share for Q1 2022 includes an income tax benefit from The Giving Block acquisition of approximately $6.4 million or $0.07 per share.
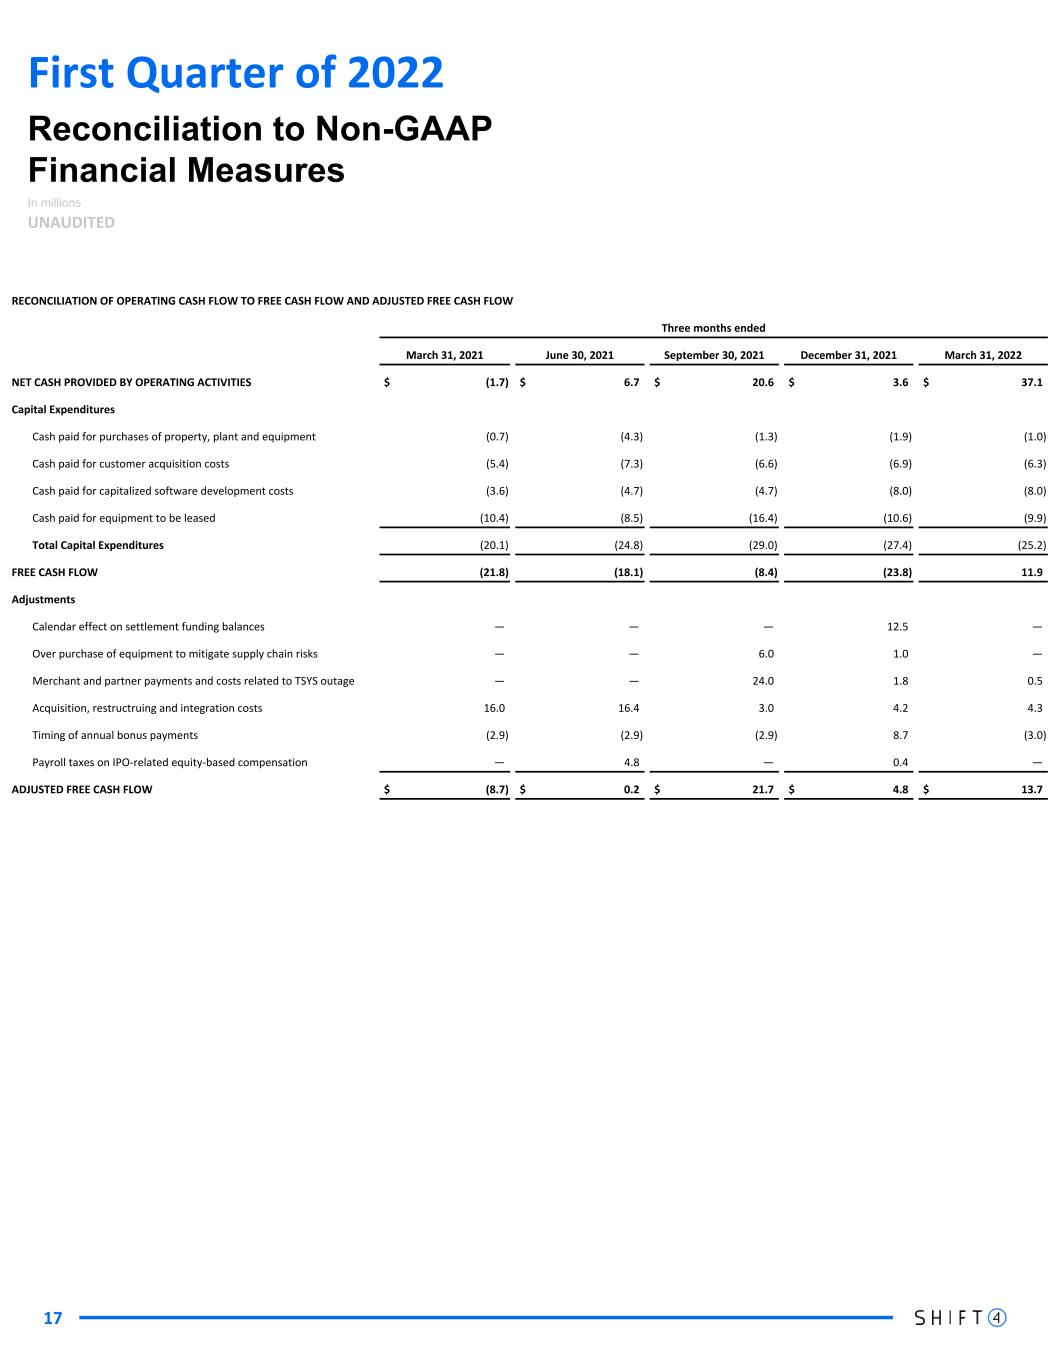
RECONCILIATION OF OPERATING CASH FLOW TO FREE CASH FLOW AND ADJUSTED FREE CASH FLOW Three months ended March 31, 2021 June 30, 2021 September 30, 2021 December 31, 2021 March 31, 2022 NET CASH PROVIDED BY OPERATING ACTIVITIES $ (1.7) $ 6.7 $ 20.6 $ 3.6 $ 37.1 Capital Expenditures Cash paid for purchases of property, plant and equipment (0.7) (4.3) (1.3) (1.9) (1.0) Cash paid for customer acquisition costs (5.4) (7.3) (6.6) (6.9) (6.3) Cash paid for capitalized software development costs (3.6) (4.7) (4.7) (8.0) (8.0) Cash paid for equipment to be leased (10.4) (8.5) (16.4) (10.6) (9.9) Total Capital Expenditures (20.1) (24.8) (29.0) (27.4) (25.2) FREE CASH FLOW (21.8) (18.1) (8.4) (23.8) 11.9 Adjustments Calendar effect on settlement funding balances — — — 12.5 — Over purchase of equipment to mitigate supply chain risks — — 6.0 1.0 — Merchant and partner payments and costs related to TSYS outage — — 24.0 1.8 0.5 Acquisition, restructruing and integration costs 16.0 16.4 3.0 4.2 4.3 Timing of annual bonus payments (2.9) (2.9) (2.9) 8.7 (3.0) Payroll taxes on IPO-related equity-based compensation — 4.8 — 0.4 — ADJUSTED FREE CASH FLOW $ (8.7) $ 0.2 $ 21.7 $ 4.8 $ 13.7 Reconciliation to Non-GAAP Financial Measures In millions UNAUDITED 17 First Quarter of 2022
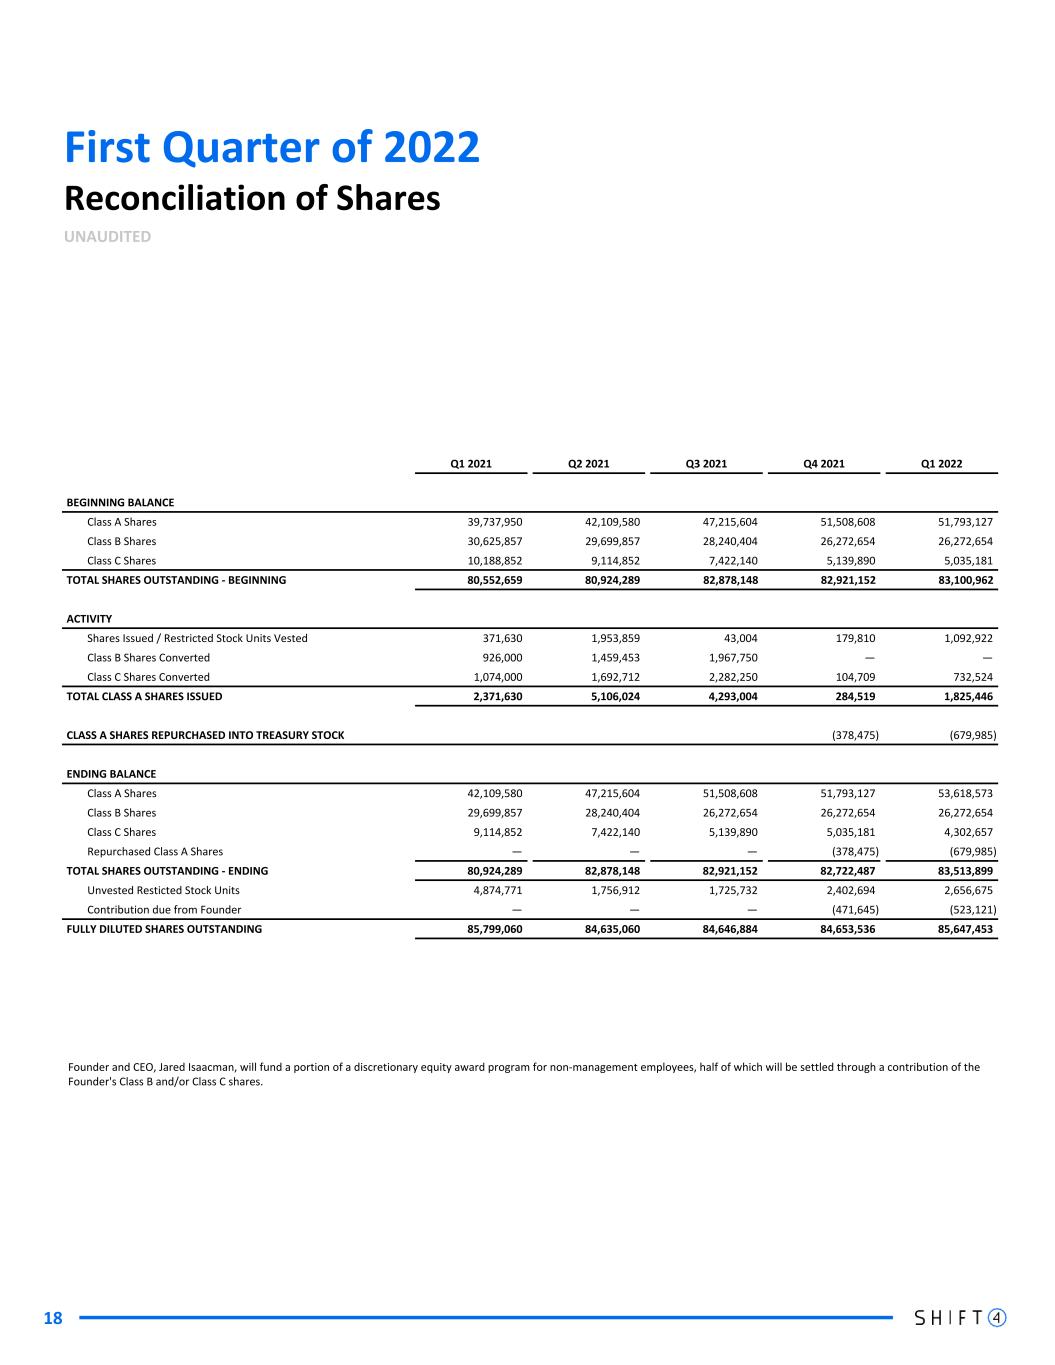
First Quarter of 2022 18 Reconciliation of Shares UNAUDITED Q1 2021 Q2 2021 Q3 2021 Q4 2021 Q1 2022 BEGINNING BALANCE Class A Shares 39,737,950 42,109,580 47,215,604 51,508,608 51,793,127 Class B Shares 30,625,857 29,699,857 28,240,404 26,272,654 26,272,654 Class C Shares 10,188,852 9,114,852 7,422,140 5,139,890 5,035,181 TOTAL SHARES OUTSTANDING - BEGINNING 80,552,659 80,924,289 82,878,148 82,921,152 83,100,962 ACTIVITY Shares Issued / Restricted Stock Units Vested 371,630 1,953,859 43,004 179,810 1,092,922 Class B Shares Converted 926,000 1,459,453 1,967,750 — — Class C Shares Converted 1,074,000 1,692,712 2,282,250 104,709 732,524 TOTAL CLASS A SHARES ISSUED 2,371,630 5,106,024 4,293,004 284,519 1,825,446 CLASS A SHARES REPURCHASED INTO TREASURY STOCK (378,475) (679,985) ENDING BALANCE Class A Shares 42,109,580 47,215,604 51,508,608 51,793,127 53,618,573 Class B Shares 29,699,857 28,240,404 26,272,654 26,272,654 26,272,654 Class C Shares 9,114,852 7,422,140 5,139,890 5,035,181 4,302,657 Repurchased Class A Shares — — — (378,475) (679,985) TOTAL SHARES OUTSTANDING - ENDING 80,924,289 82,878,148 82,921,152 82,722,487 83,513,899 Unvested Resticted Stock Units 4,874,771 1,756,912 1,725,732 2,402,694 2,656,675 Contribution due from Founder — — — (471,645) (523,121) FULLY DILUTED SHARES OUTSTANDING 85,799,060 84,635,060 84,646,884 84,653,536 85,647,453 Founder and CEO, Jared Isaacman, will fund a portion of a discretionary equity award program for non-management employees, half of which will be settled through a contribution of the Founder's Class B and/or Class C shares.