Q3 2022 Results SkyTab Showcase & Business Update November 7, 2022
Safe Harbor Statement and Forward Looking Information Non-GAAP Financial Measures and Key Performance Indicators This presentation contains forward-looking statements within the meaning of the Private Securities Litigation Reform Act of 1995. We intend- such forward-looking statements to be covered by the safe harbor provisions for forward-looking statements contained in Section 27A of the Securities Act of 1933, as amended and Section 21E of the Securities Exchange Act of 1934, as amended. All statements contained in this presentation that do not relate to matters of historical fact should be considered forward-looking statements, including statements regarding Shift4 Payments, Inc.’s (“our”, the “Company” or "Shift4”) expectations regarding new customers; acquisitions and other transactions, including of our sales partners and their residual streams, and our ability to close said transactions on the timeline we expect or at all; our plans and agreements regarding future payment processing commitments; our expectations with respect to economic recovery; our stock price; and anticipated financial performance, including our financial outlook for fiscal year 2022 and future periods. These statements are neither promises nor guarantees, but involve known and unknown risks, uncertainties and other important factors that may cause our actual results, performance or achievements to be materially different from any future results, performance or achievements expressed or implied by the forward-looking statements, including, but not limited to, the following: the effect of the COVID-19 global pandemic and any variants of the virus on our business and results of operations; our ability to differentiate ourselves from our competitors and compete effectively; our ability to anticipate and respond to changing industry trends and merchant and consumer needs; our ability to continue making acquisitions of businesses or assets; our ability to continue to expand our market share or expand into new markets; our reliance on third-party vendors to provide products and services; our ability to integrate our services and products with operating systems, devices, software and web browsers; our ability to maintain merchant and software partner relationships and strategic partnerships; the effects of global economic, political and other conditions, including inflationary pressure and rising interest rates, on consumer, business and government spending; our compliance with governmental regulation and other legal obligations, particularly related to privacy, data protection and information security, and consumer protection laws; our ability to establish, maintain and enforce effective risk management policies and procedures; our ability to protect our systems and data from continually evolving cybersecurity risks, security breaches and other technological risks; potential harm caused by software defects, computer viruses and development delays; the effect of degradation of the quality of the products and services we offer; potential harm caused by increased customer attrition; potential harm caused by fraud by merchants or others; potential harm caused by damage to our reputation or brands; our ability to recruit, retain and develop qualified personnel; our reliance on a single or limited number of suppliers; the effects of seasonality and volatility on our operating results; the effect of various legal proceedings; our ability to raise additional capital to fund our operations; our ability to protect, enforce and defend our intellectual property rights; our ability to establish and maintain effective internal control over financial reporting and disclosure controls and procedures; our compliance with laws, regulations and enforcement activities that affect our industry; our dependence on distributions from Shift4 Payments, LLC to pay our taxes and expenses, including payments under the Tax Receivable Agreement; the significant influence Rook has over us, including control over decisions that require the approval of stockholders; and the potential impact of material weaknesses in our internal control over financial reporting. These and other important factors are described in “Cautionary Note Regarding Forward-Looking Statements” and “Risk Factors” in Part I, Item 1A. in our Annual Report on Form 10-K/A for the year ended December 31, 2021 and could cause actual results to differ materially from those indicated by the forward-looking statements made in this presentation.. Any such forward-looking statements represent management’s estimates as of the date of this presentation. While we may elect to update such forward-looking statements at some point in the future, we disclaim any obligation to do so, even if subsequent events cause our views to change. We use supplemental measures of our performance which are derived from our consolidated financial information but which are not presented in our consolidated financial statements prepared in accordance with generally accepted accounting principles ("GAAP"). These non-GAAP financial measures include: gross revenue less network fees, which includes interchange and assessment fees; adjusted net income; adjusted net income per share; free cash flow; adjusted free cash flow; earnings before interest, income taxes, depreciation, and amortization (“EBITDA”); Adjusted EBITDA; Adjusted EBITDA conversion rate; and Adjusted EBITDA margin. Gross revenue less network fees represents a key performance metric that management uses to measure changes in the mix and value derived from our customer base as we continue to execute our strategy to expand our reach to serve larger, complex merchants. For the three and nine months ended September 30, 2021, gross revenue less network fees excludes the impact of the payments to merchants, included in "Gross revenue," and payments to partners and associated expenses due to the TSYS outage, included "Other costs of sales" in our Consolidated Statements of Operations for the same periods. These are nonrecurring payments that occurred outside of our day-to-day operations, and we have excluded them in order to provide more useful information to investors in the evaluation of our performance period-over period. Adjusted net income represents net income (loss) adjusted for certain non-cash and other nonrecurring items that management believes are not indicative of ongoing operations, such as the TSYS outage payments and associated costs, acquisition, restructuring and integration costs, revaluation of contingent liabilities, change in Tax Receivable Agreement (“TRA”) liability, equity-based compensation expense, and other nonrecurring items. Adjusted EBITDA is the primary financial performance measure used by management to evaluate its business and monitor results of operations. Adjusted EBITDA represents EBITDA further adjusted for certain non-cash and other nonrecurring items that management believes are not indicative of ongoing operations. These adjustments include the TSYS outage payments and associated costs, acquisition, restructuring and integration costs, revaluation of contingent liabilities, change in TRA liability, equity-based compensation expense and other nonrecurring items. Free cash flow represents net cash provided by operating activities adjusted for non-discretionary capital expenditures. Adjusted free cash flow represents free cash flow further adjusted for certain transactions that are not indicative of future operating cash flows, including settlement activity, which represents the change in our settlement obligation, which fluctuated based on volumes and calendar timing, payments and costs associated with the TSYS outage, acquisition, restructuring and integration costs, the impact of timing of annual performance bonuses, and other nonrecurring expenses that are not indicative of ongoing activities. We believe adjusted free cash flow is useful to measure the funds generated in a given period that are available to invest in the business, to repurchase stock and to make strategic decisions. We believe this supplemental information enhances shareholders’ ability to evaluate the Company’s performance. The Adjusted EBITDA conversion rate is calculated as Adjusted Free Cash Flow divided by Adjusted EBITDA. We use non-GAAP financial measures to supplement financial information presented on a GAAP basis. We believe that excluding certain items from our GAAP results allows management to better understand our consolidated financial performance from period to period and better project our future consolidated financial performance as forecasts are developed at a level of detail different from that used to prepare GAAP-based financial measures. Moreover, we believe these non-GAAP financial measures provide our stakeholders with useful information to help them evaluate our operating results by facilitating an enhanced understanding of our operating performance and enabling them to make more meaningful period to period comparisons. There are limitations to the use of the non-GAAP financial measures presented in this presentation. Our non-GAAP financial measures may not be comparable to similarly titled measures of other companies. Other companies, including companies in our industry, may calculate non-GAAP financial measures differently than we do, limiting the usefulness of those measures for comparative purposes. The non-GAAP financial measures are not meant to be considered as indicators of performance in isolation from or as a substitute for net income (loss) prepared in accordance with GAAP, and should be read only in conjunction with financial information presented on a GAAP basis. Reconciliations of EBITDA and Adjusted EBITDA, gross revenue less network fees, adjusted net income, adjusted net income per share, free cash flow and adjusted free cash flow to its most directly comparable GAAP financial measure are presented at the end of this presentation. We encourage you to review the reconciliations in conjunction with the presentation of the non-GAAP financial measures for each of the periods presented. In future fiscal periods, we may exclude such items and may incur income and expenses similar to these excluded items. In addition, key performance indicators include end-to-end payment volume, spread and margin. End- to-end payment volume is defined as the total dollar amount of payments that we deliver for settlement on behalf of our merchants. Included in end-to-end volume are dollars routed via our international payments platform and alternative payment methods, including cryptocurrency donations, plus volume we route to one or more third party merchant acquirers on behalf of strategic enterprise merchant relationships, translated at the spot price to U.S. dollars. This volume does not include volume processed through our legacy gateway-only offering. Spread represents the average yield Shift4 earns on the average end-to-end payment volume processed for a given period after network fees. Spread is calculated as payments-based revenue less gateway revenue and network fees for a given period divided by the end-to-end payment volume processed for the similar period. Adjusted EBITDA Margin represents Adjusted EBITDA divided by gross revenue less network fees. 2
Dear Shareholders, Throughout our 25 years in business, we have navigated through “dot-com”, the great recession, and a once-in-a-century pandemic. We understand how to innovate and grow during the best and most challenging of economic and geopolitical circumstances. I mentioned earlier this year that as uncertain as the road ahead may be, this is typically when Shift4 performs at our best. We know how to prioritize and focus our resources towards initiatives that ‘move the needle’ and I believe the results from this quarter reflect well on that statement. We completed another reasonably strong quarter, setting new quarterly records for volume, Gross Profit, Gross Revenue less Network Fees, Net Income, Adjusted EBITDA, and Adjusted Free Cash Flow. We grew our end-to-end volume, gross profit, and gross revenue less network fees 53%, 118%, and 33%, respectively. We generated $46.4 million of net income, up from a net loss of ($13.8) million a year ago, and grew our Adjusted EBITDA 53% for the quarter while expanding our Adjusted EBITDA margins considerably. I am especially proud of this performance as it underscores our ability to make investments in our growth initiatives, such as international expansion and launching new products like SkyTab – while also executing in our core business in the face of what could be a deteriorating economy. With a large base of existing customers and a distinct right-to-win in several verticals, we have positioned the company to differentiate, take share and grow even if there is an eventual slowdown in consumer spending. During the third quarter, our end-to-end volume was $20.6 billion, up 53% year over year, and up 349% from 2019 levels. In addition to consistent net new wins, this quarter benefited from a greater contribution of volume from our new verticals, including Sports & Entertainment, Gaming and Sexy Tech. Additionally, we were able to renew several enterprise gateway customers under more favorable economic terms consistent with our previously announced ‘gateway sunset strategy’. We also signed, closed and integrated our first international acquisition which we believe substantially enhances our ability to attract and integrate new customers in line with our global expansion strategy. While the economic contribution was de minimis to the quarter, the feature enhancements are quite impressive and I encourage you all to visit dev.shift4.com to try them out. Our previously signed acquisition of Finaro is on track to close by Q1 2023 pending regulatory approval. Throughout the quarter we have been quite busy: • High growth core: In addition to signing many notable hotels and restaurants, we fully released our next generation restaurant product SkyTab POS. As a component of this initiative, we insourced several of our best distribution partners located in key markets. As a result, we are now able to go to market with equal strength in both ‘direct sales’ and through third-party dealers. The result is greater control over the customer experience and significantly reduced expenses driving superior unit economics. Overall, we anticipate a steady increase in new customer production. 3
• Gateway conversions: The previously announced gateway sunset program continues to deliver favorable results. While we remain early in this multi-year initiative, we have already pulled forward volume that we otherwise may not have achieved, as well as renewed agreements with several enterprise customers on economic terms equivalent to our E2E offering. This initiative is still in the early innings with a considerable pool of gateway volume that will drive growth for years into the future. • New verticals: As mentioned above, all of our new verticals have continued to ramp throughout the quarter. This includes record volume contribution from our Sports & Entertainment and Gaming solutions as well as our strategic customer relationships. • M&A: The quarter was spent preparing for the closing of the previously announced Finaro acquisition, as well as signing and closing on the acquisition of a European PSP that brings advanced anti-fraud, BI and recurring billing functionality. Our pipeline of opportunities remains robust as we continue to execute on our global expansion priorities alongside other accelerants to our growth and product strategy. • Talent: We’ve leveraged our advantages above to add great talent at a time when many in our industry are downsizing. Notably, we welcomed Nancy Disman as CFO and created a new Transformation division. I fully expect us to continue to responsibly add talent to meet the demand for our services. I attribute our performance this quarter to well-executed organic initiatives, like SkyTab POS and our gateway sunset program, as well as disciplined investments in new verticals that moderate the typical seasonality that would have been expected in our high growth core. We continue to deliver on the expectations established during our 2021 Investor Day and as a result we are raising 2022 volume, Gross Revenue less Network Fees, Adjusted EBITDA, Adjusted FCF outlook and reaffirming our mid-term outlook. We will expand upon this letter during our earnings call and our 2022 SkyTab Showcase and Business Update event. Like last quarter, I would like to thank the Shift4 team for working tirelessly to deliver such impressive results. We are growing very quickly, and change is never easy. The team has leaned in to the ‘Shift4 Way’ established last year and the results are quite apparent. We will never stop looking to improve as we embrace the challenge and endeavor to illuminate the world through connected commerce. On that note, I always welcome ideas, business opportunities, areas of improvement and general feedback from our investors. Please don’t hesitate to contact me directly. Jared Isaacman jared@shift4.com 4
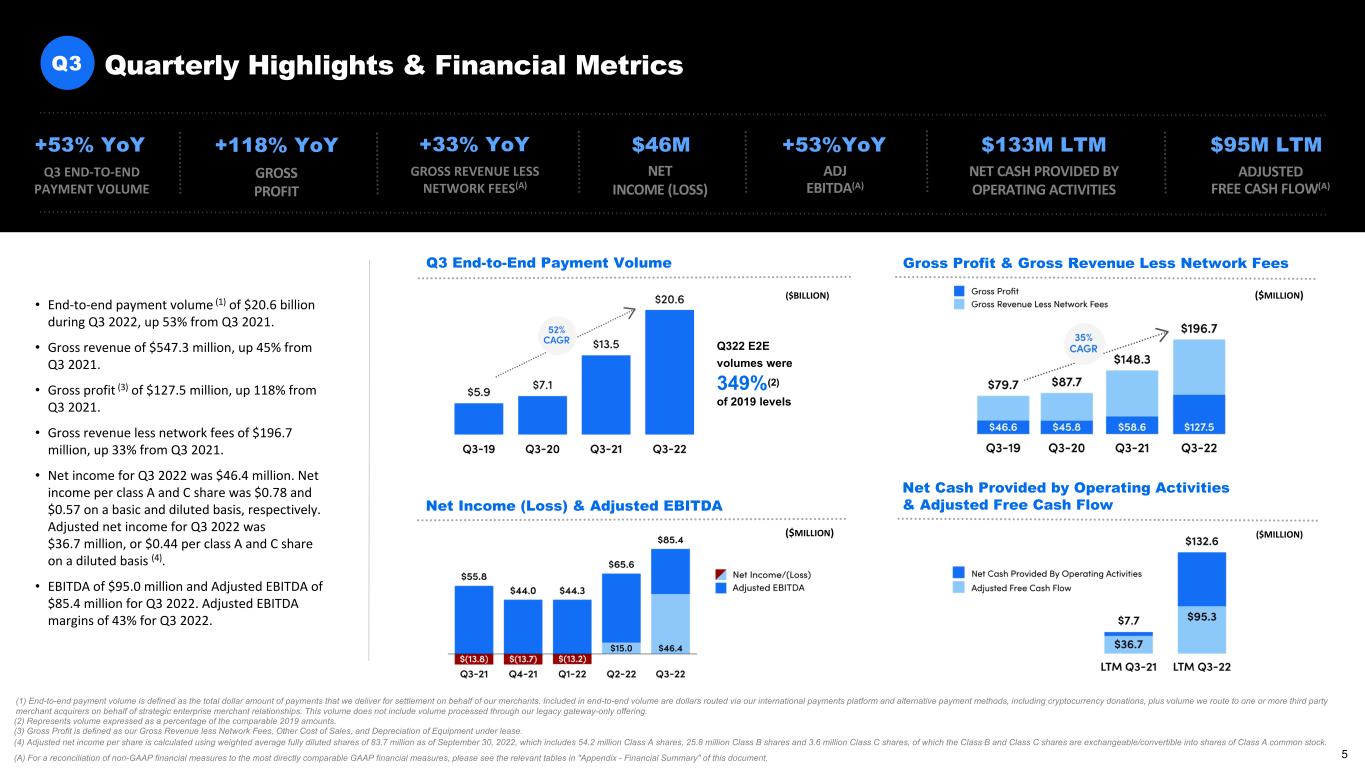
Quarterly Highlights & Financial MetricsQ3 Net Cash Provided by Operating Activities & Adjusted Free Cash Flow ($MILLION) Q3 End-to-End Payment Volume Gross Profit & Gross Revenue Less Network Fees ($MILLION) Net Income (Loss) & Adjusted EBITDA ($BILLION) +53% YoY Q3 END-TO-END PAYMENT VOLUME +118% YoY GROSS PROFIT +33% YoY GROSS REVENUE LESS NETWORK FEES(A) +53%YoY ADJ EBITDA(A) NET CASH PROVIDED BY OPERATING ACTIVITIES $95M LTM ADJUSTED FREE CASH FLOW(A) $133M LTM (1) End-to-end payment volume is defined as the total dollar amount of payments that we deliver for settlement on behalf of our merchants. Included in end-to-end volume are dollars routed via our international payments platform and alternative payment methods, including cryptocurrency donations, plus volume we route to one or more third party merchant acquirers on behalf of strategic enterprise merchant relationships. This volume does not include volume processed through our legacy gateway-only offering. (2) Represents volume expressed as a percentage of the comparable 2019 amounts. (3) Gross Profit is defined as our Gross Revenue less Network Fees, Other Cost of Sales, and Depreciation of Equipment under lease. (4) Adjusted net income per share is calculated using weighted average fully diluted shares of 83.7 million as of September 30, 2022, which includes 54.2 million Class A shares, 25.8 million Class B shares and 3.6 million Class C shares, of which the Class B and Class C shares are exchangeable/convertible into shares of Class A common stock. (A) For a reconciliation of non-GAAP financial measures to the most directly comparable GAAP financial measures, please see the relevant tables in "Appendix - Financial Summary" of this document. ($MILLION) $46M NET INCOME (LOSS) Q322 E2E volumes were 349%(2) of 2019 levels • End-to-end payment volume (1) of $20.6 billion during Q3 2022, up 53% from Q3 2021. • Gross revenue of $547.3 million, up 45% from Q3 2021. • Gross profit (3) of $127.5 million, up 118% from Q3 2021. • Gross revenue less network fees of $196.7 million, up 33% from Q3 2021. • Net income for Q3 2022 was $46.4 million. Net income per class A and C share was $0.78 and $0.57 on a basic and diluted basis, respectively. Adjusted net income for Q3 2022 was $36.7 million, or $0.44 per class A and C share on a diluted basis (4). • EBITDA of $95.0 million and Adjusted EBITDA of $85.4 million for Q3 2022. Adjusted EBITDA margins of 43% for Q3 2022. 5
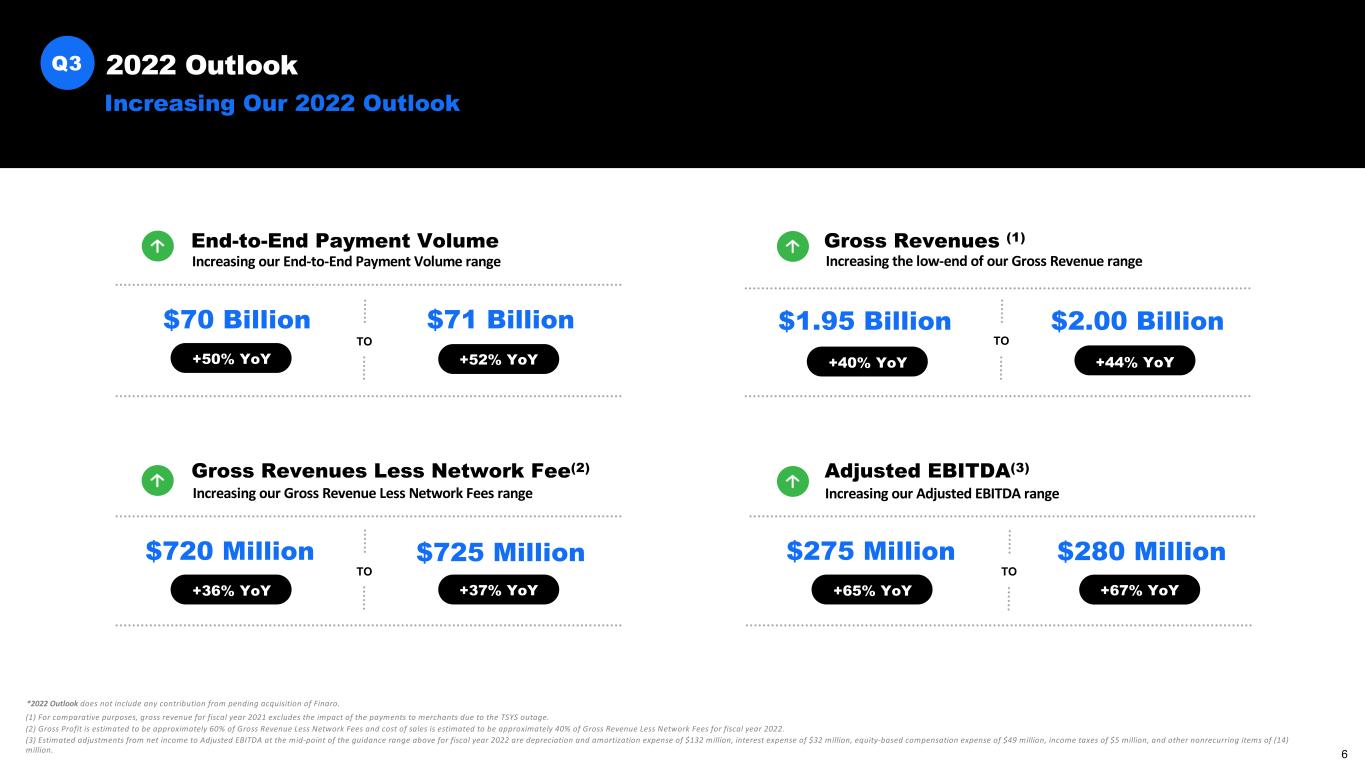
TOTO Increasing Our 2022 Outlook $70 Billion $71 Billion (1) For comparative purposes, gross revenue for fiscal year 2021 excludes the impact of the payments to merchants due to the TSYS outage. (2) Gross Profit is estimated to be approximately 60% of Gross Revenue Less Network Fees and cost of sales is estimated to be approximately 40% of Gross Revenue Less Network Fees for fiscal year 2022. (3) Estimated adjustments from net income to Adjusted EBITDA at the mid-point of the guidance range above for fiscal year 2022 are depreciation and amortization expense of $132 million, interest expense of $32 million, equity-based compensation expense of $49 million, income taxes of $5 million, and other nonrecurring items of (14) million. 2022 OutlookQ3 *2022 Outlook does not include any contribution from pending acquisition of Finaro. +50% YoY +52% YoY Increasing our End-to-End Payment Volume range $1.95 Billion $2.00 Billion Gross Revenues (1) +40% YoY +44% YoY Increasing the low-end of our Gross Revenue range $720 Million $725 Million Gross Revenues Less Network Fee(2) +36% YoY +37% YoY Increasing our Gross Revenue Less Network Fees range $275 Million $280 Million Adjusted EBITDA(3) +65% YoY +67% YoY Increasing our Adjusted EBITDA range End-to-End Payment Volume TOTO 6
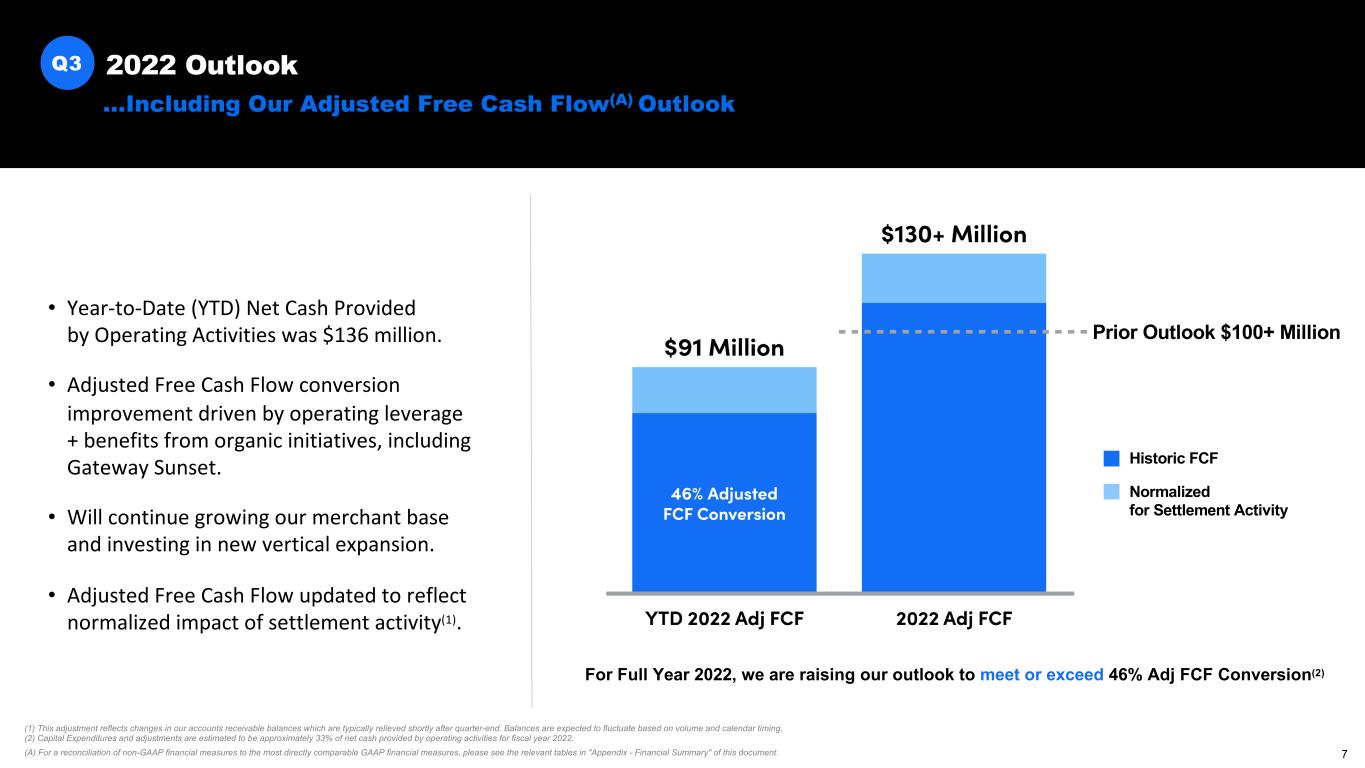
Q3 ...Including Our Adjusted Free Cash Flow(A) Outlook 2022 Outlook • Year-to-Date (YTD) Net Cash Provided by Operating Activities was $136 million. • Adjusted Free Cash Flow conversion improvement driven by operating leverage + benefits from organic initiatives, including Gateway Sunset. • Will continue growing our merchant base and investing in new vertical expansion. • Adjusted Free Cash Flow updated to reflect normalized impact of settlement activity(1). For Full Year 2022, we are raising our outlook to meet or exceed 46% Adj FCF Conversion(2) Prior Outlook $100+ Million Historic FCF Normalized for Settlement Activity (1) This adjustment reflects changes in our accounts receivable balances which are typically relieved shortly after quarter-end. Balances are expected to fluctuate based on volume and calendar timing. (2) Capital Expenditures and adjustments are estimated to be approximately 33% of net cash provided by operating activities for fiscal year 2022. (A) For a reconciliation of non-GAAP financial measures to the most directly comparable GAAP financial measures, please see the relevant tables in "Appendix - Financial Summary" of this document. 7
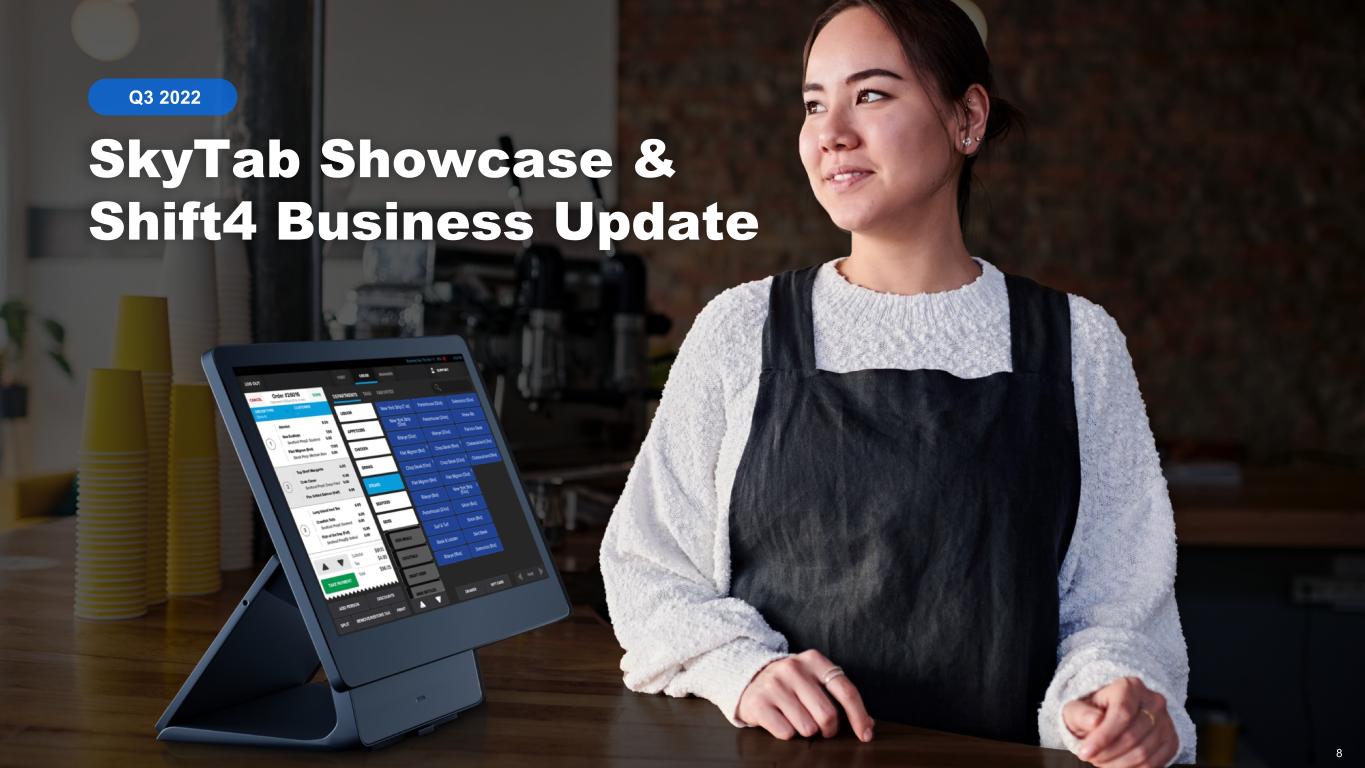
SkyTab Showcase & Shift4 Business Update Q3 2022 8
Introduction High Growth Core SkyTab POS New Verticals International Expansion Capital Allocation, Outlook, Financials Q&A Appendix Agenda 01 02 03 04 05 06 9
Introduction 01 10
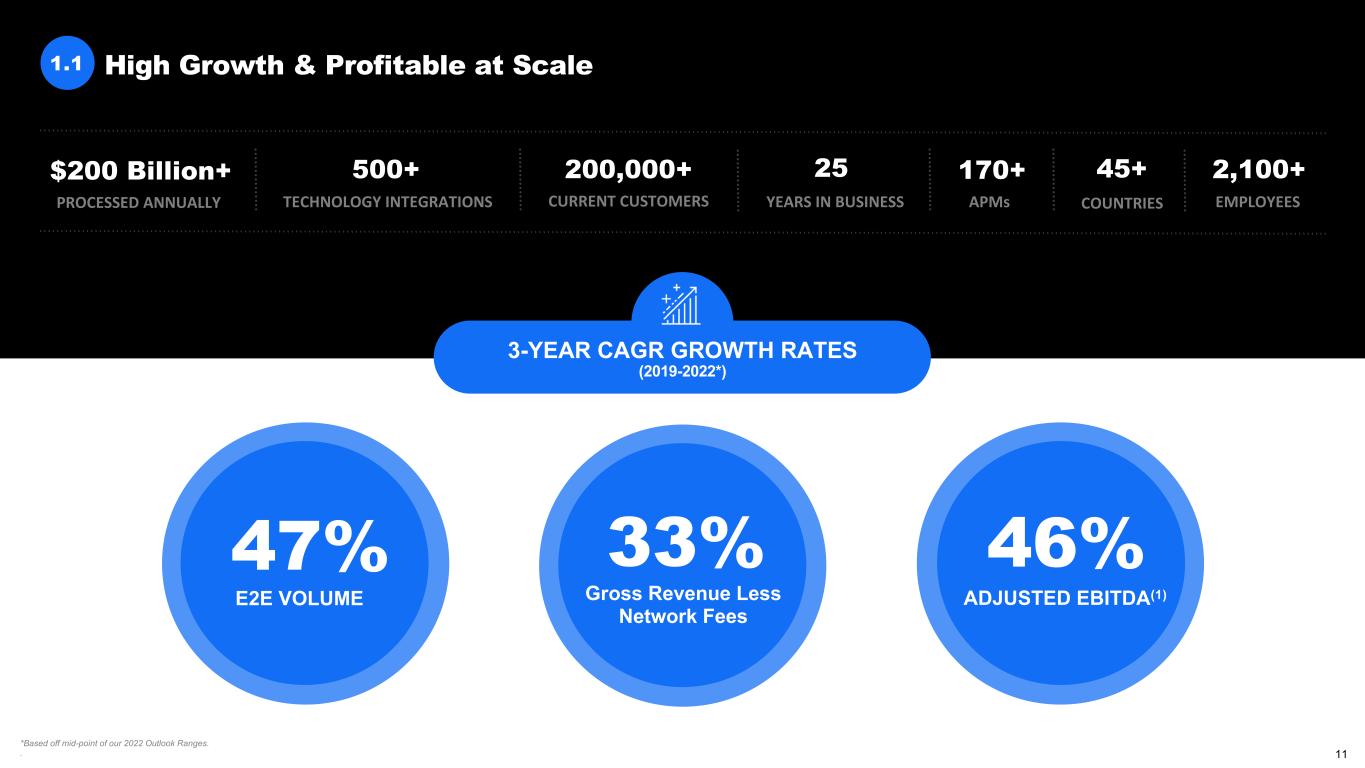
$200 Billion+ PROCESSED ANNUALLY 200,000+ CURRENT CUSTOMERS 500+ TECHNOLOGY INTEGRATIONS 170+ APMs 45+ COUNTRIES 2,100+ EMPLOYEES 47% E2E VOLUME 33% Gross Revenue Less Network Fees 46% ADJUSTED EBITDA(1) 3-YEAR CAGR GROWTH RATES (2019-2022*) *Based off mid-point of our 2022 Outlook Ranges. . 25 YEARS IN BUSINESS High Growth & Profitable at Scale1.1 11
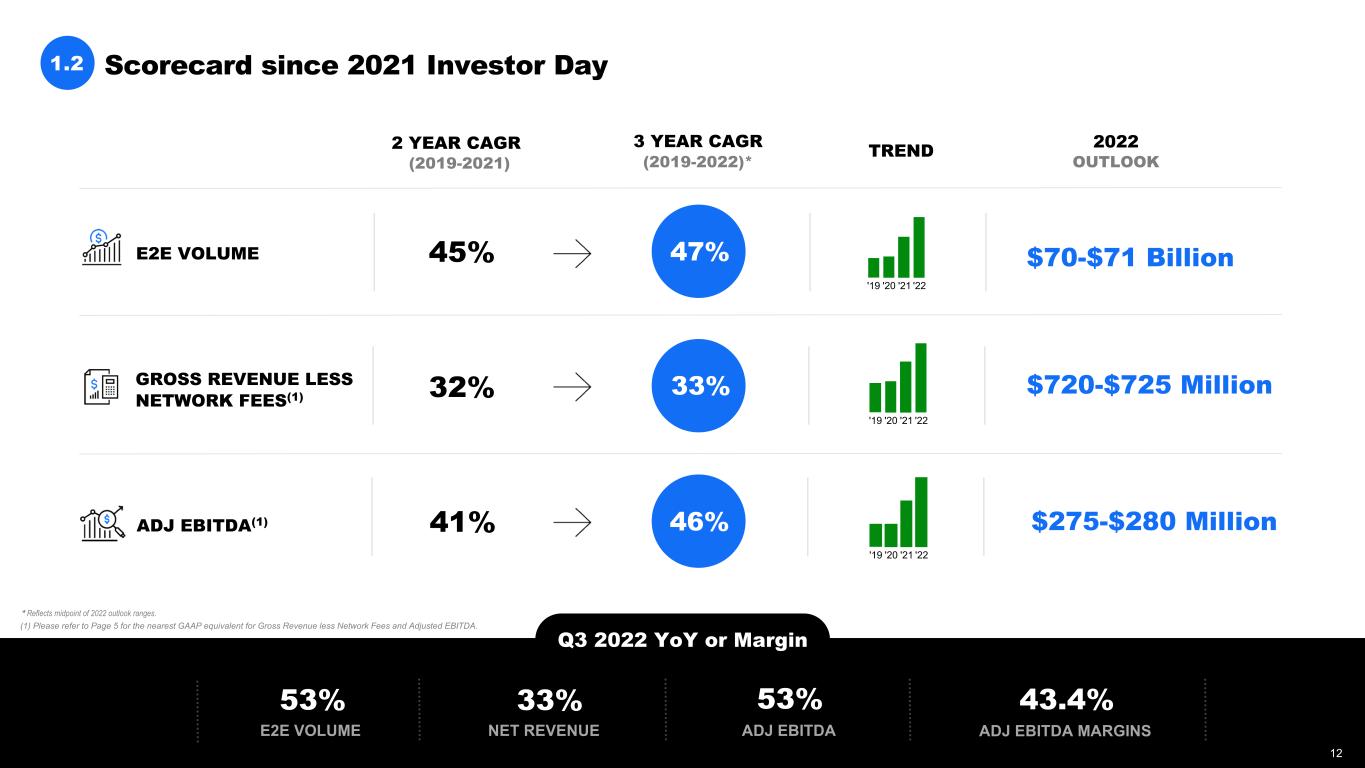
* Reflects midpoint of 2022 outlook ranges. (1) Please refer to Page 5 for the nearest GAAP equivalent for Gross Revenue less Network Fees and Adjusted EBITDA. 2 YEAR CAGR (2019-2021) 45% 32% 41% 47% 3 YEAR CAGR (2019-2022)* Q3 2022 YoY or Margin E2E VOLUME 53% NET REVENUE 33% ADJ EBITDA 53% ADJ EBITDA MARGINS 43.4% $275-$280 Million $720-$725 Million E2E VOLUME GROSS REVENUE LESS NETWORK FEES(1) 2022 OUTLOOK ADJ EBITDA(1) Scorecard since 2021 Investor Day 1.2 TREND 33% 46% $70-$71 Billion '22'21'20'19 '22'21'20'19 '22'21'20'19 12 12
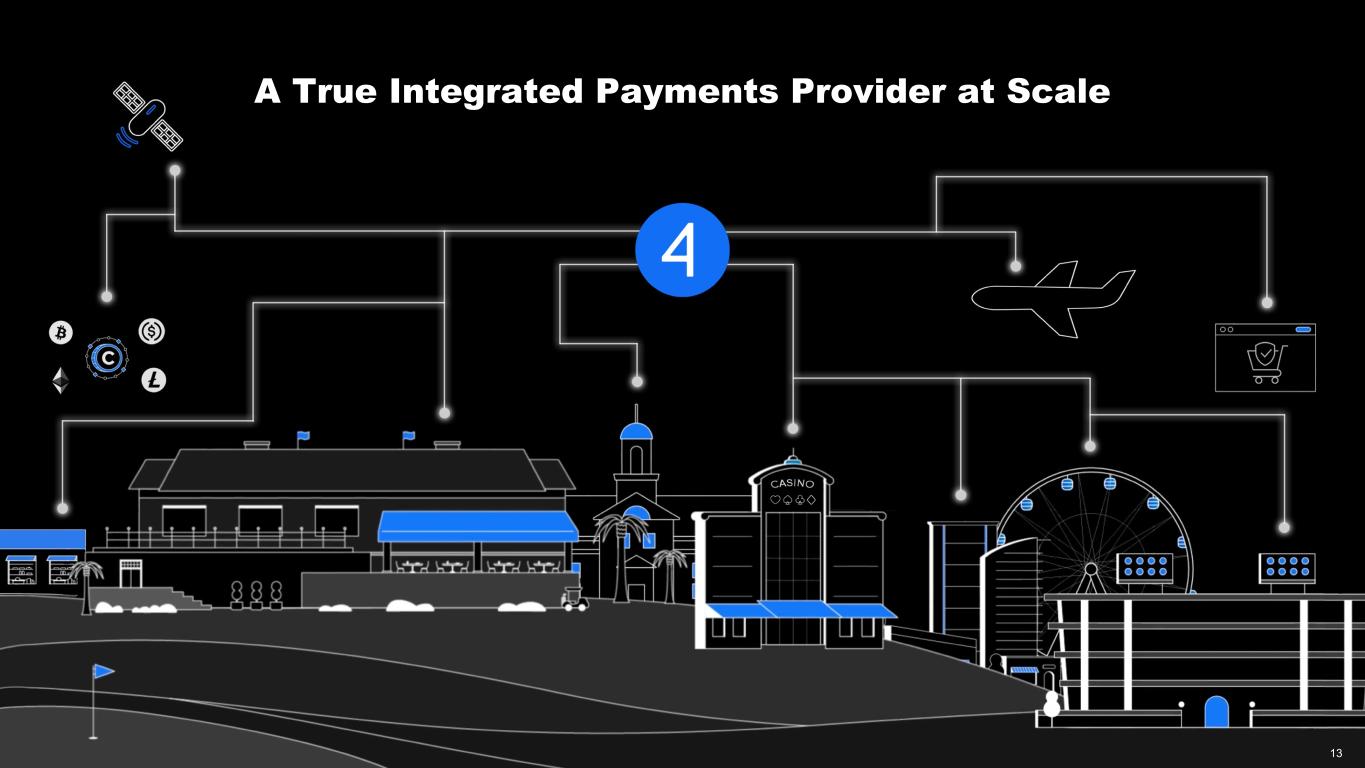
A True Integrated Payments Provider at Scale 13
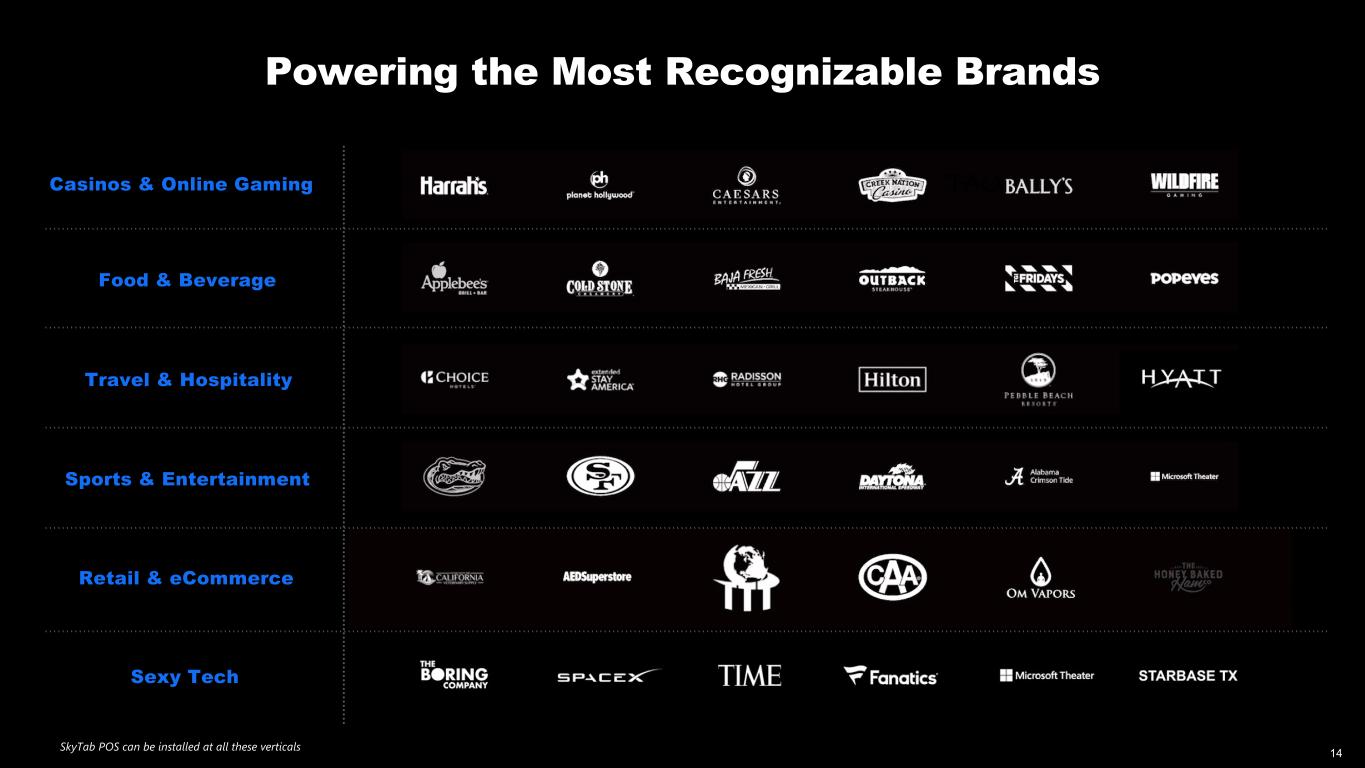
Powering the Most Recognizable Brands Casinos & Online Gaming Food & Beverage Travel & Hospitality Sports & Entertainment Retail & eCommerce Sexy Tech SkyTab POS can be installed at all these verticals 14
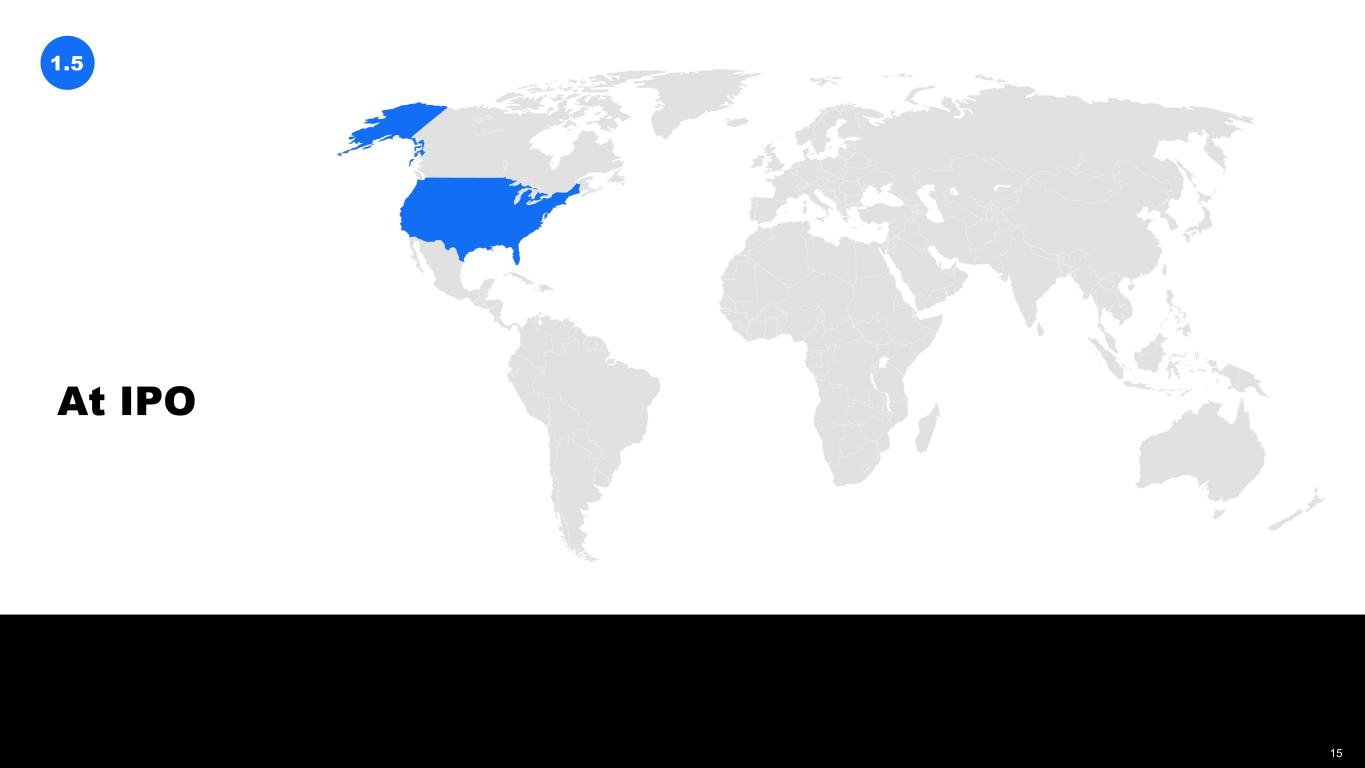
At IPO 1.5 COMING SOON 15
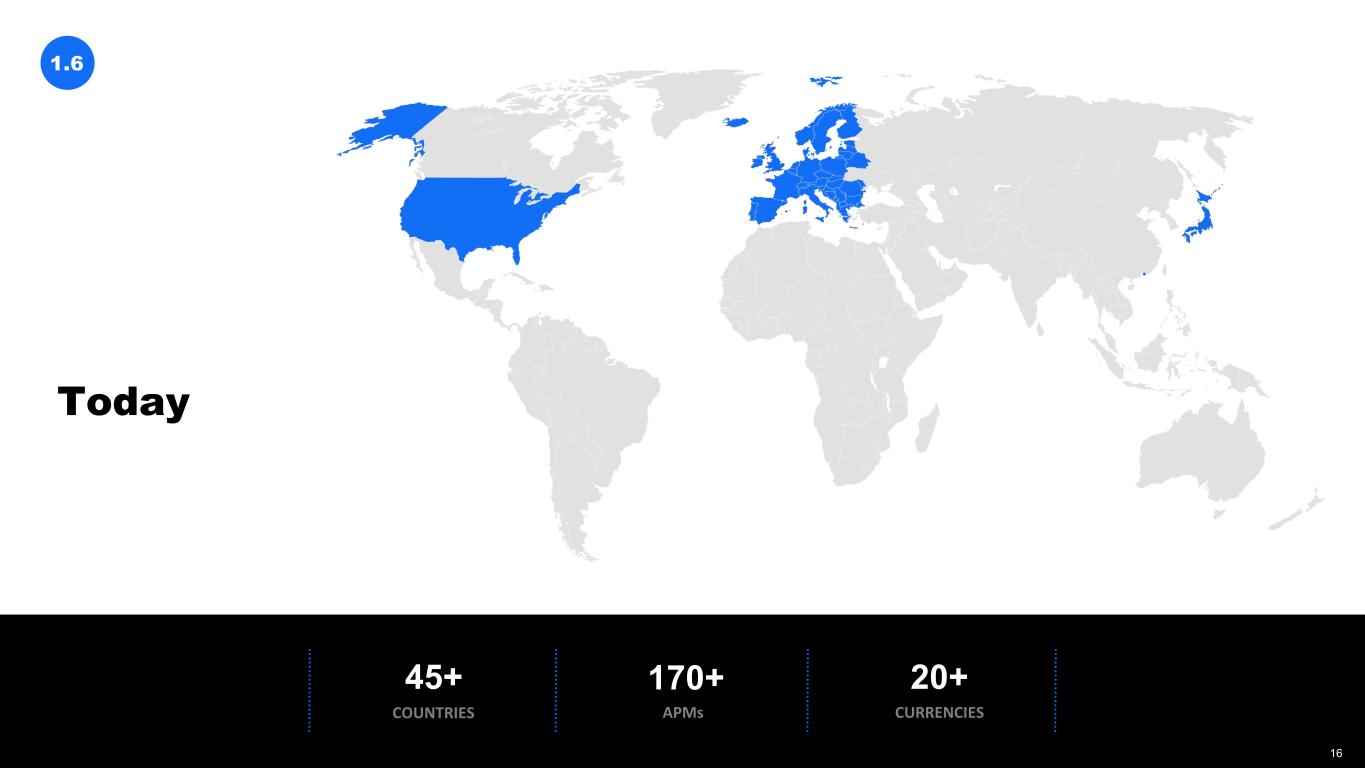
Today 1.6 170+ APMs 20+ CURRENCIES 45+ COUNTRIES 16 16
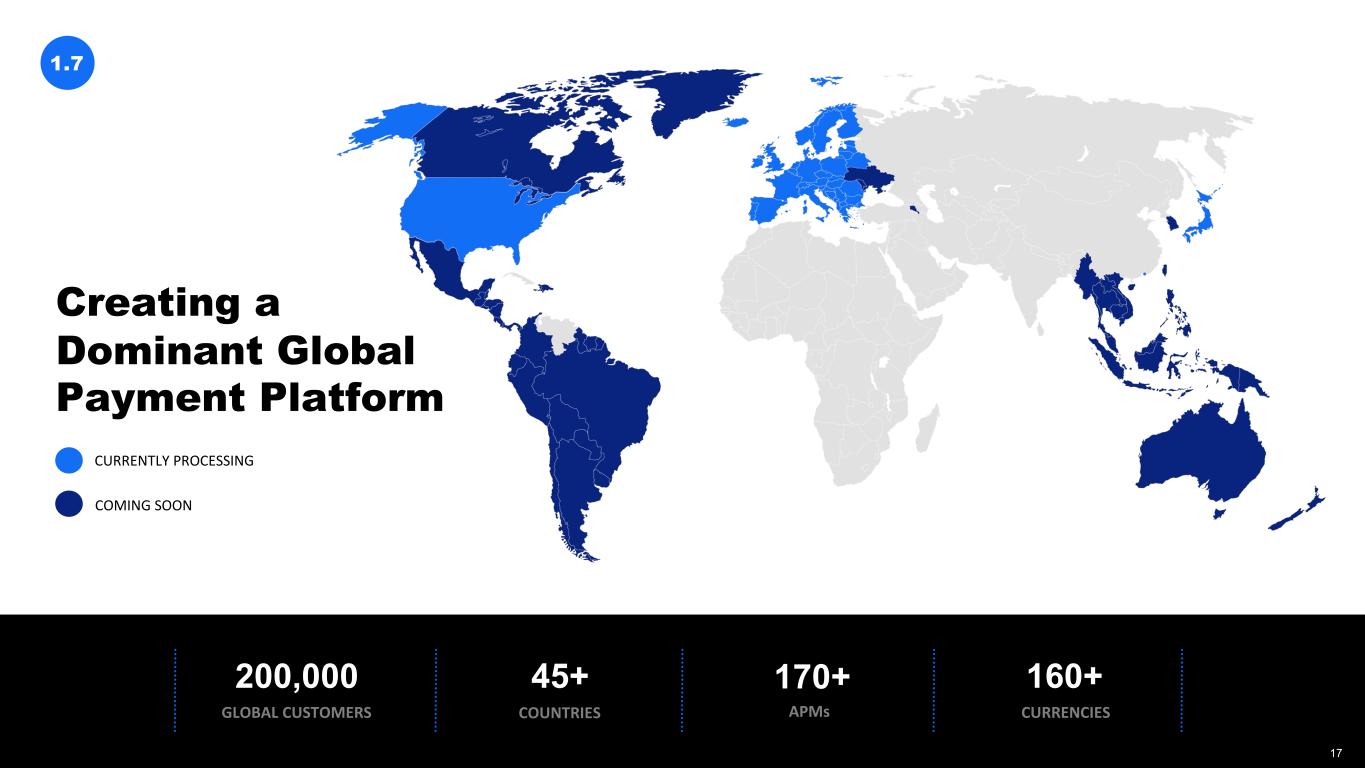
200,000 GLOBAL CUSTOMERS 170+ APMs 160+ CURRENCIES Creating a Dominant Global Payment Platform 1.7 45+ COUNTRIES CURRENTLY PROCESSING COMING SOON 17 17
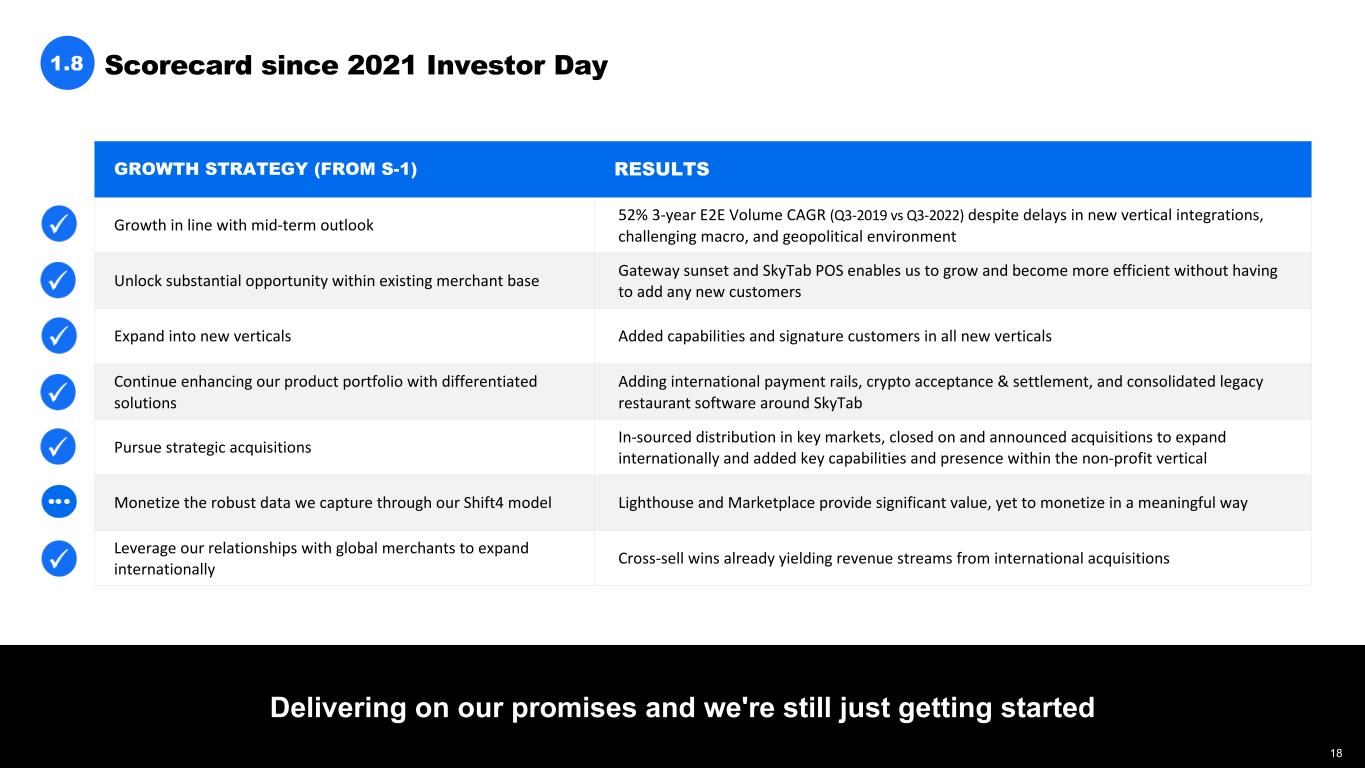
GROWTH STRATEGY (FROM S-1) RESULTS Growth in line with mid-term outlook 52% 3-year E2E Volume CAGR (Q3-2019 vs Q3-2022) despite delays in new vertical integrations, challenging macro, and geopolitical environment Unlock substantial opportunity within existing merchant base Gateway sunset and SkyTab POS enables us to grow and become more efficient without having to add any new customers Expand into new verticals Added capabilities and signature customers in all new verticals Continue enhancing our product portfolio with differentiated solutions Adding international payment rails, crypto acceptance & settlement, and consolidated legacy restaurant software around SkyTab Pursue strategic acquisitions In-sourced distribution in key markets, closed on and announced acquisitions to expand internationally and added key capabilities and presence within the non-profit vertical Monetize the robust data we capture through our Shift4 model Lighthouse and Marketplace provide significant value, yet to monetize in a meaningful way Leverage our relationships with global merchants to expand internationally Cross-sell wins already yielding revenue streams from international acquisitions Delivering on our promises and we're still just getting started Scorecard since 2021 Investor Day 1.8 18 18
High Growth Core 02 19
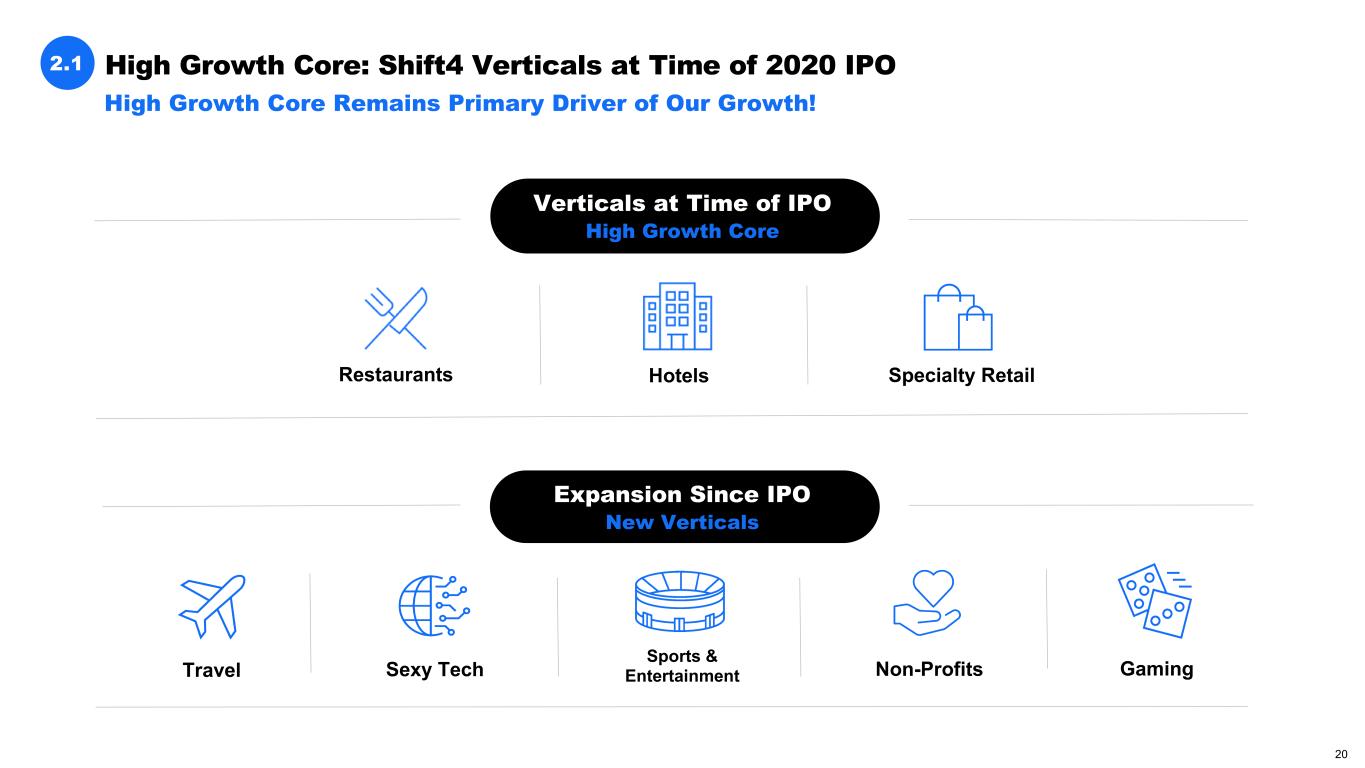
High Growth Core Remains Primary Driver of Our Growth! High Growth Core: Shift4 Verticals at Time of 2020 IPO2.1 Restaurants Hotels Specialty Retail Verticals at Time of IPO High Growth Core Sports & EntertainmentSexy TechTravel Non-Profits Gaming Expansion Since IPO New Verticals 20
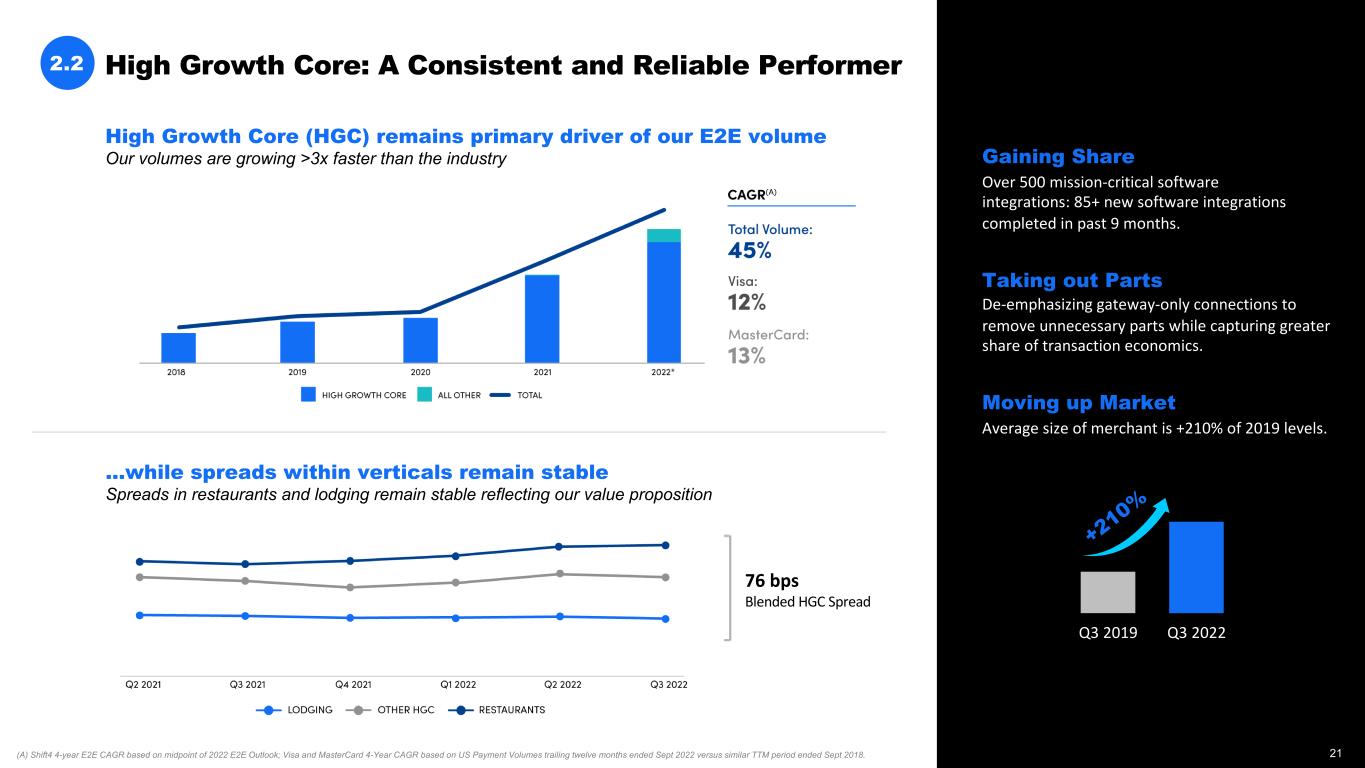
High Growth Core: A Consistent and Reliable Performer2.2 • Gaining Share • Over 500 mission-critical software integrations: 85+ new software integrations completed in past 9 months. • Taking out Parts • De-emphasizing gateway-only connections to remove unnecessary parts while capturing greater share of transaction economics. • Moving up Market • Average size of merchant is +210% of 2019 levels. ...while spreads within verticals remain stable Spreads in restaurants and lodging remain stable reflecting our value proposition High Growth Core (HGC) remains primary driver of our E2E volume Our volumes are growing >3x faster than the industry Q3 2019 Q3 2022 +210% (A) Shift4 4-year E2E CAGR based on midpoint of 2022 E2E Outlook; Visa and MasterCard 4-Year CAGR based on US Payment Volumes trailing twelve months ended Sept 2022 versus similar TTM period ended Sept 2018. 76 bps Blended HGC Spread 21
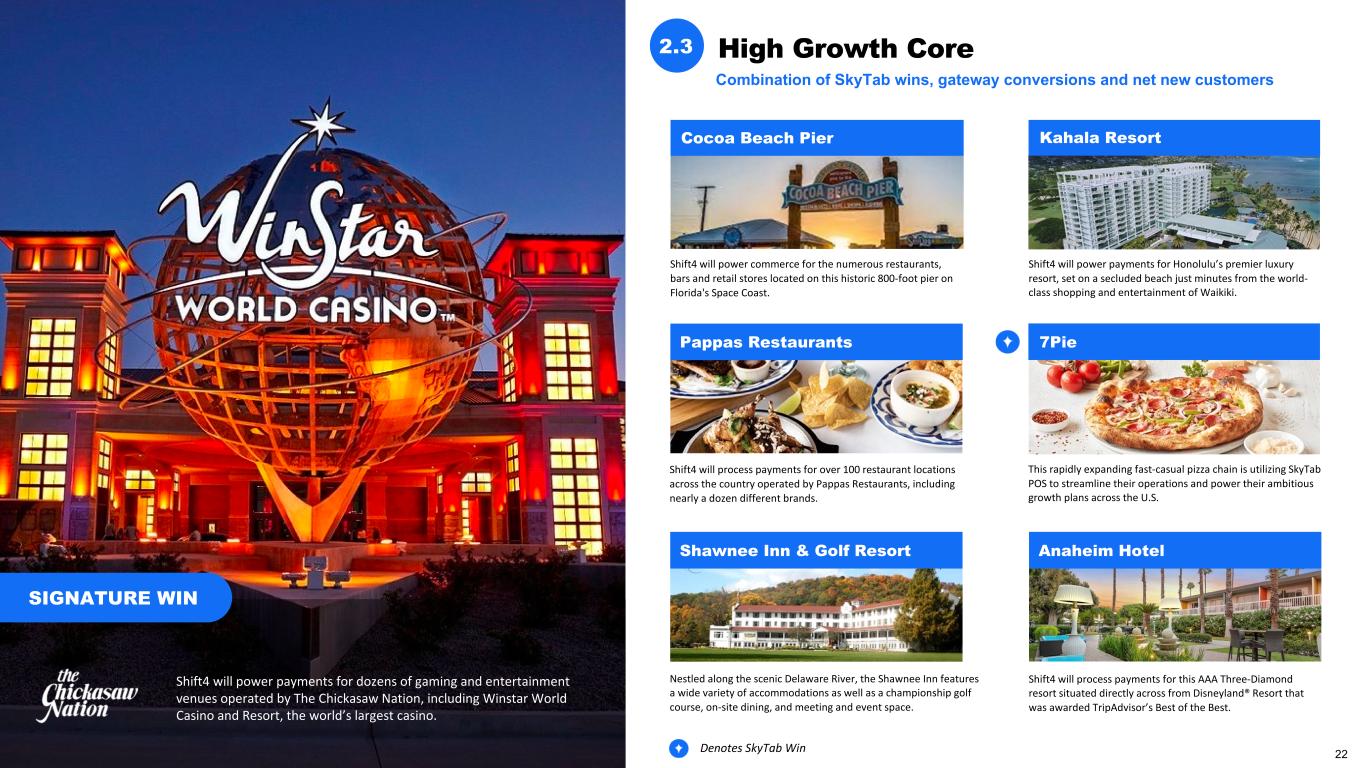
Shift4 will power commerce for the numerous restaurants, bars and retail stores located on this historic 800-foot pier on Florida's Space Coast. Shift4 will power payments for Honolulu’s premier luxury resort, set on a secluded beach just minutes from the world- class shopping and entertainment of Waikiki. Shift4 will process payments for over 100 restaurant locations across the country operated by Pappas Restaurants, including nearly a dozen different brands. This rapidly expanding fast-casual pizza chain is utilizing SkyTab POS to streamline their operations and power their ambitious growth plans across the U.S. Nestled along the scenic Delaware River, the Shawnee Inn features a wide variety of accommodations as well as a championship golf course, on-site dining, and meeting and event space. Shift4 will process payments for this AAA Three-Diamond resort situated directly across from Disneyland® Resort that was awarded TripAdvisor’s Best of the Best. SIGNATURE WIN Shift4 will power payments for dozens of gaming and entertainment venues operated by The Chickasaw Nation, including Winstar World Casino and Resort, the world’s largest casino. High Growth Core2.3 Combination of SkyTab wins, gateway conversions and net new customers Denotes SkyTab Win Cocoa Beach Pier Kahala Resort Pappas Restaurants 7Pie Shawnee Inn & Golf Resort Anaheim Hotel 22
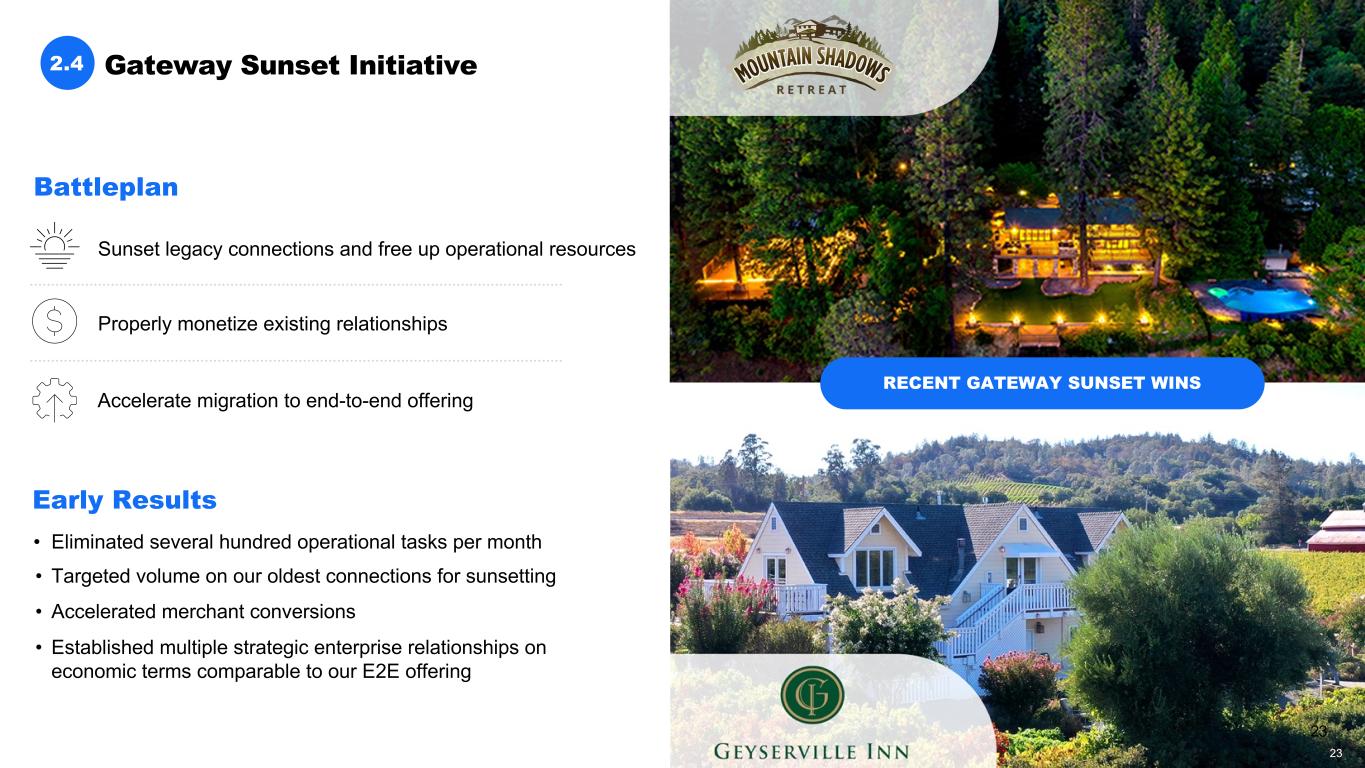
Gateway Sunset Initiative2.4 Battleplan Sunset legacy connections and free up operational resources Early Results Properly monetize existing relationships Accelerate migration to end-to-end offering RECENT GATEWAY SUNSET WINS • Eliminated several hundred operational tasks per month • Targeted volume on our oldest connections for sunsetting • Accelerated merchant conversions • Established multiple strategic enterprise relationships on economic terms comparable to our E2E offering 23 23
SkyTab POS 03 24
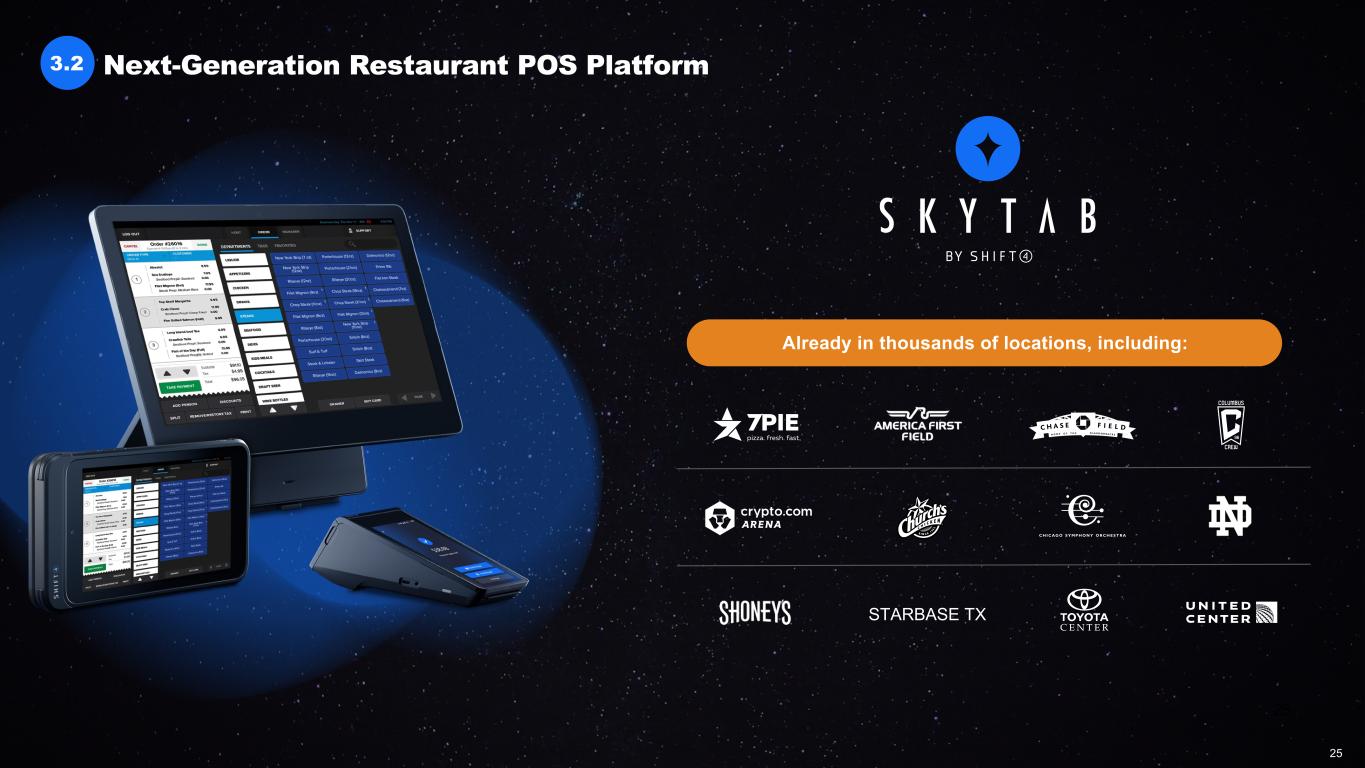
Already in thousands of locations, including: 3.2 Next-Generation Restaurant POS Platform STARBASE TX 25 25
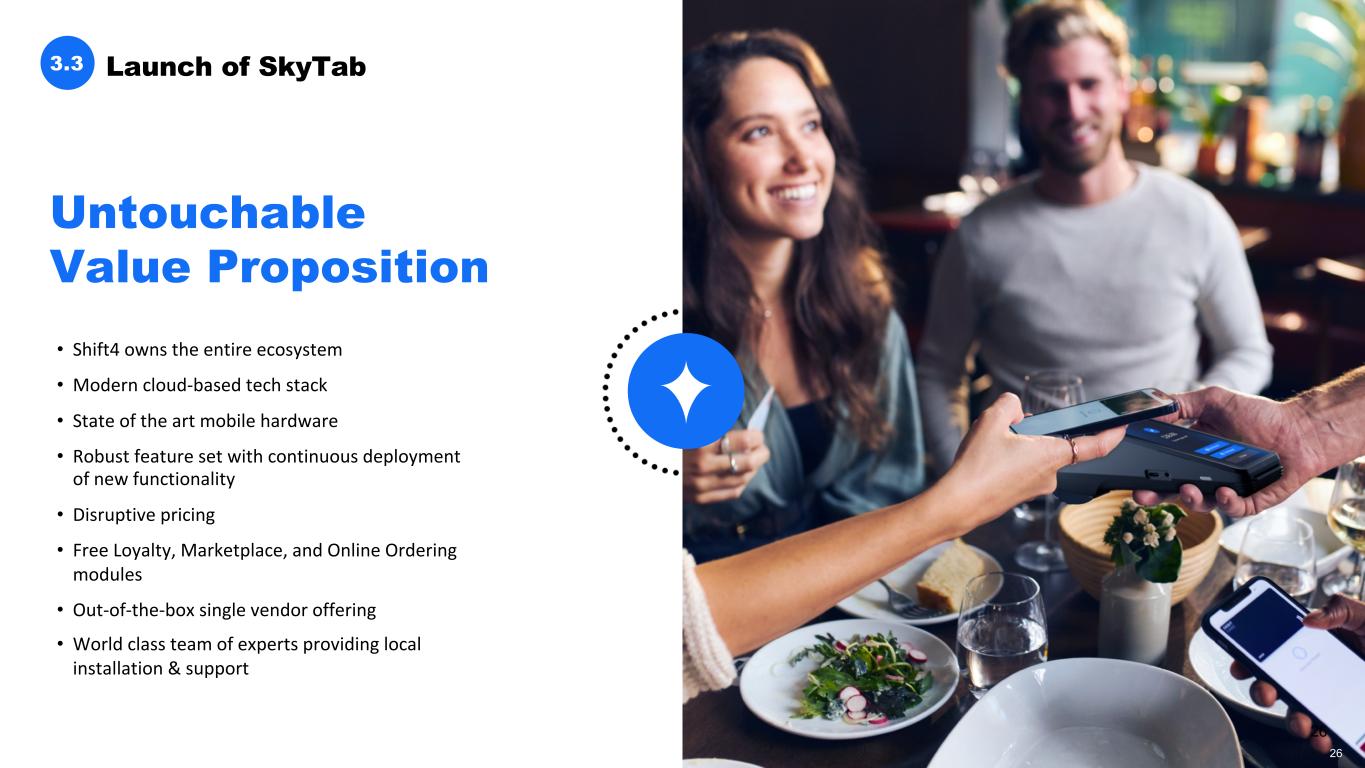
Launch of SkyTab • Shift4 owns the entire ecosystem • Modern cloud-based tech stack • State of the art mobile hardware • Robust feature set with continuous deployment of new functionality • Disruptive pricing • Free Loyalty, Marketplace, and Online Ordering modules • Out-of-the-box single vendor offering • World class team of experts providing local installation & support Untouchable Value Proposition 3.3 26 26
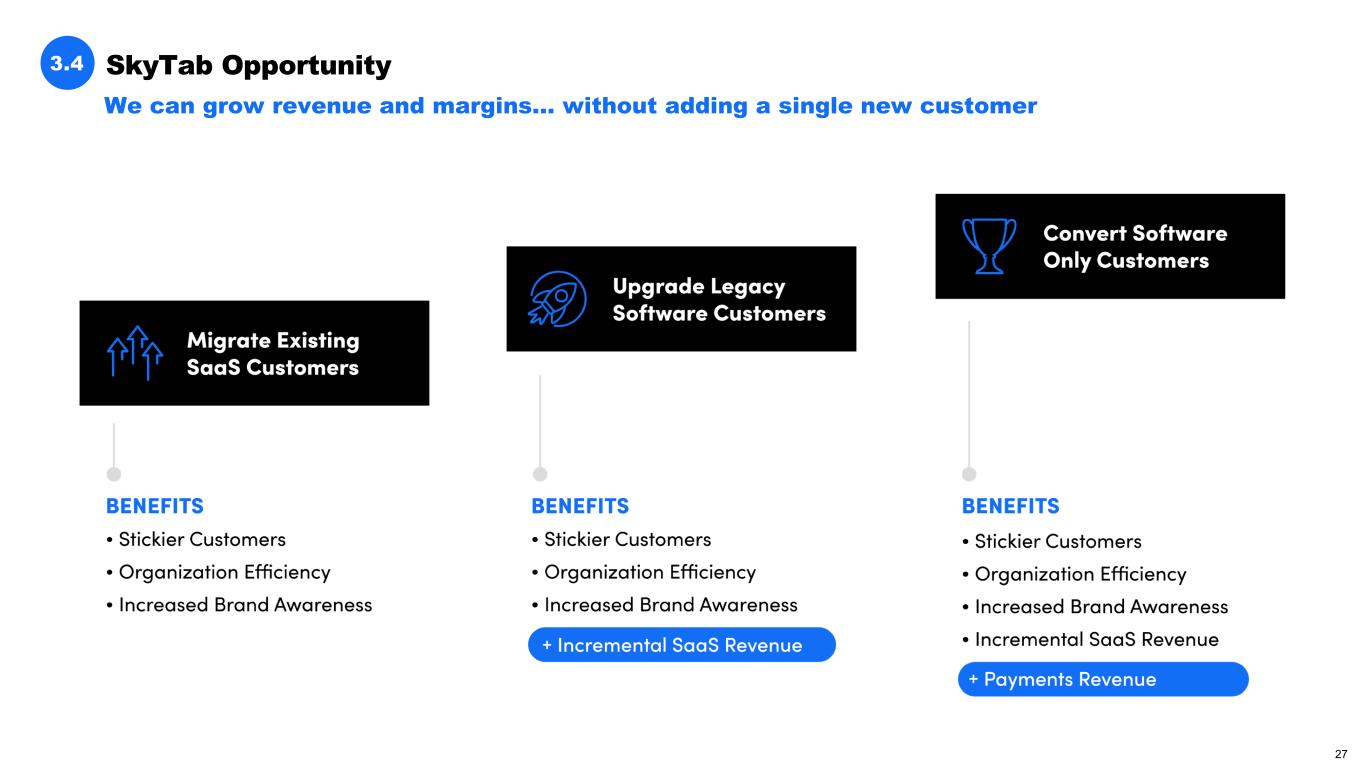
3.4 SkyTab Opportunity We can grow revenue and margins… without adding a single new customer 27
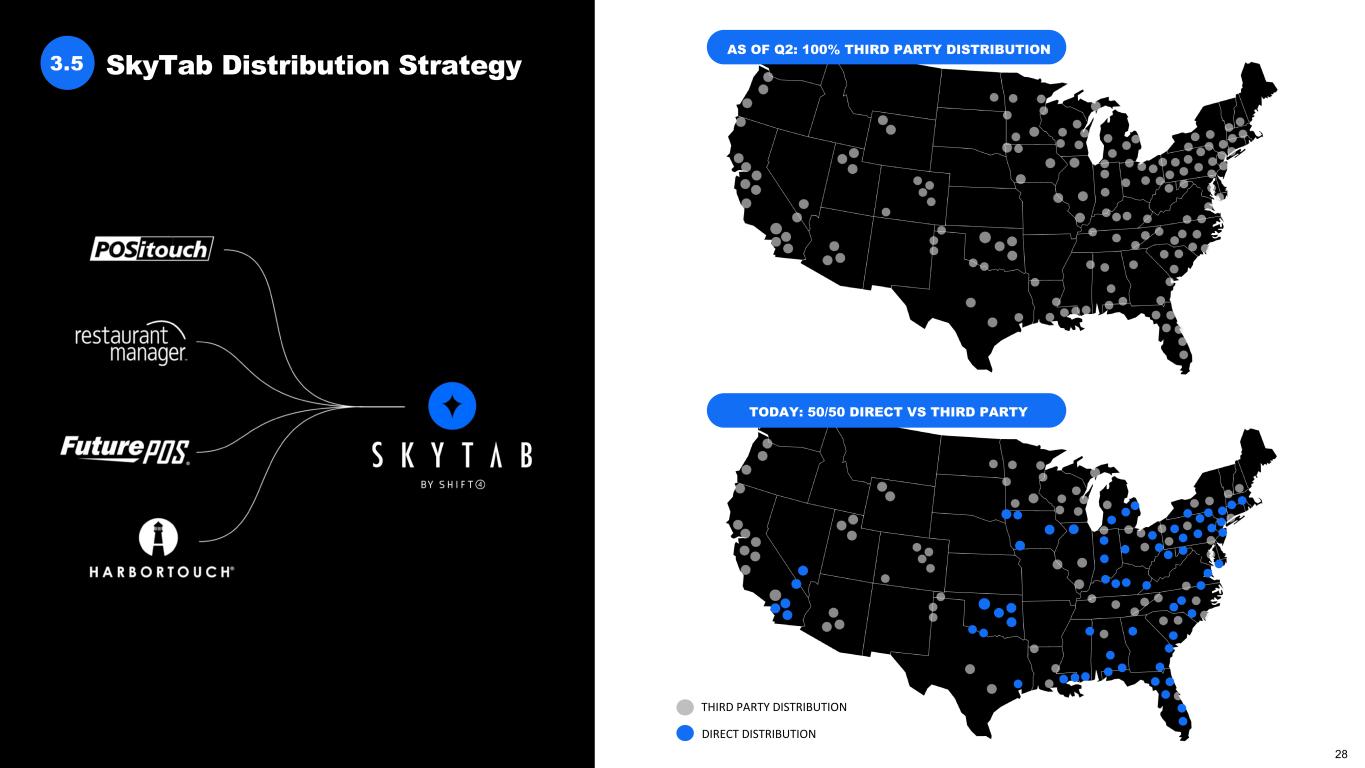
SkyTab Distribution Strategy3.5 THIRD PARTY DISTRIBUTION DIRECT DISTRIBUTION AS OF Q2: 100% THIRD PARTY DISTRIBUTION TODAY: 50/50 DIRECT VS THIRD PARTY 28
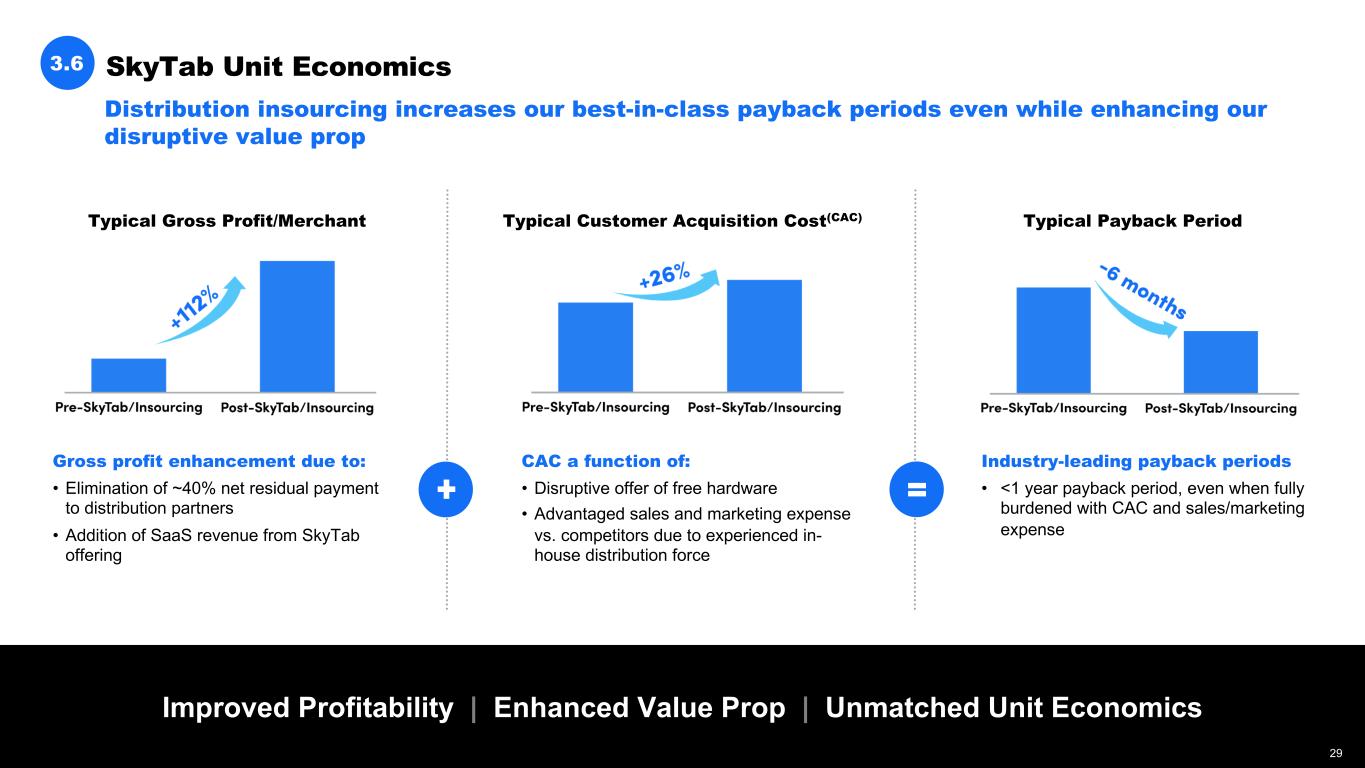
SkyTab Unit Economics Distribution insourcing increases our best-in-class payback periods even while enhancing our disruptive value prop 3.6 Improved Profitability | Enhanced Value Prop | Unmatched Unit Economics Gross profit enhancement due to: • Elimination of ~40% net residual payment to distribution partners • Addition of SaaS revenue from SkyTab offering Typical Gross Profit/Merchant Typical Customer Acquisition Cost(CAC) Typical Payback Period CAC a function of: • Disruptive offer of free hardware • Advantaged sales and marketing expense vs. competitors due to experienced in- house distribution force Industry-leading payback periods • <1 year payback period, even when fully burdened with CAC and sales/marketing expense 29
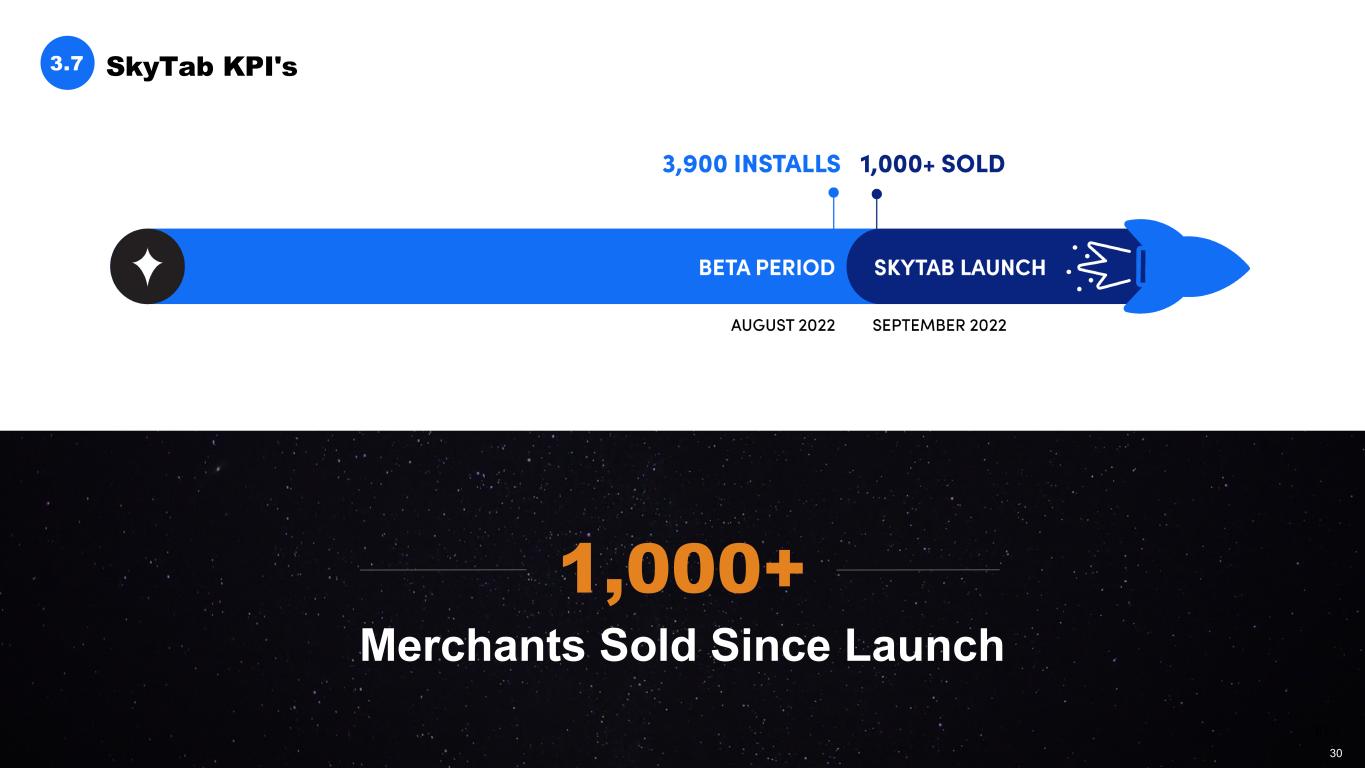
SkyTab KPI's3.7 1,000+ Merchants Sold Since Launch 30 30
New Verticals 04 31
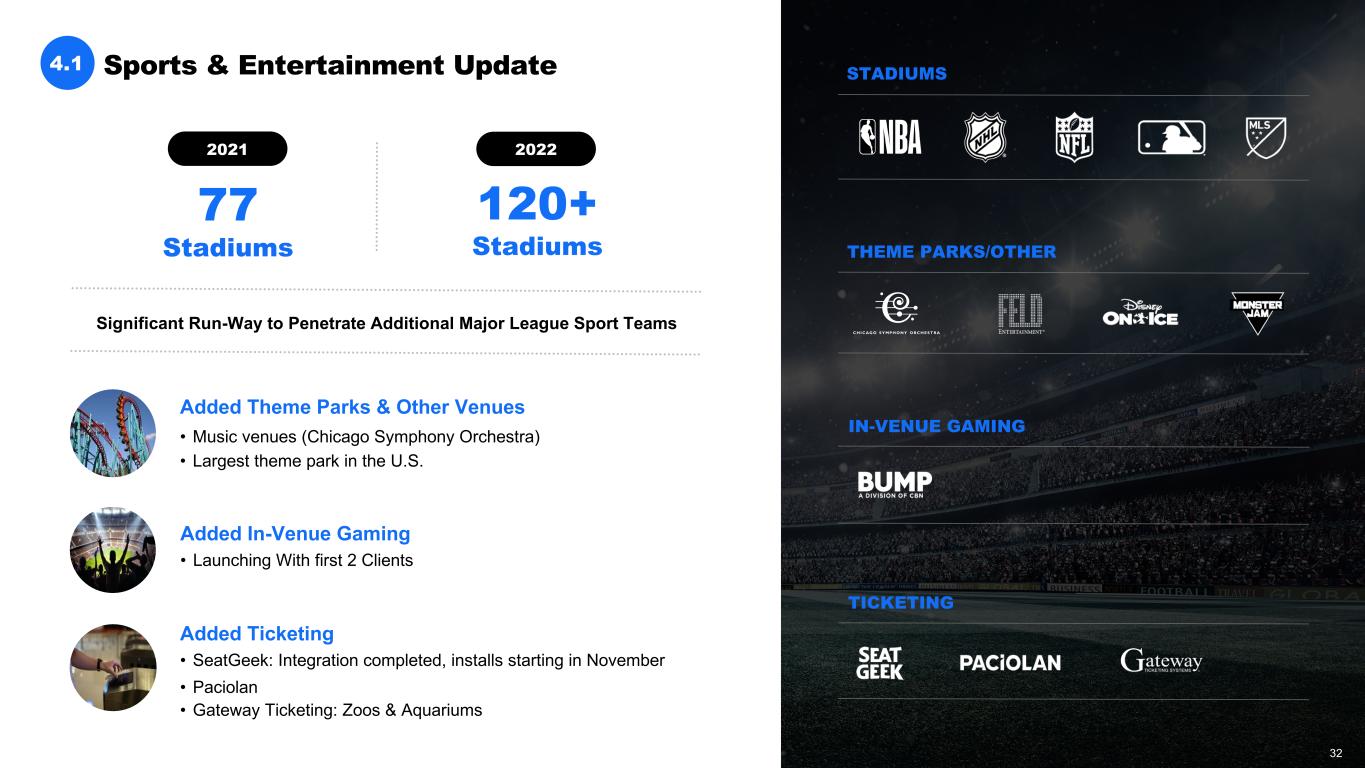
77 Stadiums 120+ Stadiums 4.1 Significant Run-Way to Penetrate Additional Major League Sport Teams Added Theme Parks & Other Venues • Music venues (Chicago Symphony Orchestra) • Largest theme park in the U.S. Added In-Venue Gaming • Launching With first 2 Clients Added Ticketing • SeatGeek: Integration completed, installs starting in November • Paciolan • Gateway Ticketing: Zoos & Aquariums 2021 2022 STADIUMS THEME PARKS/OTHER IN-VENUE GAMING TICKETING Sports & Entertainment Update 32
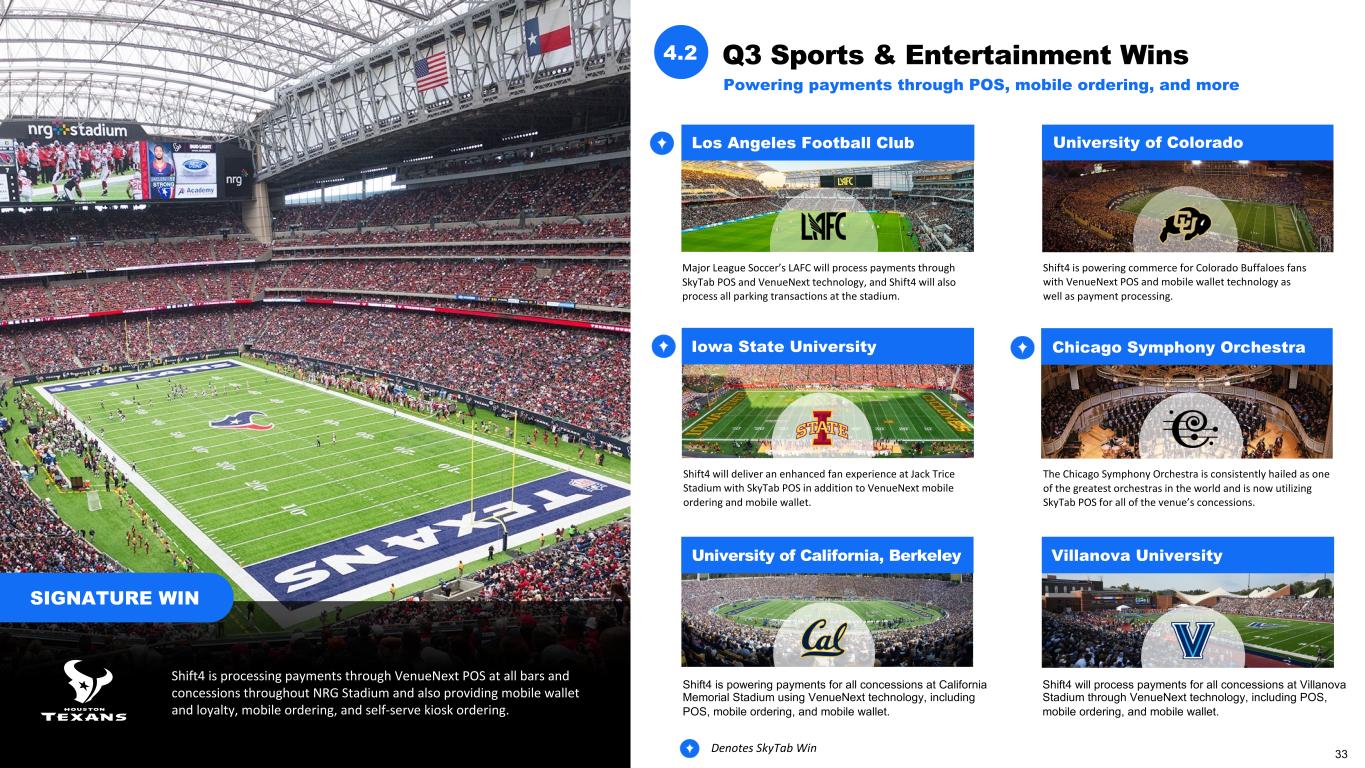
Q3 Sports & Entertainment Wins4.2 Powering payments through POS, mobile ordering, and more SIGNATURE WIN Shift4 is processing payments through VenueNext POS at all bars and concessions throughout NRG Stadium and also providing mobile wallet and loyalty, mobile ordering, and self-serve kiosk ordering. Major League Soccer’s LAFC will process payments through SkyTab POS and VenueNext technology, and Shift4 will also process all parking transactions at the stadium. Shift4 is powering commerce for Colorado Buffaloes fans with VenueNext POS and mobile wallet technology as well as payment processing. Shift4 will deliver an enhanced fan experience at Jack Trice Stadium with SkyTab POS in addition to VenueNext mobile ordering and mobile wallet. The Chicago Symphony Orchestra is consistently hailed as one of the greatest orchestras in the world and is now utilizing SkyTab POS for all of the venue’s concessions. Shift4 is powering payments for all concessions at California Memorial Stadium using VenueNext technology, including POS, mobile ordering, and mobile wallet. Los Angeles Football Club University of Colorado Iowa State University Chicago Symphony Orchestra University of California, Berkeley Villanova University Shift4 will process payments for all concessions at Villanova Stadium through VenueNext technology, including POS, mobile ordering, and mobile wallet. 33Denotes SkyTab Win
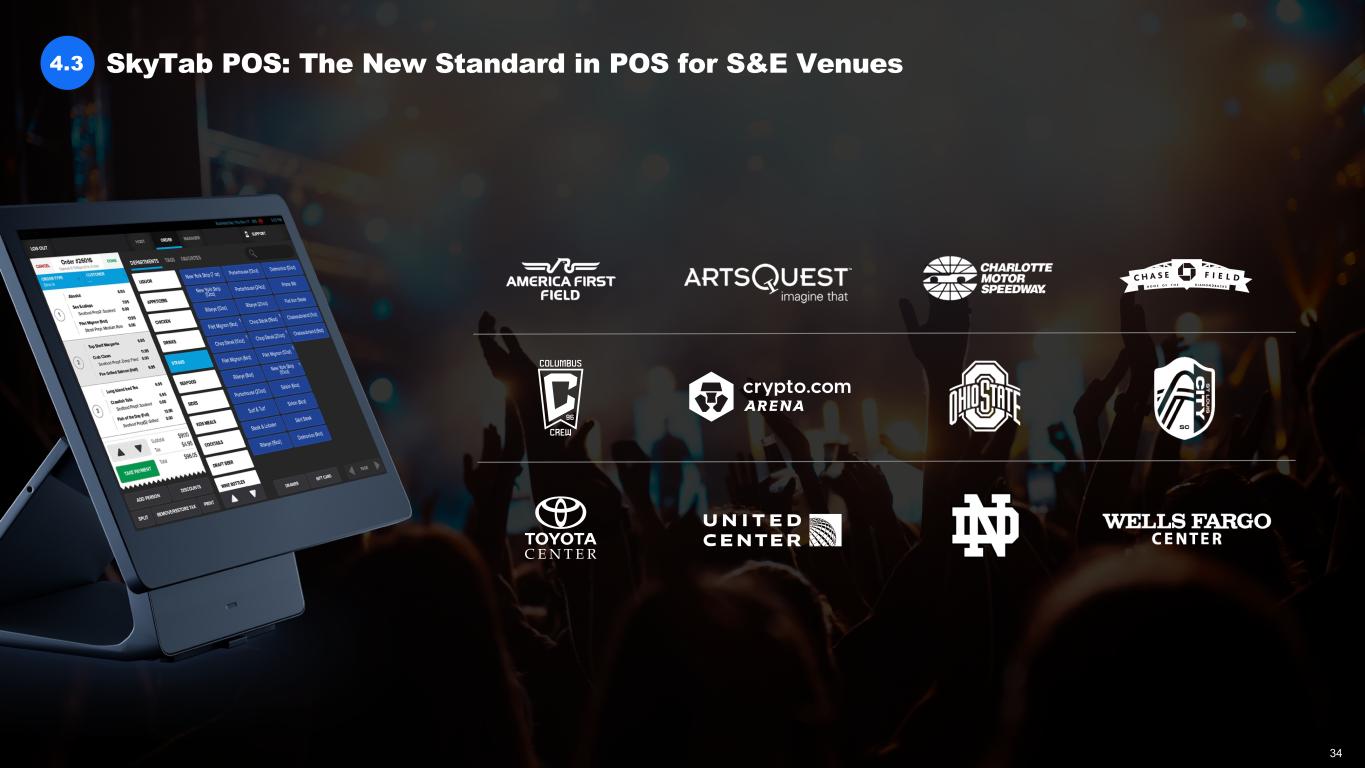
SkyTab POS: The New Standard in POS for S&E Venues4.3 34
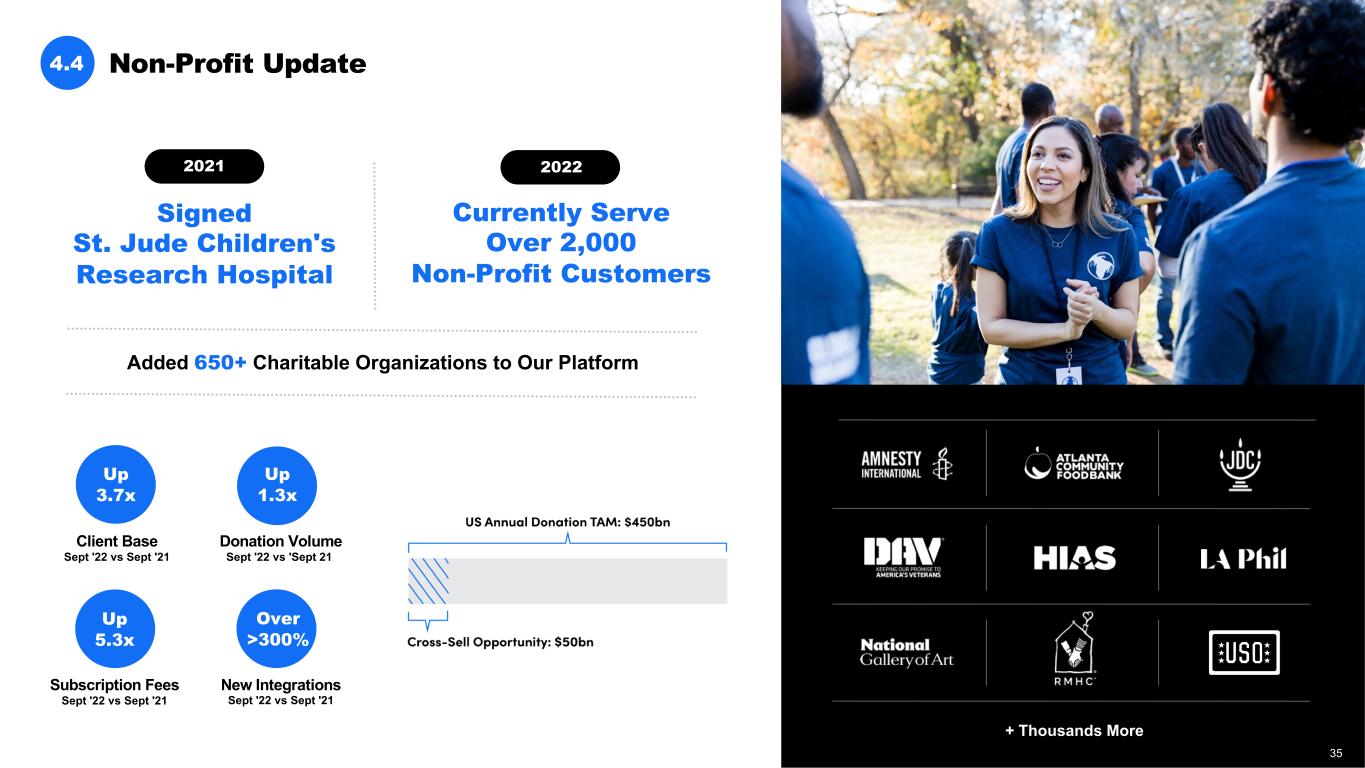
Non-Profit Update4.4 Subscription Fees Sept '22 vs Sept '21 Donation Volume Sept '22 vs 'Sept 21 Client Base Sept '22 vs Sept '21 Up 3.7x Up 1.3x Up 5.3x + Thousands More New Integrations Sept '22 vs Sept '21 Over >300% Signed St. Jude Children's Research Hospital Currently Serve Over 2,000 Non-Profit Customers Added 650+ Charitable Organizations to Our Platform 2021 2022 35
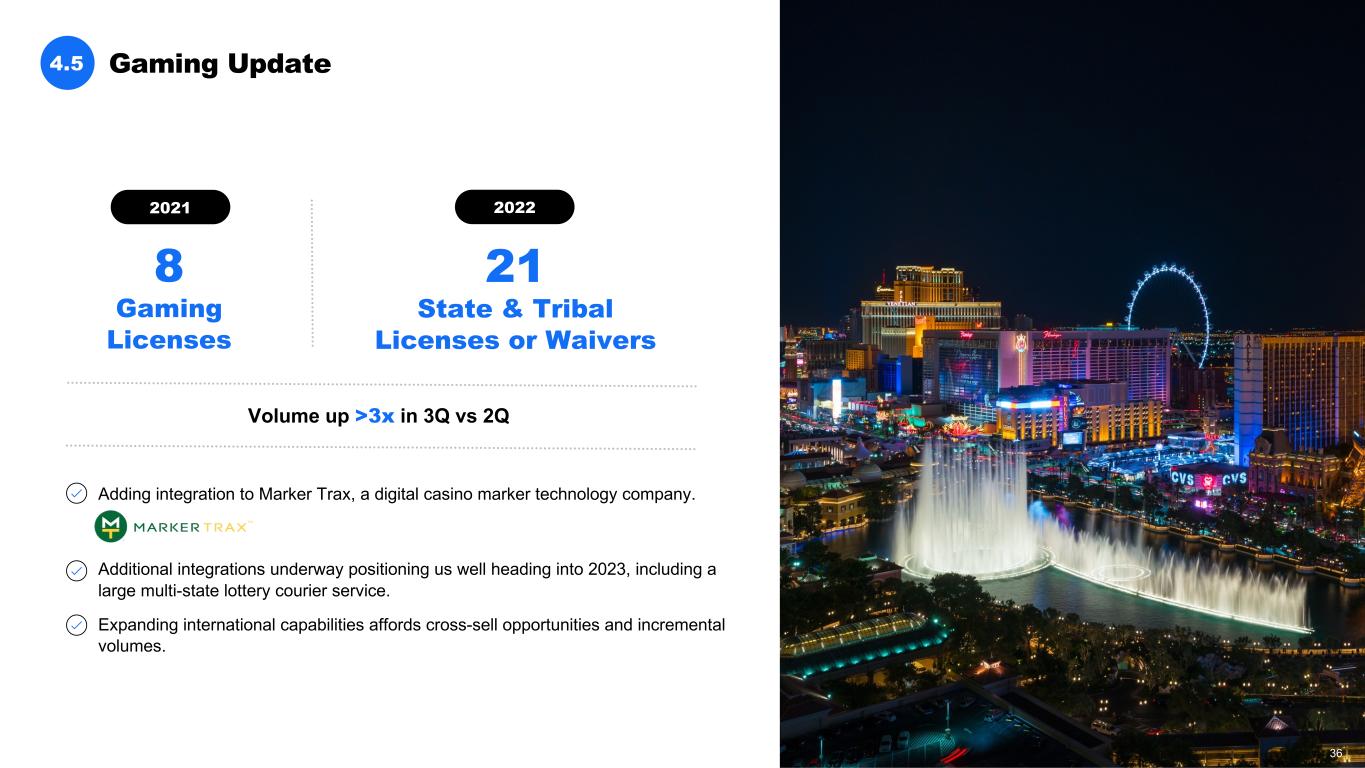
Adding integration to Marker Trax, a digital casino marker technology company. Additional integrations underway positioning us well heading into 2023, including a large multi-state lottery courier service. Expanding international capabilities affords cross-sell opportunities and incremental volumes. Gaming Update4.5 8 Gaming Licenses 21 State & Tribal Licenses or Waivers Volume up >3x in 3Q vs 2Q 2021 2022 36
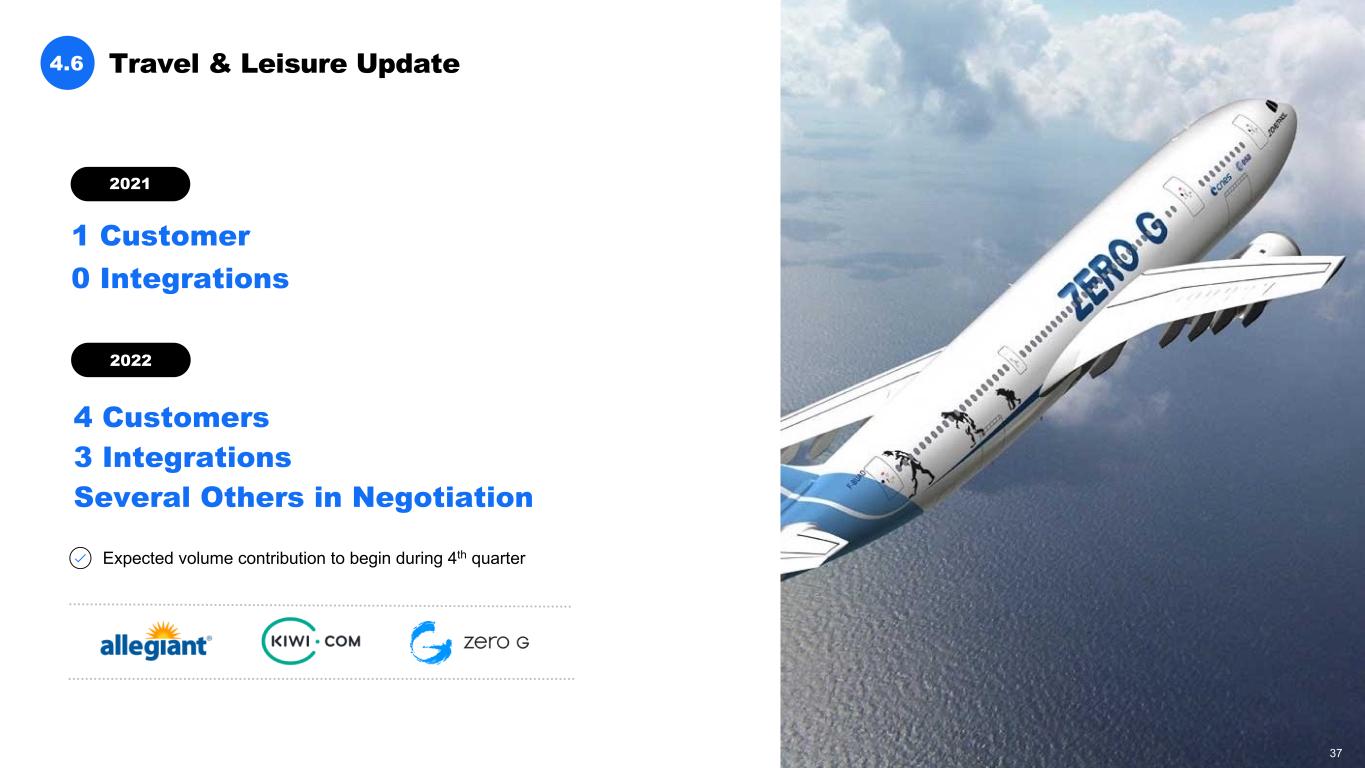
4 Customers 3 Integrations Several Others in Negotiation Expected volume contribution to begin during 4th quarter 1 Customer 0 Integrations Travel & Leisure Update4.6 2021 2022 37
Sexy Tech Update4.7 Attracting global brands and extending our payment rails Acquired international PSP to accelerate integration, risk management, recurring billing and business intelligence for sophisticated global customers Secured First Strategic Client Massive Volume Ramp 2nd Half Driving International Expansion Strategy 2021 2022 ADDED: 38
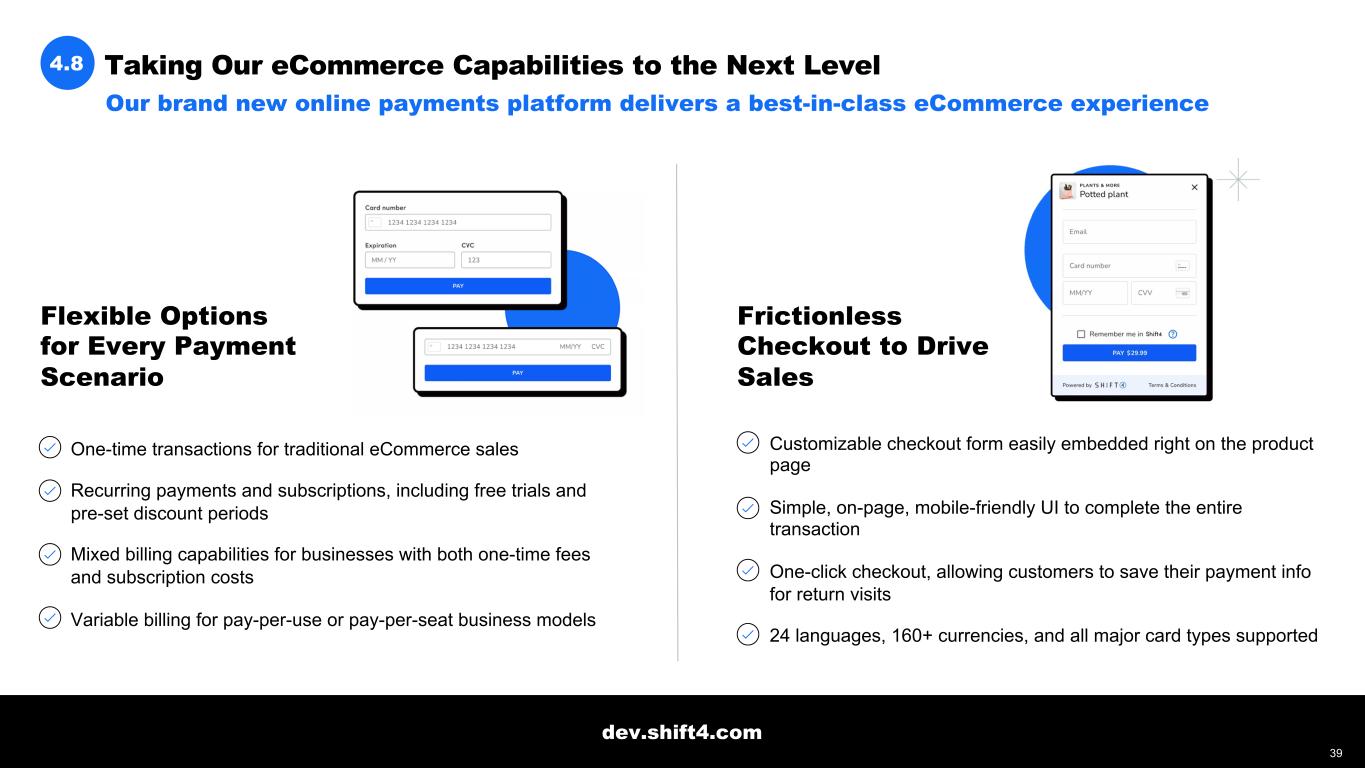
Taking Our eCommerce Capabilities to the Next Level4.8 Our brand new online payments platform delivers a best-in-class eCommerce experience One-time transactions for traditional eCommerce sales Recurring payments and subscriptions, including free trials and pre-set discount periods Mixed billing capabilities for businesses with both one-time fees and subscription costs Variable billing for pay-per-use or pay-per-seat business models Frictionless Checkout to Drive Sales Customizable checkout form easily embedded right on the product page Simple, on-page, mobile-friendly UI to complete the entire transaction One-click checkout, allowing customers to save their payment info for return visits 24 languages, 160+ currencies, and all major card types supported Flexible Options for Every Payment Scenario dev.shift4.com 39
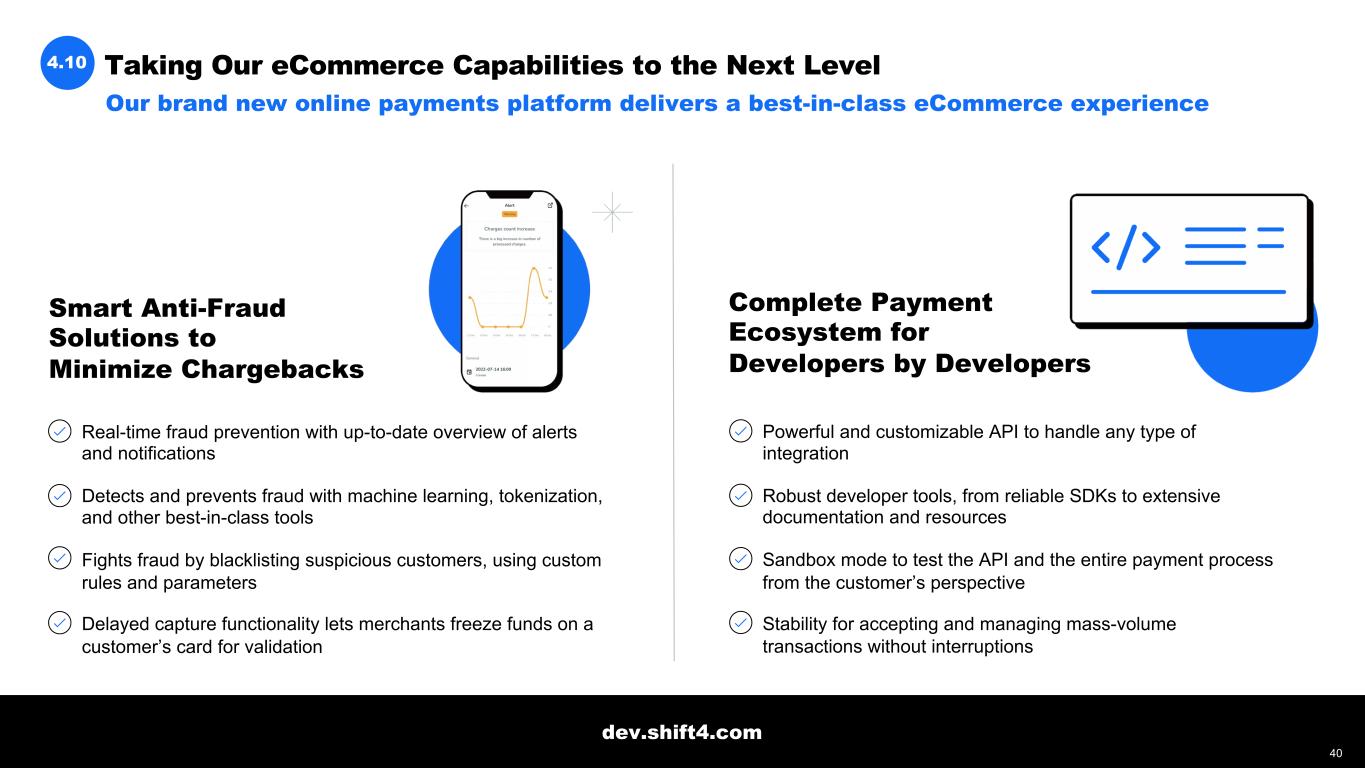
Our brand new online payments platform delivers a best-in-class eCommerce experience 4.10 Taking Our eCommerce Capabilities to the Next Level Real-time fraud prevention with up-to-date overview of alerts and notifications Detects and prevents fraud with machine learning, tokenization, and other best-in-class tools Fights fraud by blacklisting suspicious customers, using custom rules and parameters Delayed capture functionality lets merchants freeze funds on a customer’s card for validation Powerful and customizable API to handle any type of integration Robust developer tools, from reliable SDKs to extensive documentation and resources Sandbox mode to test the API and the entire payment process from the customer’s perspective Stability for accepting and managing mass-volume transactions without interruptions Smart Anti-Fraud Solutions to Minimize Chargebacks Complete Payment Ecosystem for Developers by Developers dev.shift4.com 40
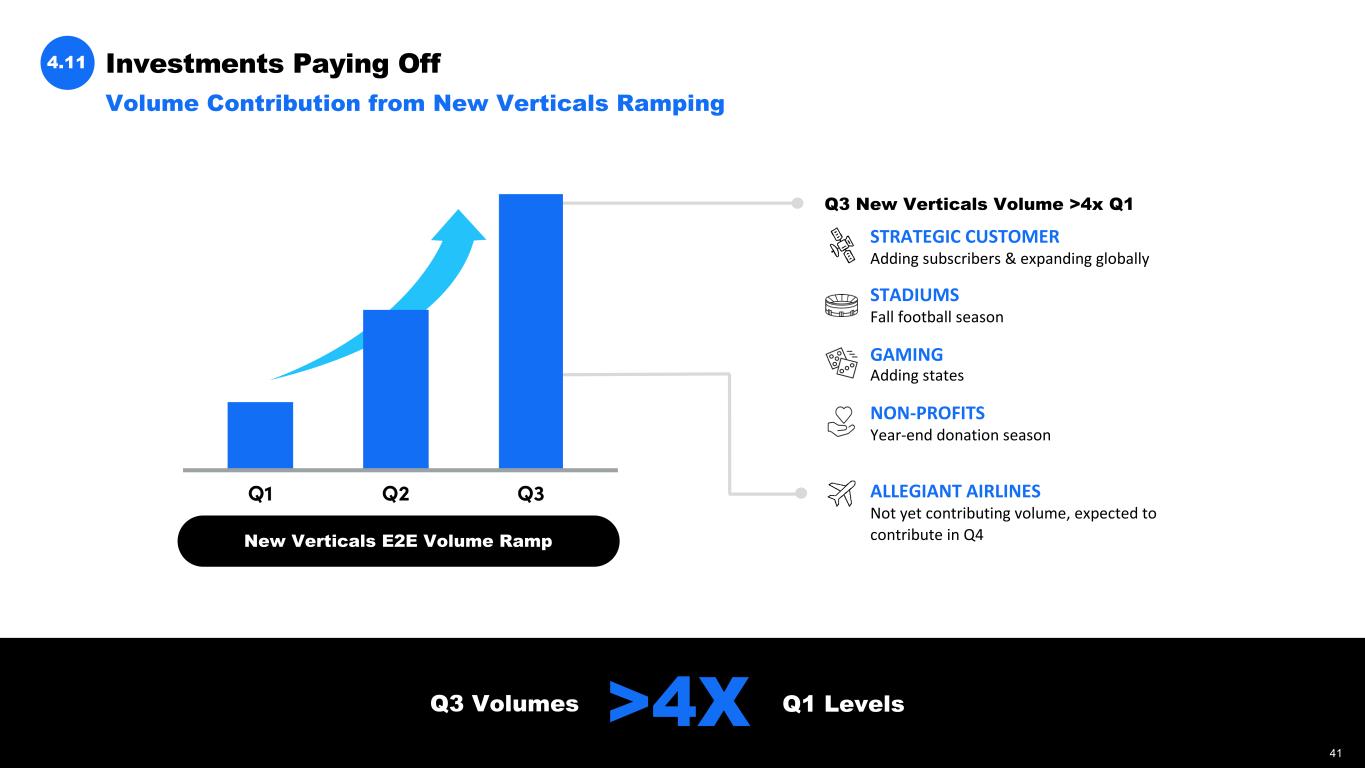
Investments Paying Off4.11 Q3 Volumes >4X Q1 Levels New Verticals E2E Volume Ramp Q3 New Verticals Volume >4x Q1 STRATEGIC CUSTOMER Adding subscribers & expanding globally STADIUMS Fall football season GAMING Adding states NON-PROFITS Year-end donation season ALLEGIANT AIRLINES Not yet contributing volume, expected to contribute in Q4 Volume Contribution from New Verticals Ramping 41
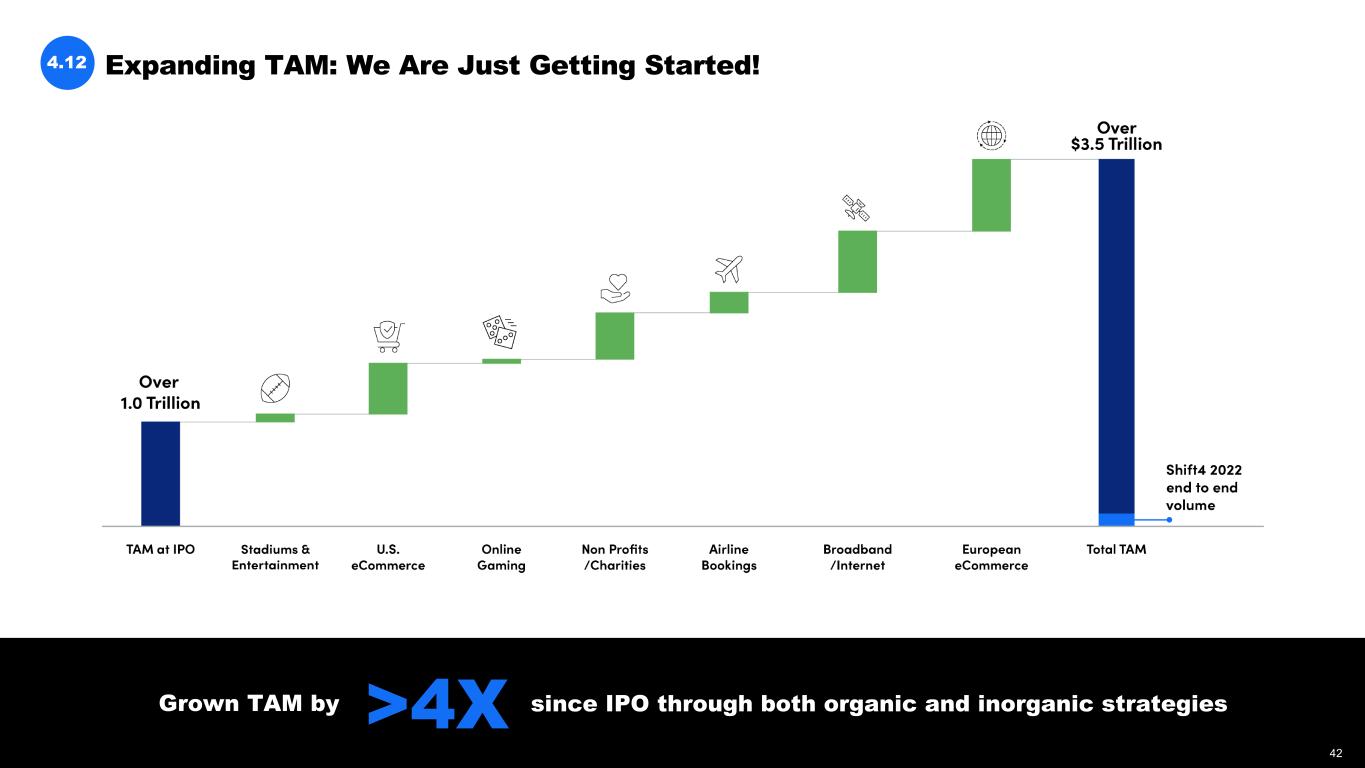
Expanding TAM: We Are Just Getting Started!4.12 Grown TAM by >4X since IPO through both organic and inorganic strategies 42
International Expansion 05 43
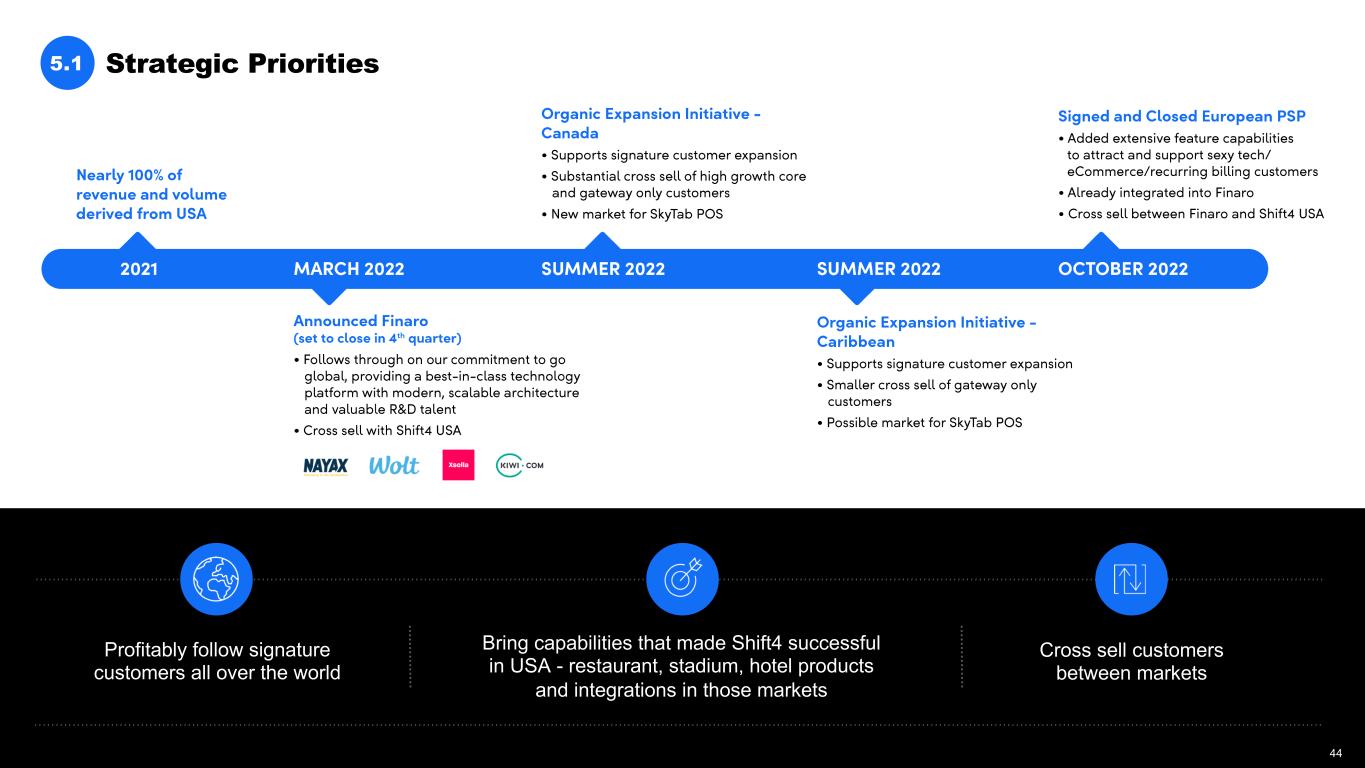
Strategic Priorities5.1 Profitably follow signature customers all over the world Bring capabilities that made Shift4 successful in USA - restaurant, stadium, hotel products and integrations in those markets Cross sell customers between markets 44

Capital Allocation, Outlook, & Financials 06 45
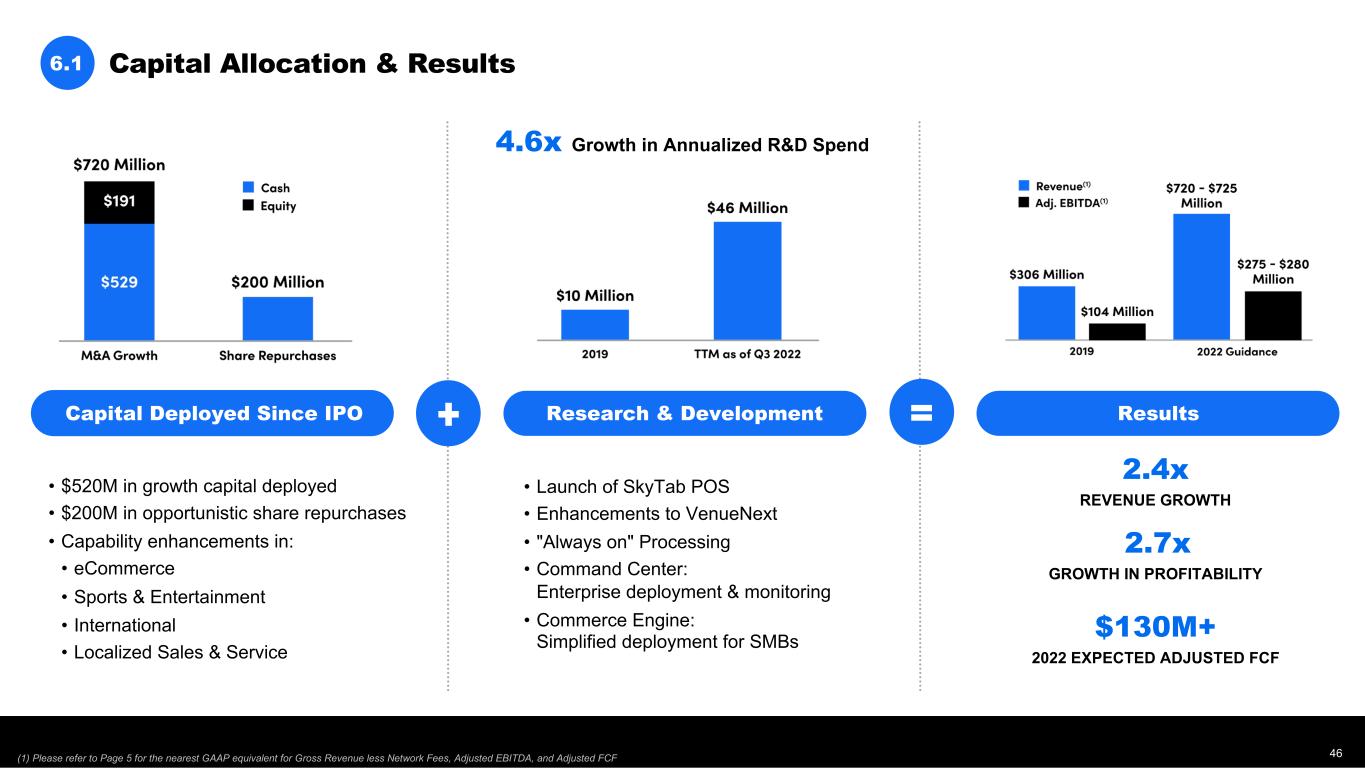
Capital Allocation & Results6.1 2.4x 4.6x Growth in Annualized R&D Spend • $520M in growth capital deployed • $200M in opportunistic share repurchases • Capability enhancements in: • eCommerce • Sports & Entertainment • International • Localized Sales & Service Research & Development ResultsCapital Deployed Since IPO • Launch of SkyTab POS • Enhancements to VenueNext • "Always on" Processing • Command Center: Enterprise deployment & monitoring • Commerce Engine: Simplified deployment for SMBs REVENUE GROWTH 2.7x GROWTH IN PROFITABILITY $130M+ 2022 EXPECTED ADJUSTED FCF (1) Please refer to Page 5 for the nearest GAAP equivalent for Gross Revenue less Network Fees, Adjusted EBITDA, and Adjusted FCF 46
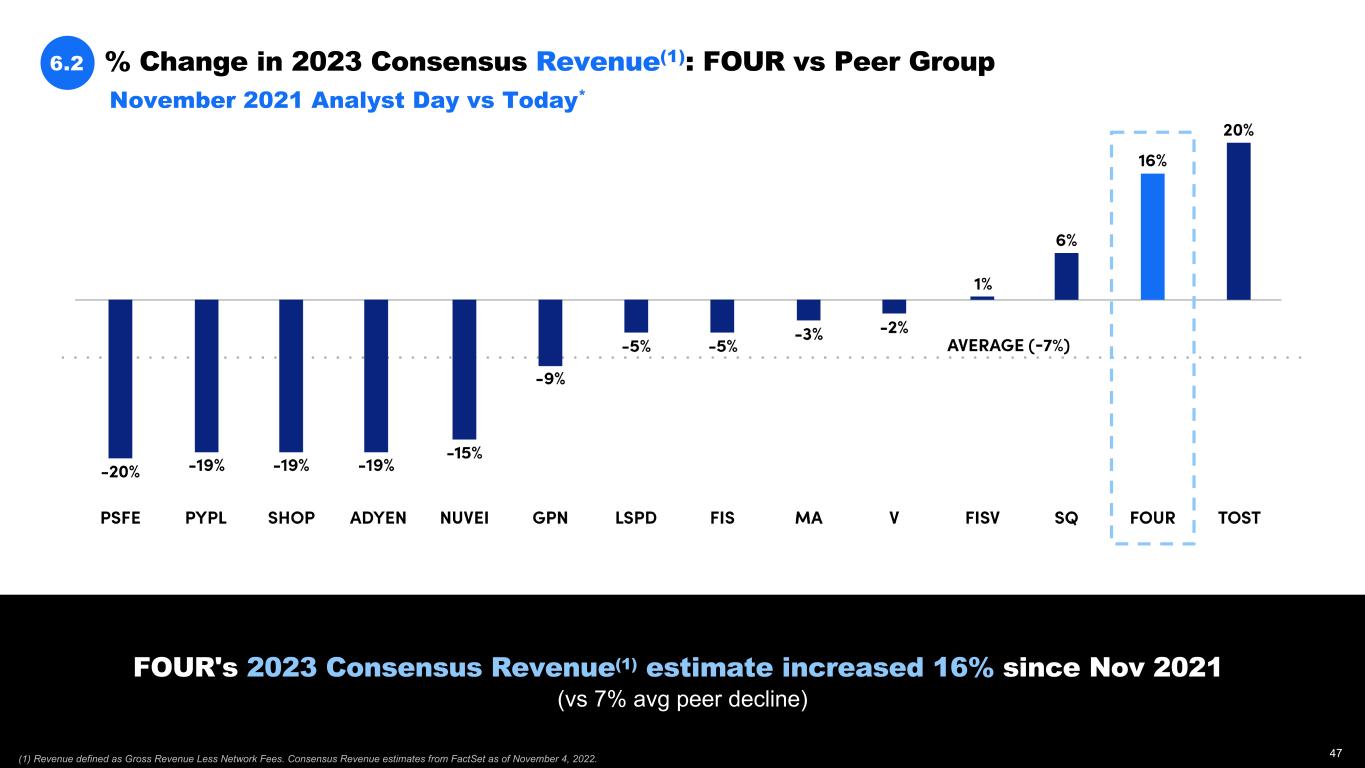
FOUR's 2023 Consensus Revenue(1) estimate increased 16% since Nov 2021 (vs 7% avg peer decline) % Change in 2023 Consensus Revenue(1): FOUR vs Peer Group6.2 November 2021 Analyst Day vs Today* (1) Revenue defined as Gross Revenue Less Network Fees. Consensus Revenue estimates from FactSet as of November 4, 2022. 47
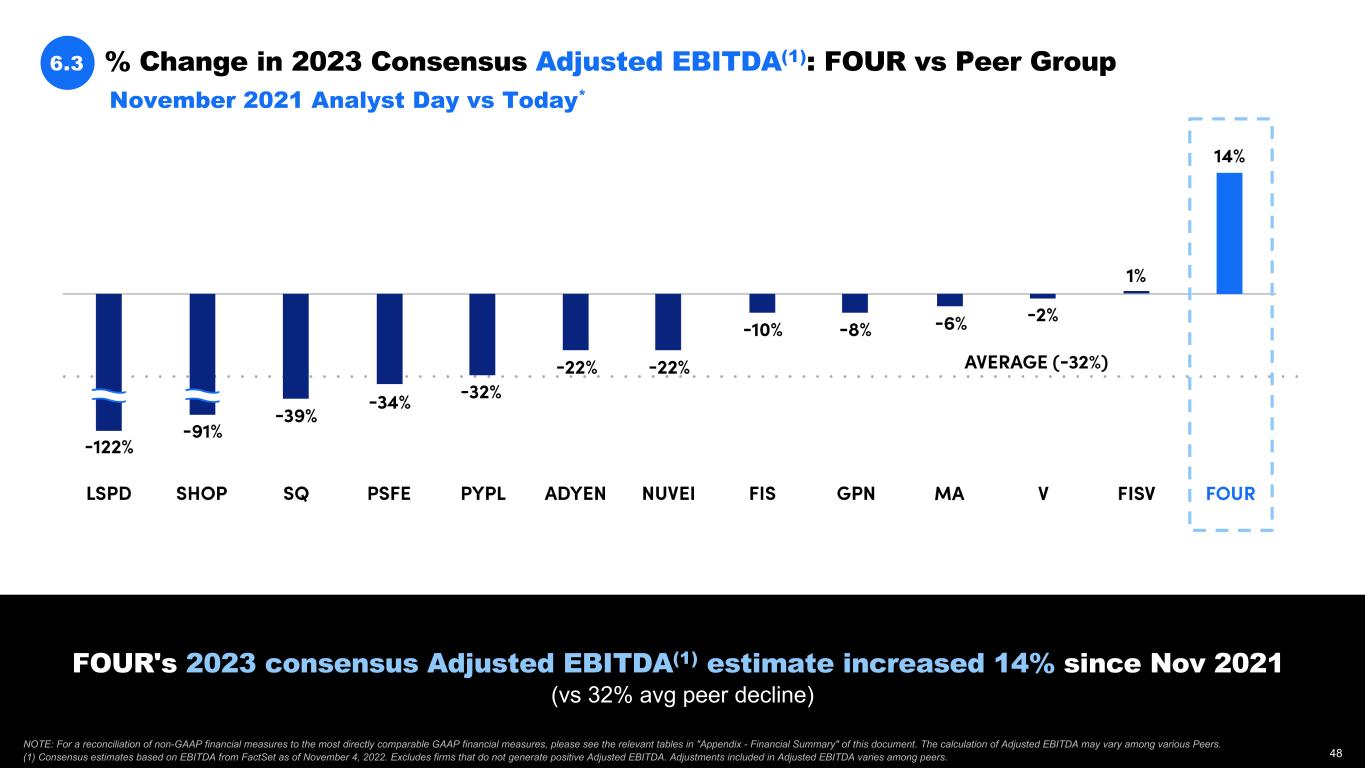
6.3 (1) Consensus estimates based on EBITDA from FactSet as of November 4, 2022. Excludes firms that do not generate positive Adjusted EBITDA. Adjustments included in Adjusted EBITDA varies among peers. FOUR's 2023 consensus Adjusted EBITDA(1) estimate increased 14% since Nov 2021 (vs 32% avg peer decline) % Change in 2023 Consensus Adjusted EBITDA(1): FOUR vs Peer Group November 2021 Analyst Day vs Today* NOTE: For a reconciliation of non-GAAP financial measures to the most directly comparable GAAP financial measures, please see the relevant tables in "Appendix - Financial Summary" of this document. The calculation of Adjusted EBITDA may vary among various Peers. 48
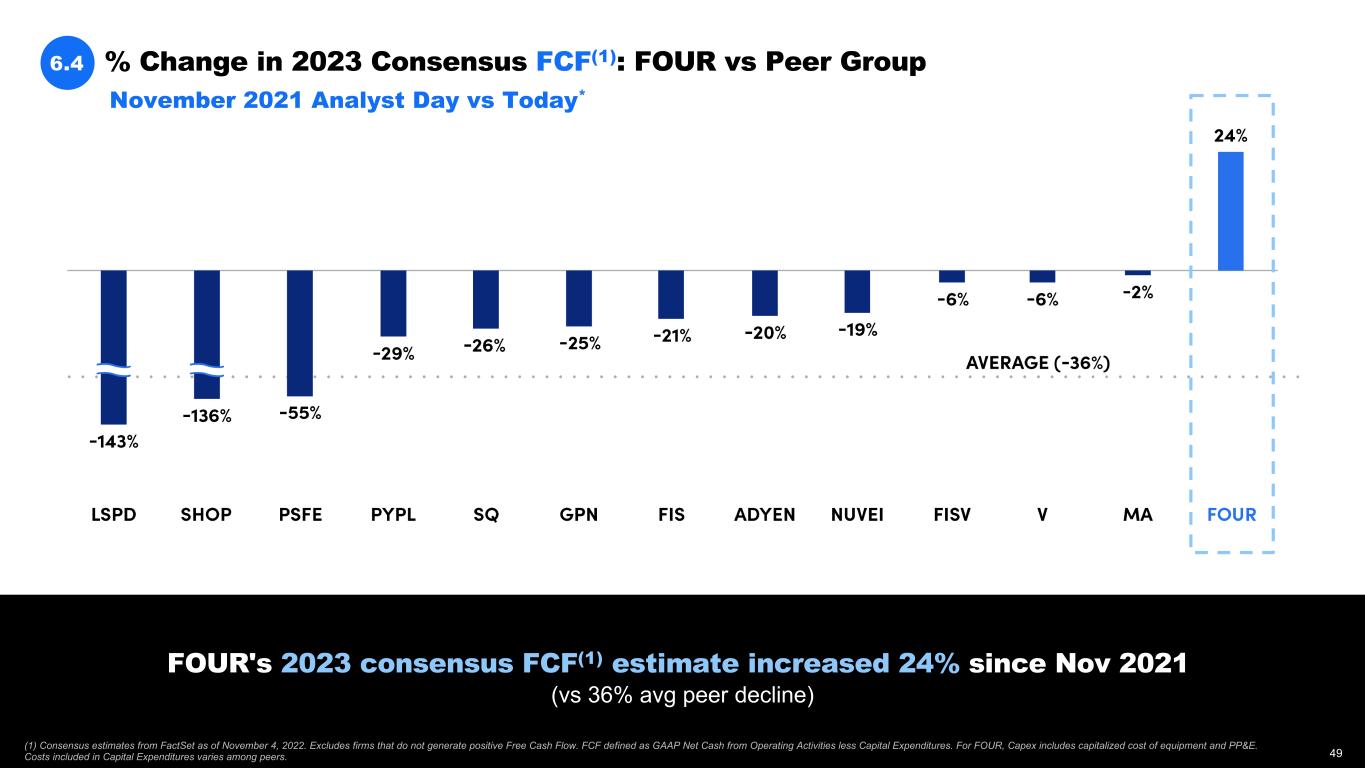
6.4 (1) Consensus estimates from FactSet as of November 4, 2022. Excludes firms that do not generate positive Free Cash Flow. FCF defined as GAAP Net Cash from Operating Activities less Capital Expenditures. For FOUR, Capex includes capitalized cost of equipment and PP&E. Costs included in Capital Expenditures varies among peers. FOUR's 2023 consensus FCF(1) estimate increased 24% since Nov 2021 (vs 36% avg peer decline) % Change in 2023 Consensus FCF(1): FOUR vs Peer Group November 2021 Analyst Day vs Today* 49
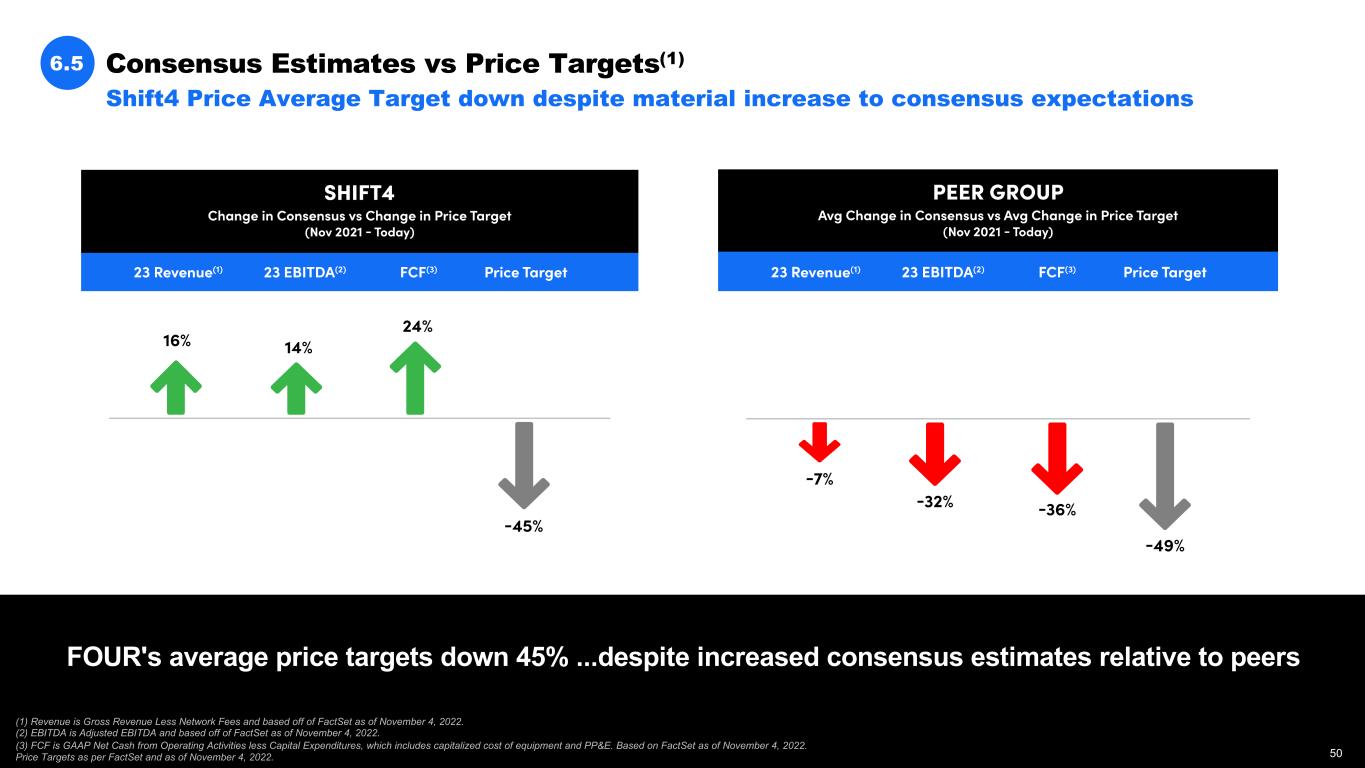
Consensus Estimates vs Price Targets(1)6.5 Shift4 Price Average Target down despite material increase to consensus expectations (1) Revenue is Gross Revenue Less Network Fees and based off of FactSet as of November 4, 2022. (2) EBITDA is Adjusted EBITDA and based off of FactSet as of November 4, 2022. (3) FCF is GAAP Net Cash from Operating Activities less Capital Expenditures, which includes capitalized cost of equipment and PP&E. Based on FactSet as of November 4, 2022. Price Targets as per FactSet and as of November 4, 2022. FOUR's average price targets down 45% ...despite increased consensus estimates relative to peers 50
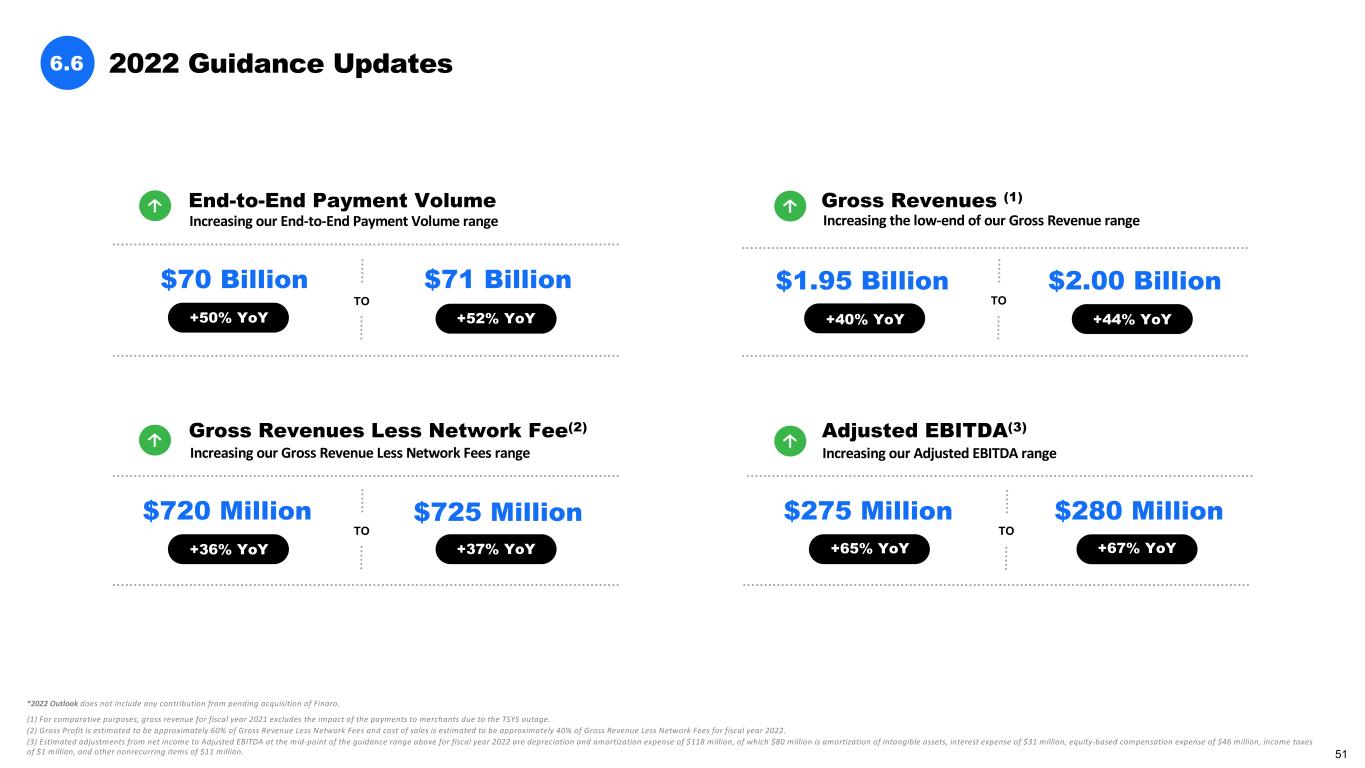
2022 Guidance Updates6.6 TOTO $70 Billion $71 Billion +50% YoY +52% YoY Increasing our End-to-End Payment Volume range $1.95 Billion $2.00 Billion Gross Revenues (1) +40% YoY +44% YoY Increasing the low-end of our Gross Revenue range $720 Million $725 Million Gross Revenues Less Network Fee(2) +36% YoY +37% YoY Increasing our Gross Revenue Less Network Fees range $275 Million $280 Million Adjusted EBITDA(3) +65% YoY +67% YoY Increasing our Adjusted EBITDA range End-to-End Payment Volume TOTO (1) For comparative purposes, gross revenue for fiscal year 2021 excludes the impact of the payments to merchants due to the TSYS outage. (2) Gross Profit is estimated to be approximately 60% of Gross Revenue Less Network Fees and cost of sales is estimated to be approximately 40% of Gross Revenue Less Network Fees for fiscal year 2022. (3) Estimated adjustments from net income to Adjusted EBITDA at the mid-point of the guidance range above for fiscal year 2022 are depreciation and amortization expense of $118 million, of which $80 million is amortization of intangible assets, interest expense of $31 million, equity-based compensation expense of $46 million, income taxes of $1 million, and other nonrecurring items of $11 million. *2022 Outlook does not include any contribution from pending acquisition of Finaro. 51
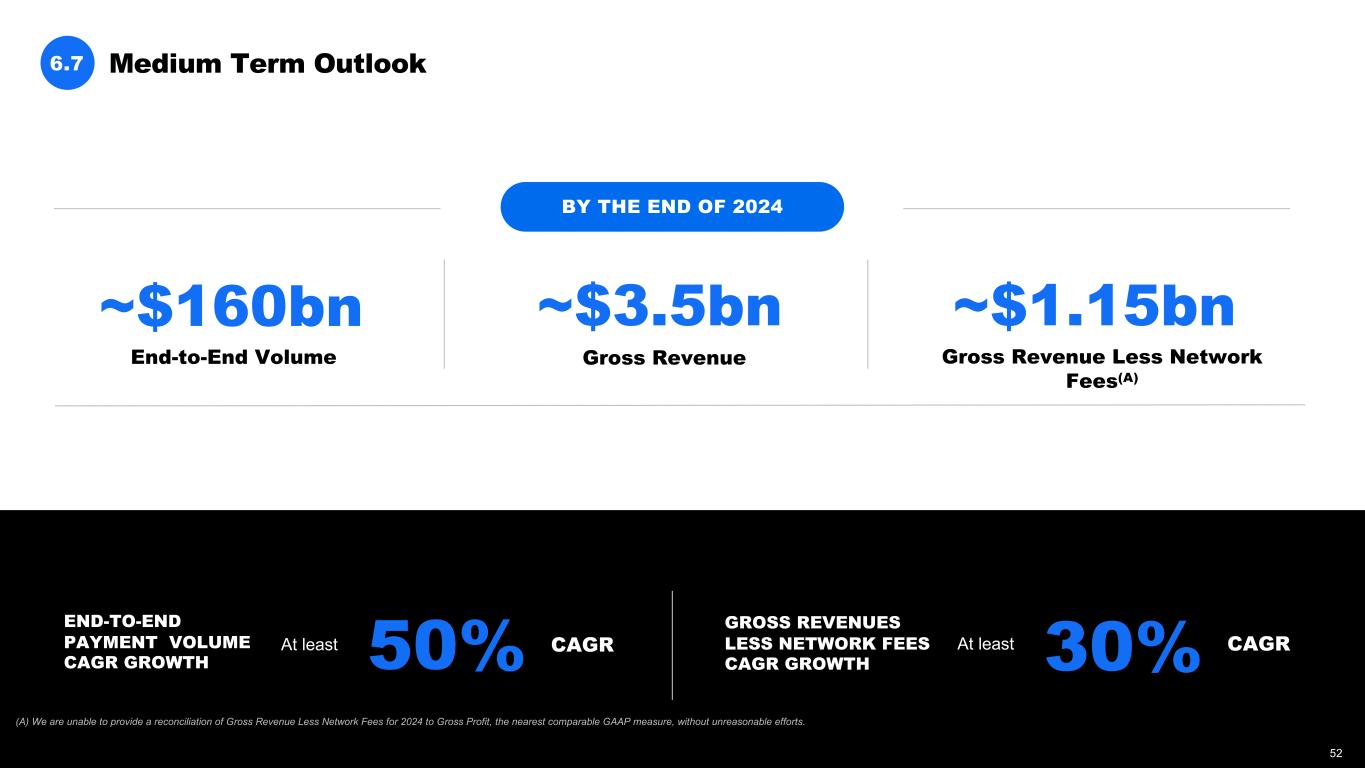
Medium Term Outlook6.7 ~$160bn End-to-End Volume ~$3.5bn Gross Revenue ~$1.15bn Gross Revenue Less Network Fees(A) BY THE END OF 2024 END-TO-END PAYMENT VOLUME CAGR GROWTH At least 50% CAGR GROSS REVENUES LESS NETWORK FEES CAGR GROWTH At least 30% CAGR 52 (A) We are unable to provide a reconciliation of Gross Revenue Less Network Fees for 2024 to Gross Profit, the nearest comparable GAAP measure, without unreasonable efforts.
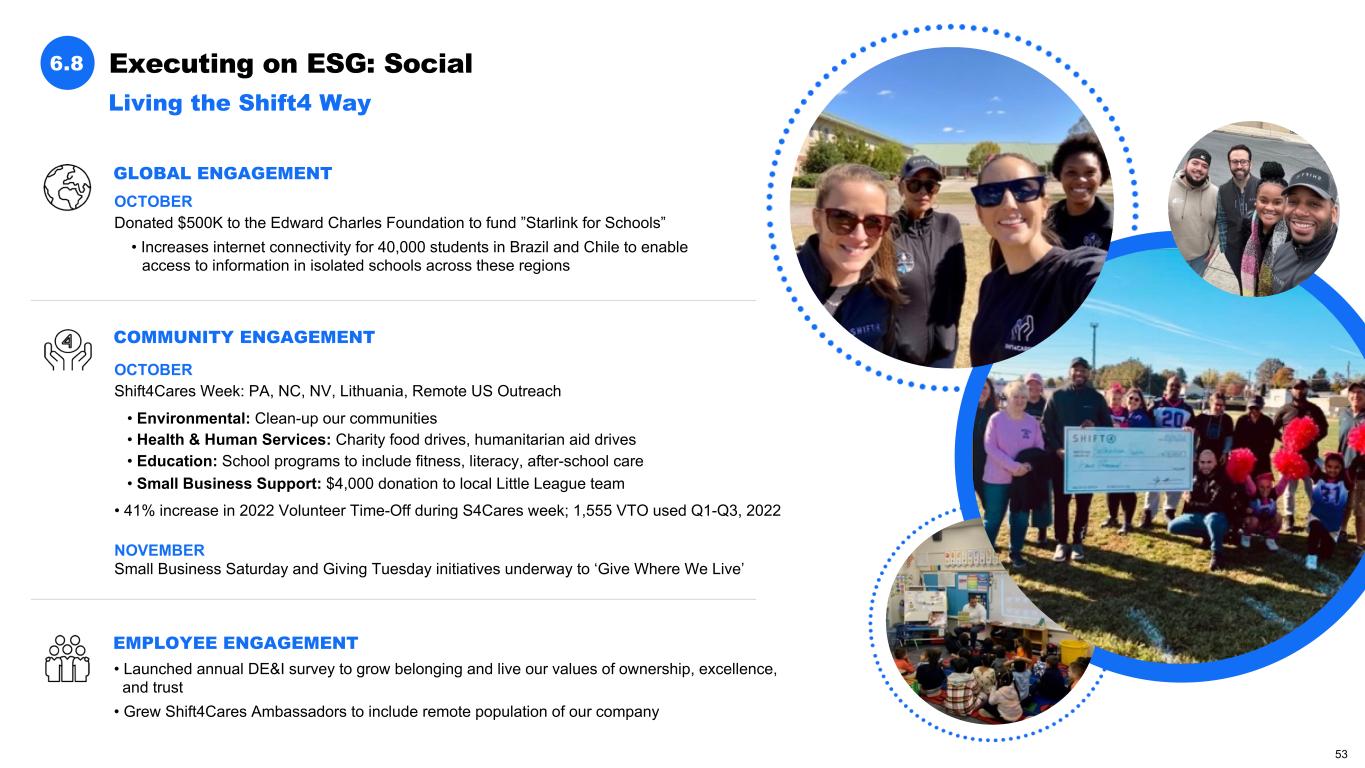
Executing on ESG: Social6.8 Living the Shift4 Way GLOBAL ENGAGEMENT OCTOBER Donated $500K to the Edward Charles Foundation to fund ”Starlink for Schools” • Increases internet connectivity for 40,000 students in Brazil and Chile to enable access to information in isolated schools across these regions COMMUNITY ENGAGEMENT EMPLOYEE ENGAGEMENT • Launched annual DE&I survey to grow belonging and live our values of ownership, excellence, and trust • Grew Shift4Cares Ambassadors to include remote population of our company OCTOBER Shift4Cares Week: PA, NC, NV, Lithuania, Remote US Outreach • Environmental: Clean-up our communities • Health & Human Services: Charity food drives, humanitarian aid drives • Education: School programs to include fitness, literacy, after-school care • Small Business Support: $4,000 donation to local Little League team • 41% increase in 2022 Volunteer Time-Off during S4Cares week; 1,555 VTO used Q1-Q3, 2022 NOVEMBER Small Business Saturday and Giving Tuesday initiatives underway to ‘Give Where We Live’ 53
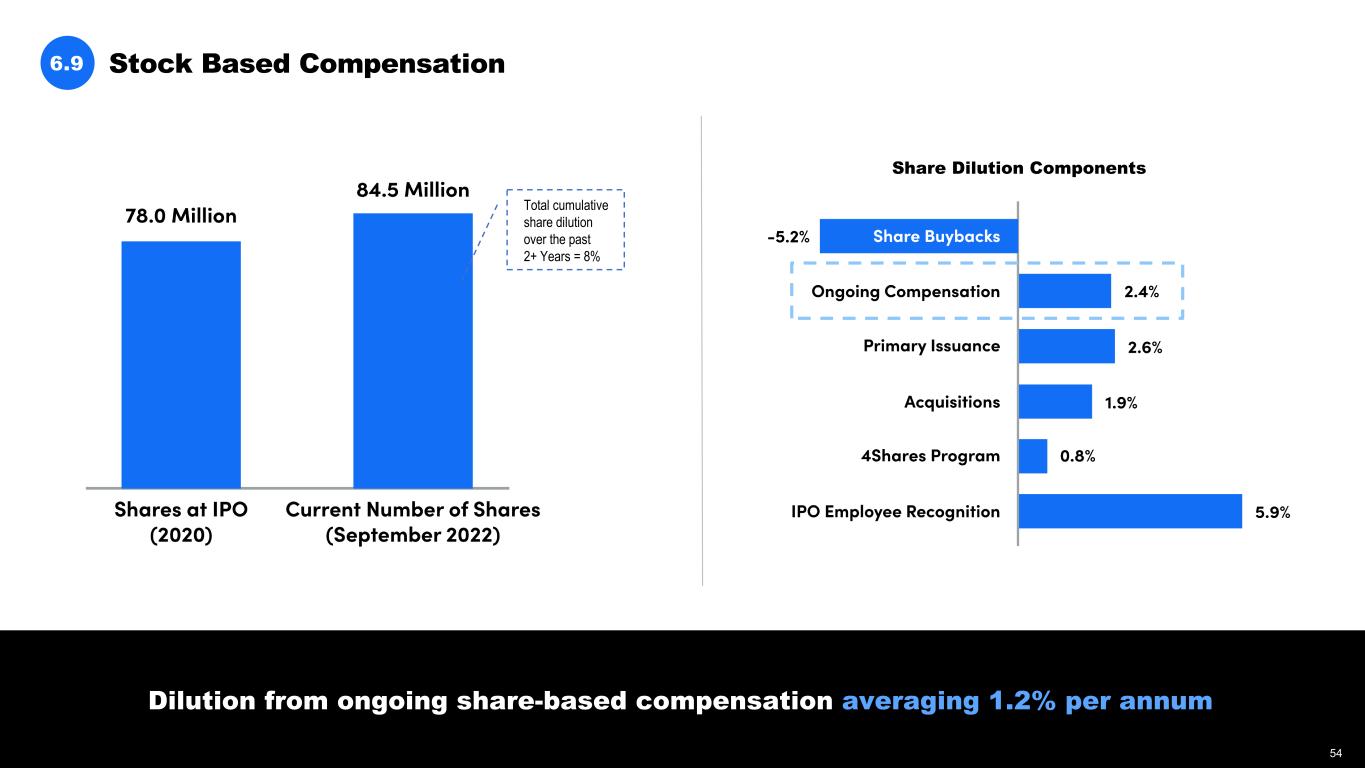
Stock Based Compensation6.9 Dilution from ongoing share-based compensation averaging 1.2% per annum Share Dilution Components Total cumulative share dilution over the past 2+ Years = 8% 54
Q&A 07 55
Appendix 08 56
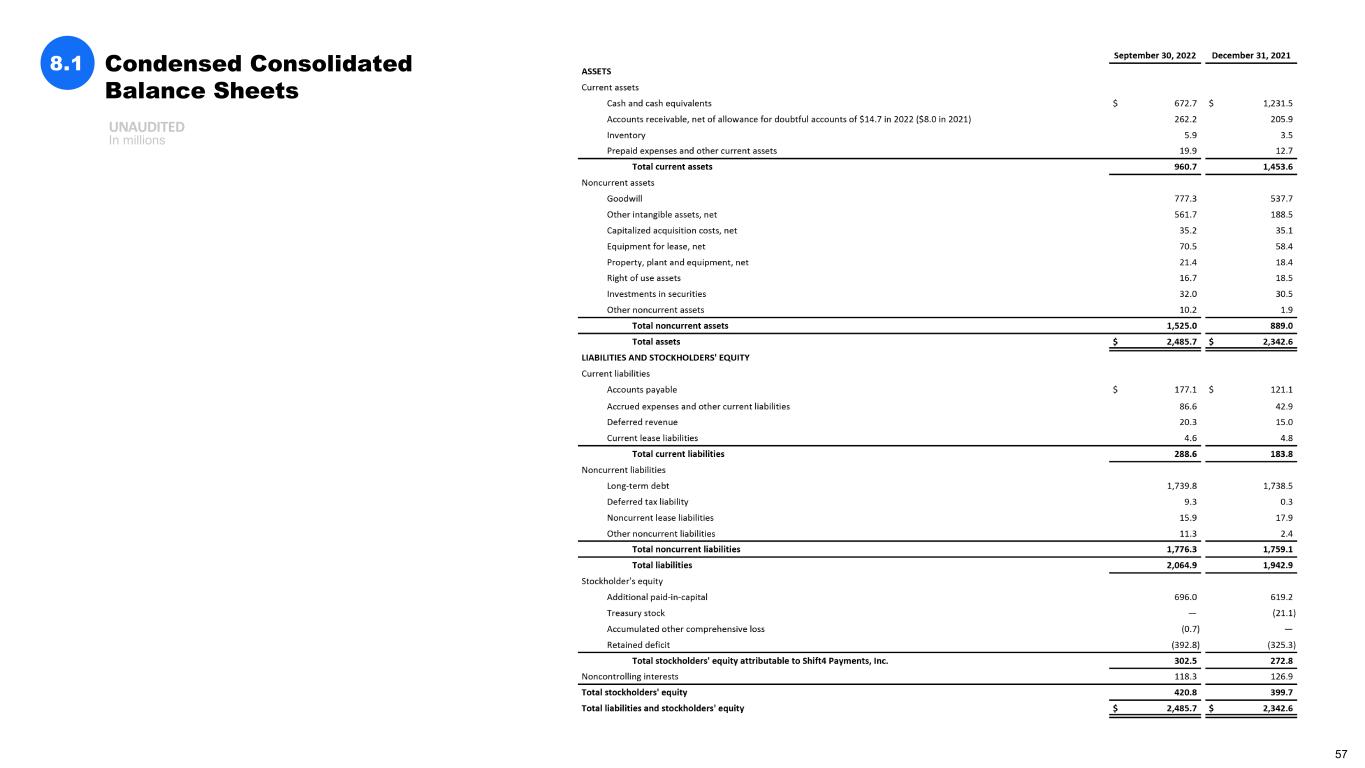
Condensed Consolidated Balance Sheets UNAUDITED In millions 8.1 57
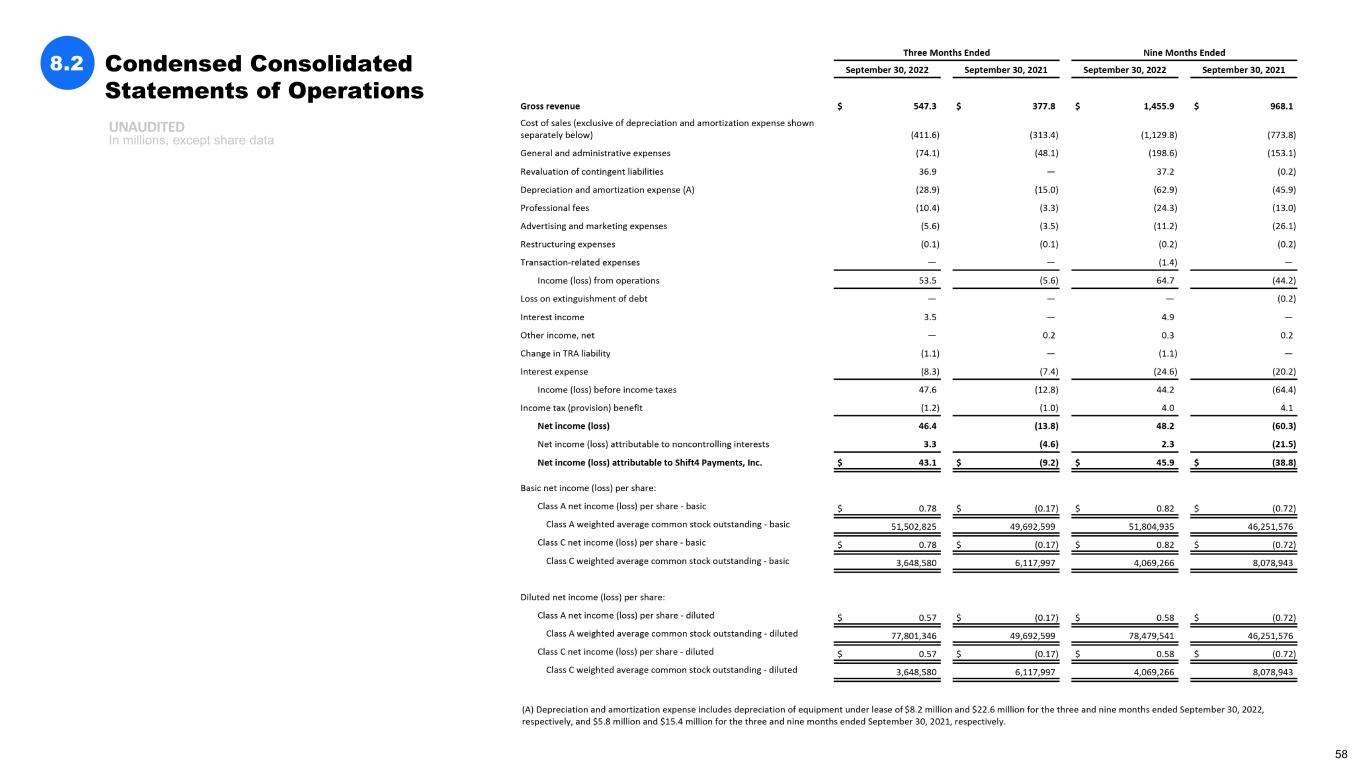
Condensed Consolidated Statements of Operations 8.2 UNAUDITED In millions, except share data 58
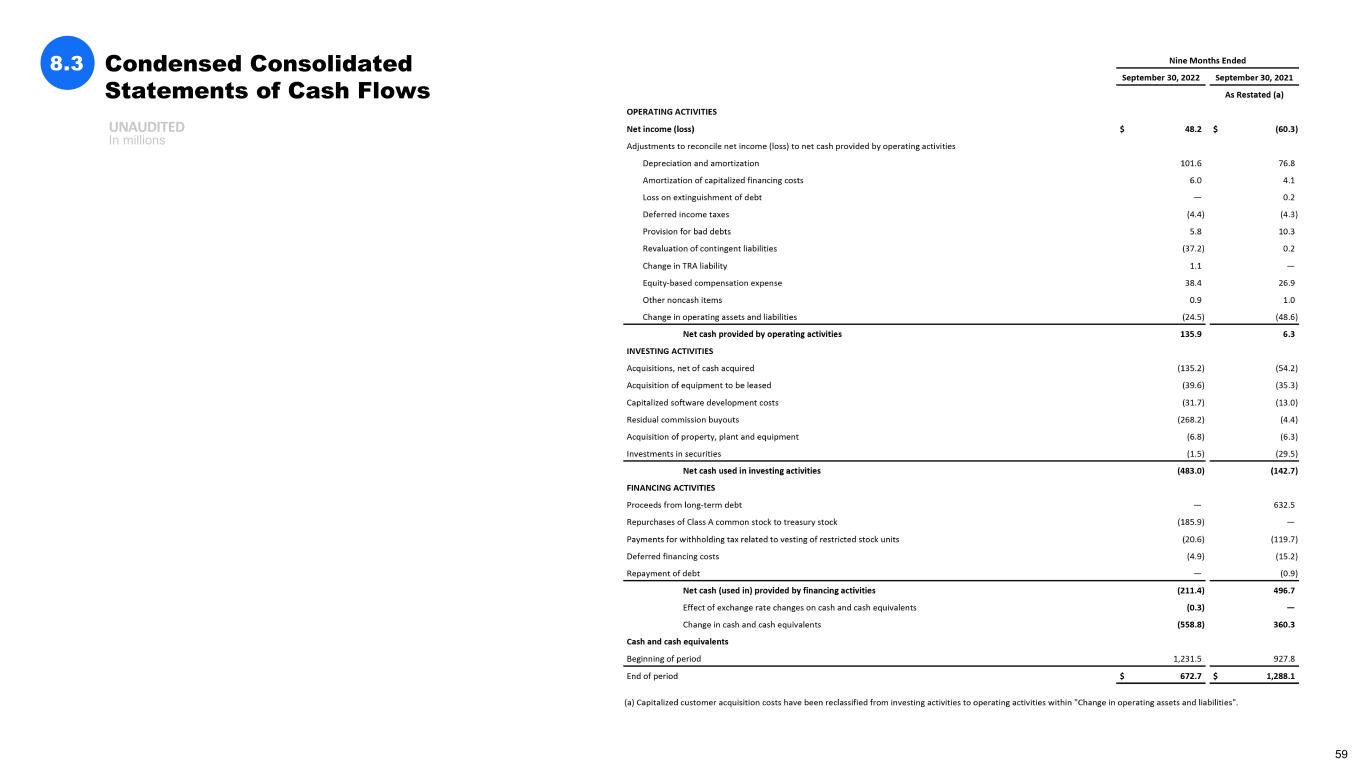
Condensed Consolidated Statements of Cash Flows 8.3 UNAUDITED In millions 59
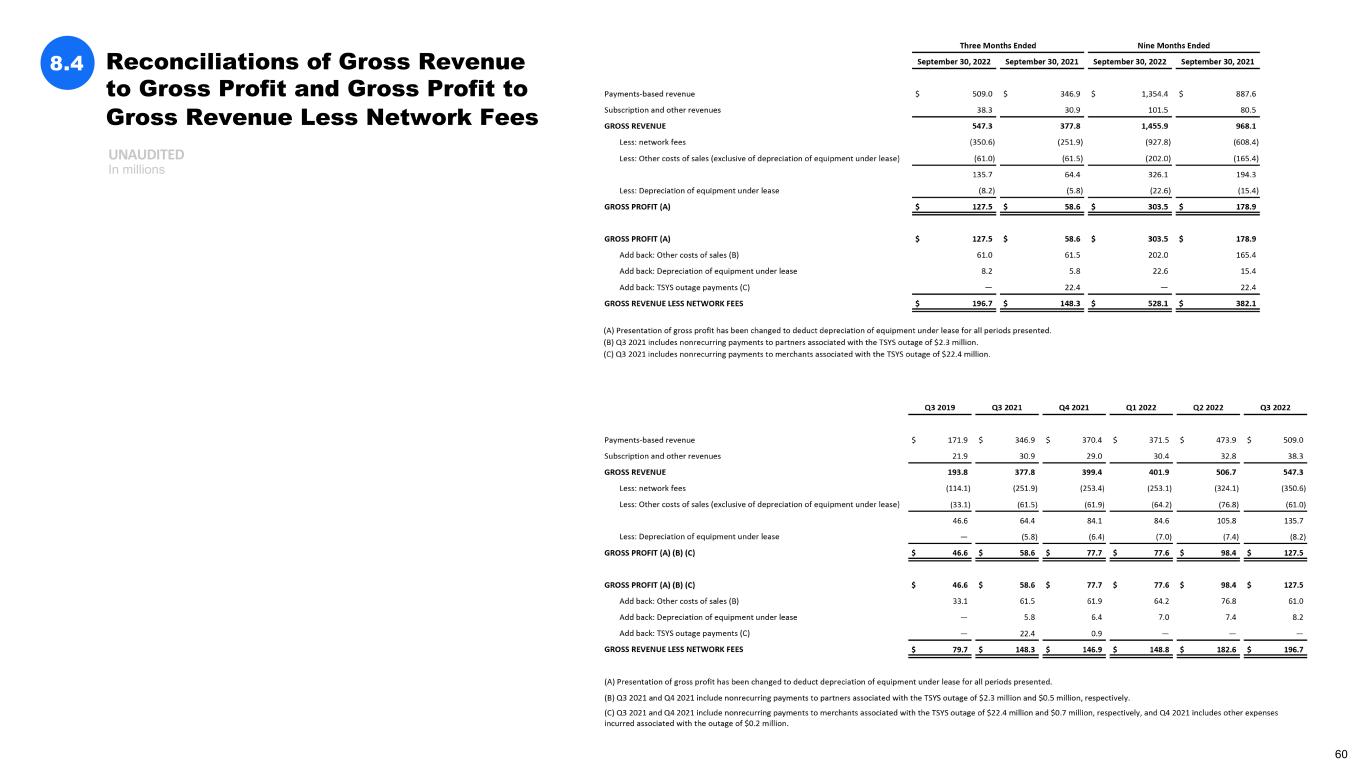
Reconciliations of Gross Revenue to Gross Profit and Gross Profit to Gross Revenue Less Network Fees UNAUDITED In millions 8.4 60
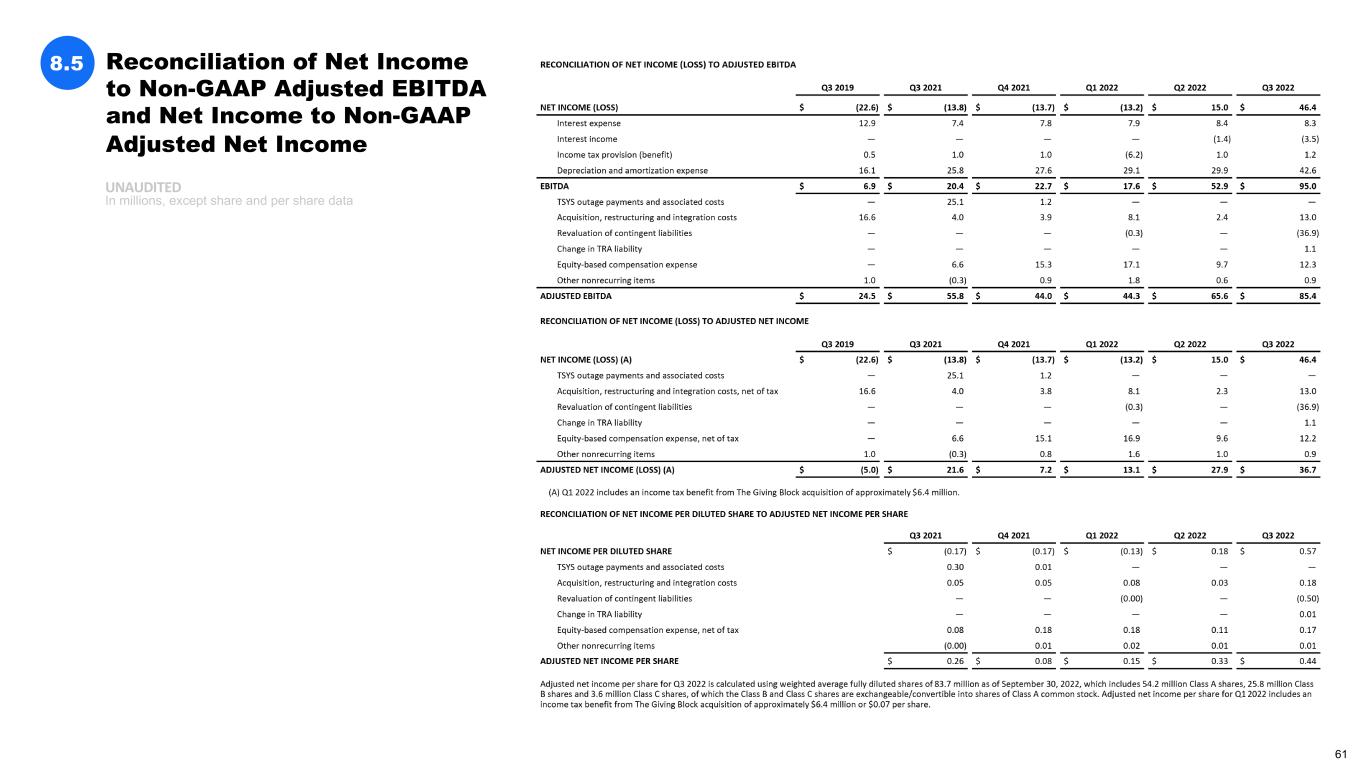
UNAUDITED In millions, except share and per share data 8.5 Reconciliation of Net Income to Non-GAAP Adjusted EBITDA and Net Income to Non-GAAP Adjusted Net Income 61
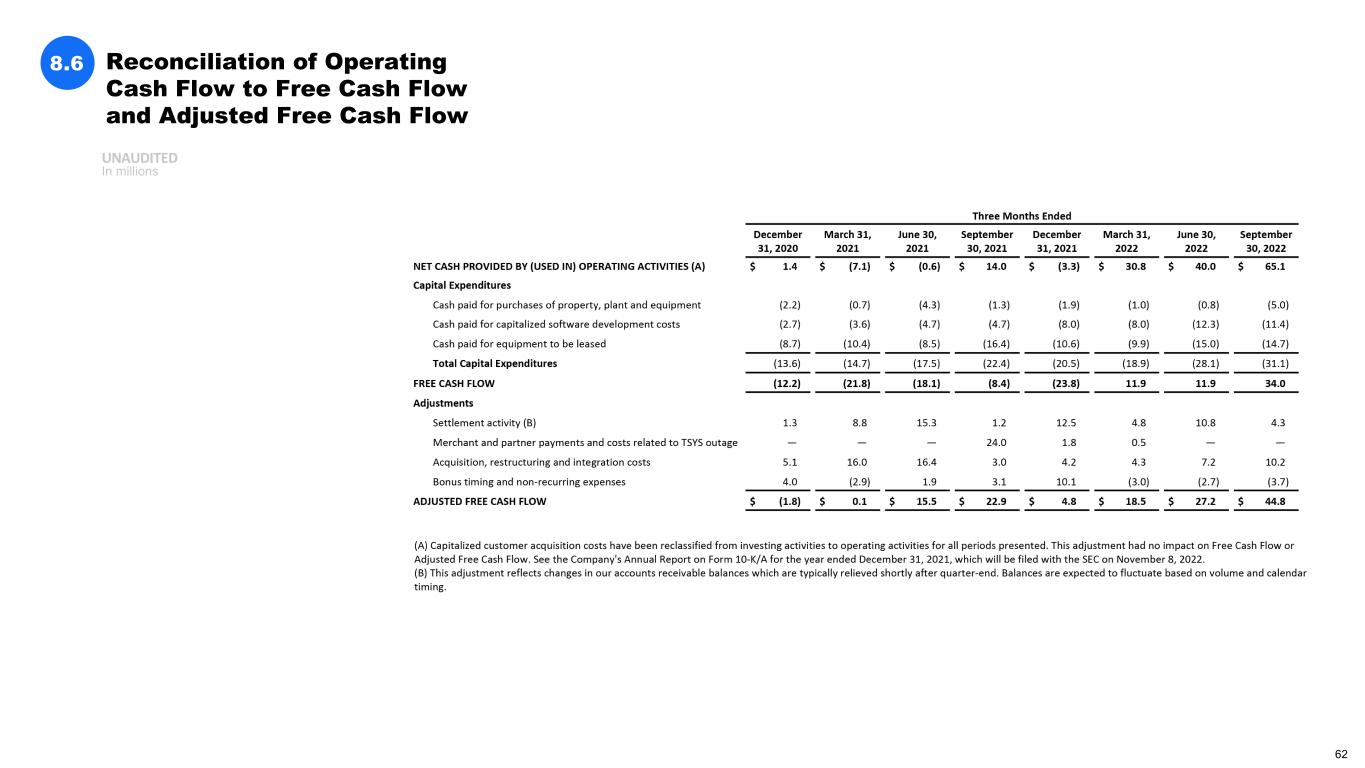
UNAUDITED In millions 8.6 Reconciliation of Operating Cash Flow to Free Cash Flow and Adjusted Free Cash Flow 62
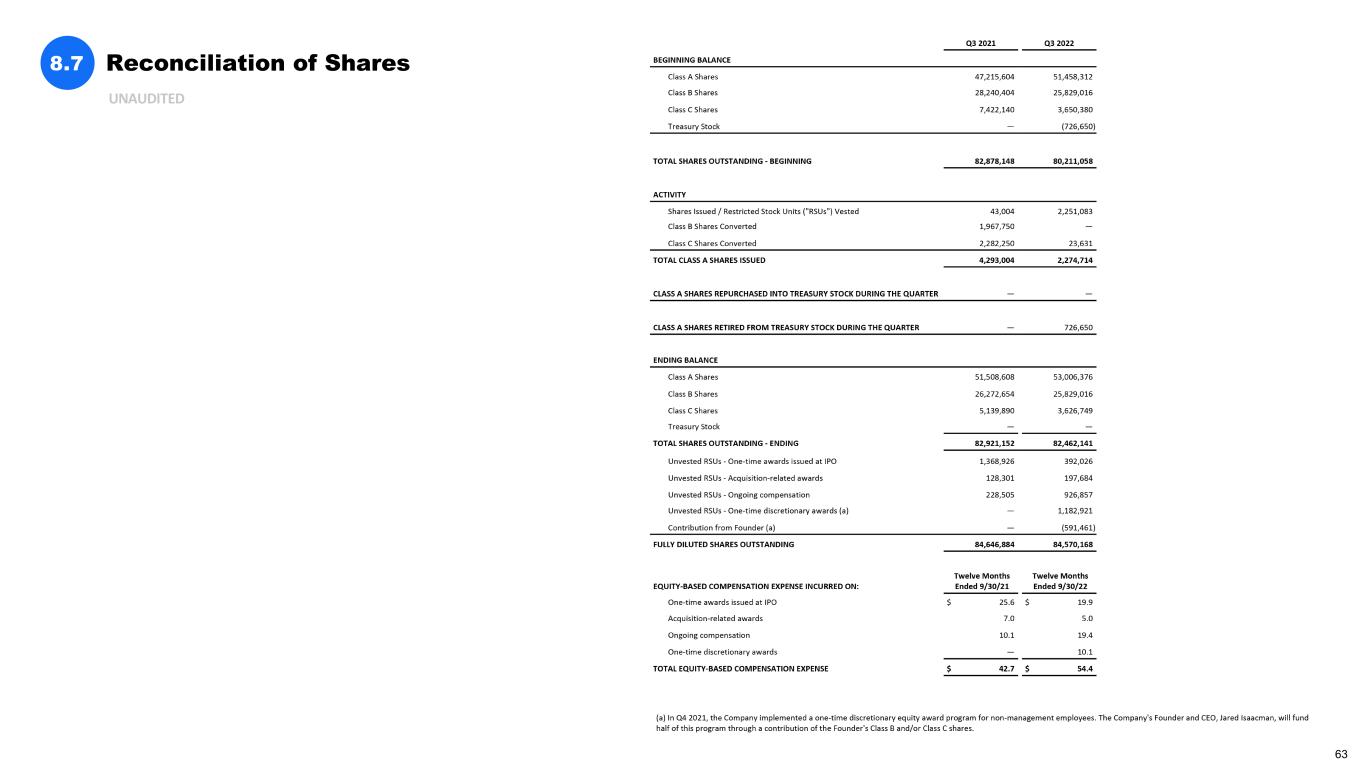
UNAUDITED 8.7 Reconciliation of Shares 63