
Q4 2022 SHAREHOLDER LETTER INVESTORS.SHIFT4.COM Exhibit 99.1
Non-GAAP Financial Measures and Key Performance Indicators Safe Harbor Statement and Forward-Looking Information We use supplemental measures of our performance which are derived from our consolidated financial information but which are not presented in our consolidated financial statements prepared in accordance with generally accepted accounting principles ("GAAP"). These non-GAAP financial measures include: gross revenue less network fees, which includes interchange and assessment fees; adjusted net income; adjusted net income per share; free cash flow; adjusted free cash flow; earnings before interest, income taxes, depreciation, and amortization (“EBITDA”); Adjusted EBITDA, Adjusted EBITDA conversion rate; and Adjusted EBITDA margin. Gross revenue less network fees represents a key performance metric that management uses to measure changes in the mix and value derived from our customer base as we continue to execute our strategy to expand our reach to serve larger, complex merchants. For the three months ended December 31, 2021, gross revenue less network fees excludes the impact of the payments to merchants, included in "Gross revenue," and payments to partners and associated expenses due to the TSYS outage, included in "Network fees" and "Other costs of sales" in our Consolidated Statements of Operations for the same period. These are nonrecurring payments that occurred outside of our day-to-day operations, and we have excluded them in order to provide more useful information to investors in the evaluation of our performance period-over period. Adjusted net income represents net income (loss) adjusted for certain non- cash and other nonrecurring items that management believes are not indicative of ongoing operations, such as the TSYS outage payments and associated costs, acquisition, restructuring and integration costs, revaluation of contingent liabilities, unrealized gain on investments in securities, change in TRA liability, equity-based compensation expense, and other nonrecurring items. Adjusted EBITDA is the primary financial performance measure used by management to evaluate its business and monitor results of operations. Adjusted EBITDA represents EBITDA further adjusted for certain non- cash and other nonrecurring items that management believes are not indicative of ongoing operations. This presentation contains forward-looking statements within the meaning of the Private Securities Litigation Reform Act of 1995. All statements contained in this presentation that do not relate to matters of historical fact should be considered forward-looking statements, including statements regarding Shift4 Payments, Inc.’s (“our”, the “Company” or "Shift4”) expectations regarding new customers; acquisitions and other transactions, including of our sales partners and their residual streams, and our ability to close said transactions on the timeline we expect or at all; our plans and agreements regarding future payment processing commitments; our expectations with respect to economic recovery; our stock price; and anticipated financial performance,including our financial outlook for fiscal year 2023 and future periods. These statements are neither promises nor guarantees, but involve known and unknown risks, uncertainties and other important factors that may cause our actual results, performance or achievements to be materially different from any future results, performance or achievements expressed or implied by the forward-looking statements, including, but not limited to, the following: our ability to differentiate ourselves from our competitors and compete effectively; our ability to anticipate and respond to changing industry trends and merchant and consumer needs; our ability to continue making acquisitions of businesses or assets; our ability to continue to expand our market share or expand These adjustments include TSYS outage payments and associated costs, acquisition, restructuring and integration costs, revaluation of contingent liabilities, unrealized gain on investments in securities, change in TRA liability, equity-based compensation expense, and other nonrecurring items. Free cash flow represents net cash provided by operating activities adjusted for non-discretionary capital expenditures. Adjusted free cash flow represents free cash flow further adjusted for certain transactions that are not indicative of future operating cash flows, including settlement activity, which represents the change in our settlement obligation, which fluctuated based on volumes and calendar timing, payments and costs associated with the TSYS outage, acquisition, restructuring and integration costs, the impact of timing of annual performance bonuses, and other nonrecurring expenses that are not indicative of ongoing activities. We believe adjusted free cash flow is useful to measure the funds generated in a given period that are available to invest in the business, to repurchase stock and to make strategic decisions. We believe this supplemental information enhances shareholders’ ability to evaluate the Company’s performance. The Adjusted EBITDA conversion rate is calculated as Adjusted Free Cash Flow divided by Adjusted EBITDA. We use non-GAAP financial measures to supplement financial information presented on a GAAP basis. We believe that excluding certain items from our GAAP results allows management to better understand our consolidated financial performance from period to period and better project our future consolidated financial performance as forecasts are developed at a level of detail different from that used to prepare GAAP-based financial measures. Moreover, we believe these non-GAAP financial measures provide our stakeholders with useful information to help them evaluate our operating results by facilitating an enhanced understanding of our operating performance and enabling them to make more meaningful period to period comparisons. There are limitations to the use of the non-GAAP financial measures presented in this presentation. Our non-GAAP financial measures may not be comparable to similarly titled measures of other companies. Other companies, including companies in our industry, may calculate non- GAAP financial measures differently than we do, into new markets; our reliance on third-party vendors to provide products and services; our ability to integrate our services and products with operating systems, devices, software and web browsers; our ability to maintain merchant and software partner relationships and strategic partnerships; the effects of global economic, political and other conditions, including inflationary pressure and rising interest rates, on consumer, business and government spending; the effect of the COVID-19 global pandemic and any variants of the virus on our business and results of operations; our compliance with governmental regulation and other legal obligations, particularly related to privacy, data protection and information security, and consumer protection laws; our ability to establish, maintain and enforce effective risk management policies and procedures; our ability to protect our systems and data from continually evolving cybersecurity risks, security breaches and other technological risks; potential harm caused by software defects, computer viruses and development delays; the effect of degradation of the quality of the products and services we offer; potential harm caused by increased customer attrition; potential harm caused by fraud by merchants or others; potential harm caused by damage to our reputation or brands; our ability to recruit, retain and develop qualified personnel; our reliance on a single or limited number of suppliers; the effects of seasonality and volatility on our operating results; the effect of various legal limiting the usefulness of those measures for comparative purposes. The non-GAAP financial measures are not meant to be considered as indicators of performance in isolation from or as a substitute for net income (loss) prepared in accordance with GAAP, and should be read only in conjunction with financial information presented on a GAAP basis. Reconciliations each of EBITDA and Adjusted EBITDA, gross revenue less network fees, adjusted net income, adjusted net income per share, free cash flow and adjusted free cash flow to its most directly comparable GAAP financial measure are presented in Appendix - Financial Information. We are unable to provide a reconciliation of Adjusted Free Cash Flow for 2023 to net cash provided by operating activities, the nearest comparable GAAP measure, without unreasonable efforts. We encourage you to review the reconciliations in conjunction with the presentation of the non-GAAP financial measures for each of the periods presented. In future fiscal periods, we may exclude such items and may incur income and expenses similar to these excluded items. In addition, key performance indicators include end-to-end payment volume, spread and margin. End-to-end payment volume is defined as the total dollar amount of payments that we deliver for settlement on behalf of our merchants. Included in end-to-end volume are dollars routed via our international payments platform and alternative payment methods, including cryptocurrency donations, plus volume we route to one or more third party merchant acquirers on behalf of strategic enterprise merchant relationships, translated to U.S. dollars. This volume does not include volume processed through our legacy gateway-only offering. Spread represents the average yield Shift4 earns on the average end-to-end payment volume processed for a given period after network fees. Spread is calculated as payments-based revenue less gateway revenue and network fees for a given period divided by the end-to-end payment volume processed for the similar period. Adjusted EBITDA Margin represents Adjusted EBITDA divided by gross revenue less network fees. proceedings; our ability to raise additional capital to fund our operations; our ability to protect, enforce and defend our intellectual property rights; our ability to establish and maintain effective internal control over financial reporting and disclosure controls and procedures; our compliance with laws, regulations and enforcement activities that affect our industry; our dependence on distributions from Shift4 Payments, LLC to pay our taxes and expenses, including payments under the Tax Receivable Agreement; the significant influence Rook has over us, including control over decisions that require the approval of stockholders; and the impact of existing and future material weaknesses in our internal control over financial reporting. These and other important factors are described in “Cautionary Note Regarding Forward-Looking Statements” and “Risk Factors” in Part I, Item 1A. in our Annual Report on Form 10-K for the year ended December 31, 2022, and could cause actual results to differ materially from those indicated by the forward-looking statements made in this presentation. Any such forward-looking statements represent management’s estimates as of the date of this presentation. While we may elect to update such forward-looking statements at some point in the future, we disclaim any obligation to do so, even if subsequent events cause our views to change. 2
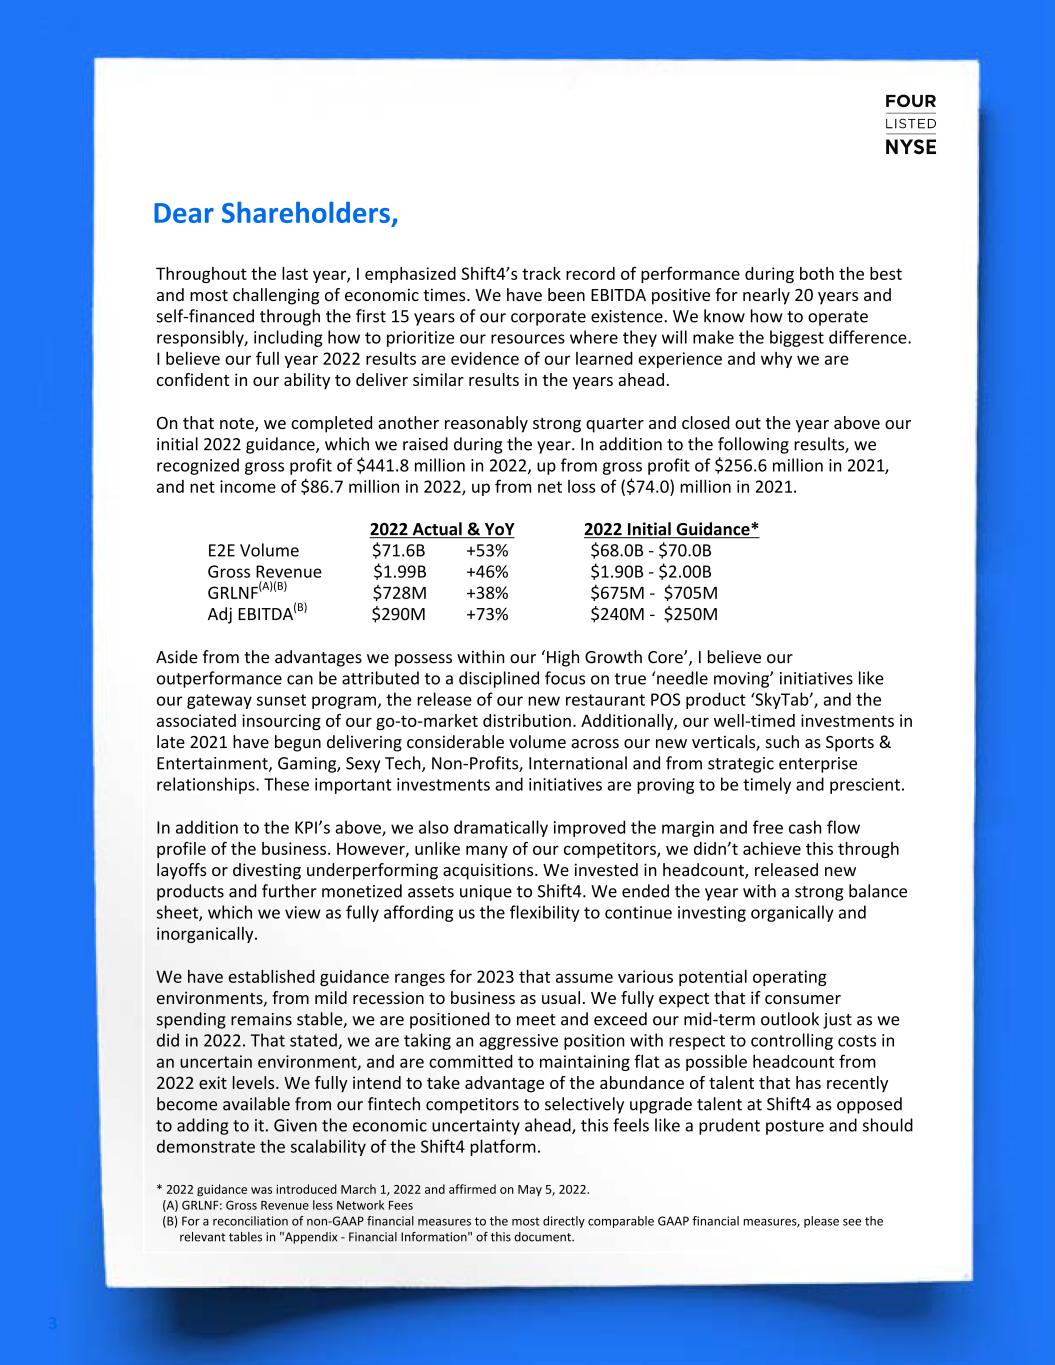
Dear Shareholders, 3 Throughout the last year, I emphasized Shift4’s track record of performance during both the best and most challenging of economic times. We have been EBITDA positive for nearly 20 years and self-financed through the first 15 years of our corporate existence. We know how to operate responsibly, including how to prioritize our resources where they will make the biggest difference. I believe our full year 2022 results are evidence of our learned experience and why we are confident in our ability to deliver similar results in the years ahead. On that note, we completed another reasonably strong quarter and closed out the year above our initial 2022 guidance, which we raised during the year. In addition to the following results, we recognized gross profit of $441.8 million in 2022, up from gross profit of $256.6 million in 2021, and net income of $86.7 million in 2022, up from net loss of ($74.0) million in 2021. 2022 Actual & YoY 2022 Initial Guidance* E2E Volume $71.6B +53% $68.0B - $70.0B Gross Revenue $1.99B +46% $1.90B - $2.00B GRLNF(A)(B) $728M +38% $675M - $705M Adj EBITDA(B) $290M +73% $240M - $250M Aside from the advantages we possess within our ‘High Growth Core’, I believe our outperformance can be attributed to a disciplined focus on true ‘needle moving’ initiatives like our gateway sunset program, the release of our new restaurant POS product ‘SkyTab’, and the associated insourcing of our go-to-market distribution. Additionally, our well-timed investments in late 2021 have begun delivering considerable volume across our new verticals, such as Sports & Entertainment, Gaming, Sexy Tech, Non-Profits, International and from strategic enterprise relationships. These important investments and initiatives are proving to be timely and prescient. In addition to the KPI’s above, we also dramatically improved the margin and free cash flow profile of the business. However, unlike many of our competitors, we didn’t achieve this through layoffs or divesting underperforming acquisitions. We invested in headcount, released new products and further monetized assets unique to Shift4. We ended the year with a strong balance sheet, which we view as fully affording us the flexibility to continue investing organically and inorganically. We have established guidance ranges for 2023 that assume various potential operating environments, from mild recession to business as usual. We fully expect that if consumer spending remains stable, we are positioned to meet and exceed our mid-term outlook just as we did in 2022. That stated, we are taking an aggressive position with respect to controlling costs in an uncertain environment, and are committed to maintaining flat as possible headcount from 2022 exit levels. We fully intend to take advantage of the abundance of talent that has recently become available from our fintech competitors to selectively upgrade talent at Shift4 as opposed to adding to it. Given the economic uncertainty ahead, this feels like a prudent posture and should demonstrate the scalability of the Shift4 platform. * 2022 guidance was introduced March 1, 2022 and affirmed on May 5, 2022. (A) GRLNF: Gross Revenue less Network Fees (B) For a reconciliation of non-GAAP financial measures to the most directly comparable GAAP financial measures, please see the relevant tables in "Appendix - Financial Information" of this document.
4 Jared Isaacman CEO jared@shift4.com The success Shift4 enjoys today is the result of our early entry into the world of integrated payments. As a reminder, integrated payments are what we call the convergence of commerce- enabling software and payments. It is what has made us a leader in restaurants, hotels, complex retail, stadiums and entertainment venues, online gaming and more. The next evolution of our industry, integrated payments 3.0, is delivering those same capabilities to merchants all over the world. While we might not be the first this time, we are well on our way. We have a strategic enterprise relationship that we intend to support globally through a combination of organic and inorganic initiatives. I expect 2023 to represent a year of immense progress towards our global expansion goals, made possible by our stable high growth core and continued expansion across all of our new verticals. I would like to close by thanking the Shift4 team for all their hard work and dedication. We delivered incredible results during a very difficult time and it is apparent that the ‘Shift4 Way’ is just beginning to unlock our full potential. As always, I welcome all your feedback, including business opportunities, areas of improvement and general suggestions. Please don’t hesitate to contact me directly.
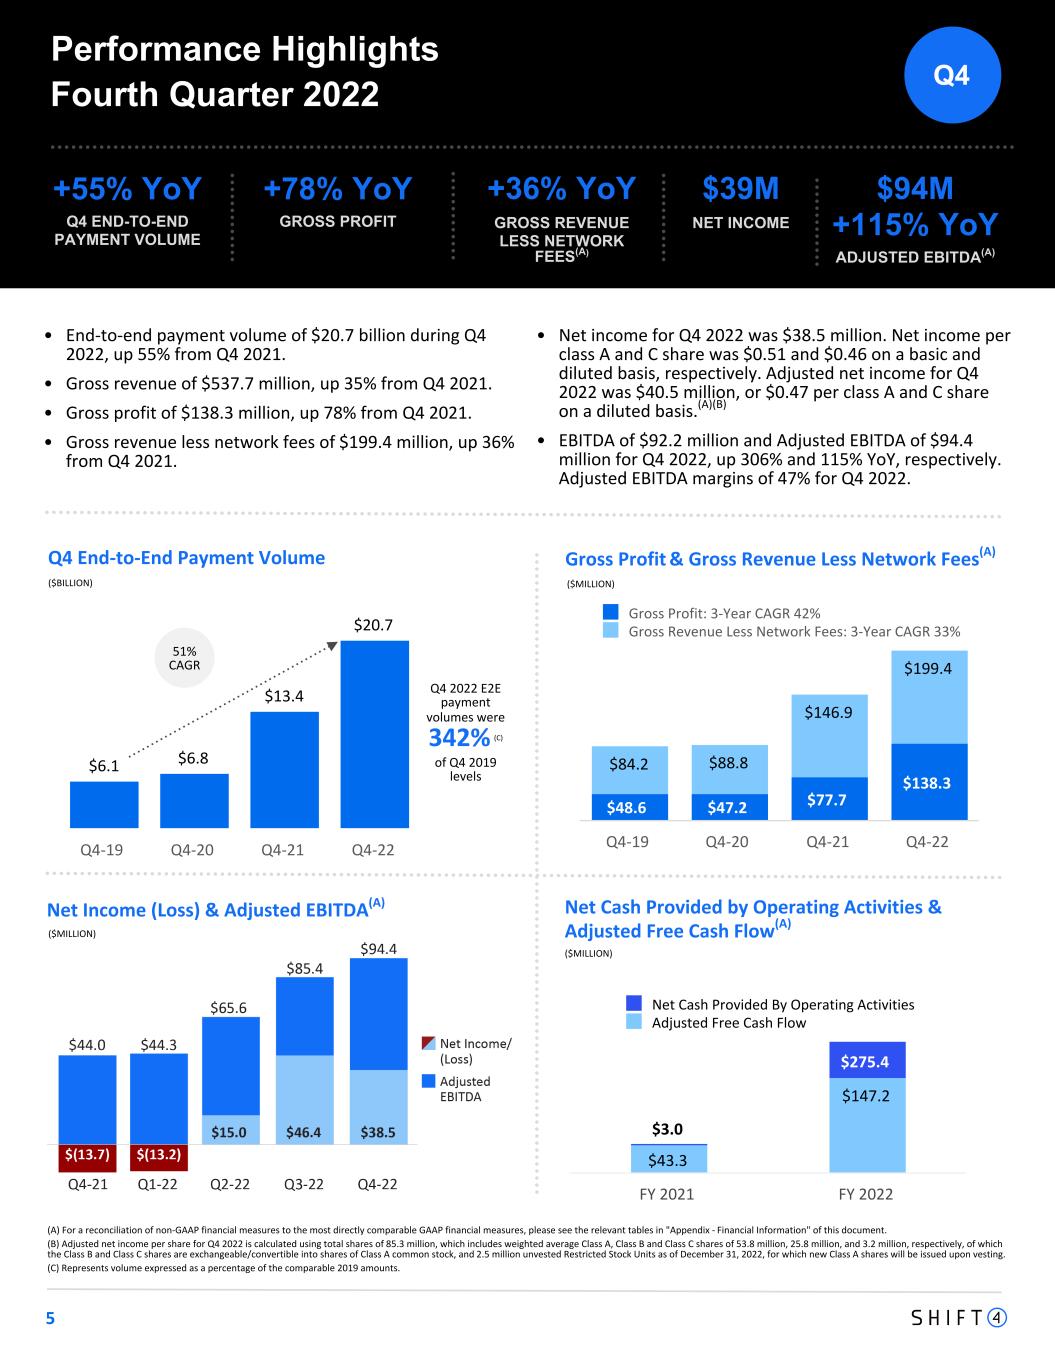
Q4 2022 E2E payment volumes were 342% (C) of Q4 2019 levels $6.1 $6.8 $13.4 $20.7 Q4-19 Q4-20 Q4-21 Q4-22 (A) For a reconciliation of non-GAAP financial measures to the most directly comparable GAAP financial measures, please see the relevant tables in "Appendix - Financial Information" of this document. (B) Adjusted net income per share for Q4 2022 is calculated using total shares of 85.3 million, which includes weighted average Class A, Class B and Class C shares of 53.8 million, 25.8 million, and 3.2 million, respectively, of which the Class B and Class C shares are exchangeable/convertible into shares of Class A common stock, and 2.5 million unvested Restricted Stock Units as of December 31, 2022, for which new Class A shares will be issued upon vesting. (C) Represents volume expressed as a percentage of the comparable 2019 amounts. 5 Q4 End-to-End Payment Volume Gross Profit & Gross Revenue Less Network Fees(A) ($BILLION) Fourth Quarter 2022 +55% YoY Q4 END-TO-END PAYMENT VOLUME Performance Highlights $48.6 $47.2 $77.7 $138.3 $84.2 $88.8 $146.9 $199.4 Gross Profit: 3-Year CAGR 42% Gross Revenue Less Network Fees: 3-Year CAGR 33% Q4-19 Q4-20 Q4-21 Q4-22 51% CAGR Net Income (Loss) & Adjusted EBITDA(A) $43.3 $147.2 $3.0 $275.4 Net Cash Provided By Operating Activities Adjusted Free Cash Flow FY 2021 FY 2022 Net Cash Provided by Operating Activities & Adjusted Free Cash Flow(A) ($MILLION) ($MILLION) ($MILLION) +78% YoY GROSS PROFIT $39M NET INCOME • $94M +115% YoY ADJUSTED EBITDA(A) +36% YoY GROSS REVENUE LESS NETWORK FEES(A) • End-to-end payment volume of $20.7 billion during Q4 2022, up 55% from Q4 2021. • Gross revenue of $537.7 million, up 35% from Q4 2021. • Gross profit of $138.3 million, up 78% from Q4 2021. • Gross revenue less network fees of $199.4 million, up 36% from Q4 2021. • Net income for Q4 2022 was $38.5 million. Net income per class A and C share was $0.51 and $0.46 on a basic and diluted basis, respectively. Adjusted net income for Q4 2022 was $40.5 million, or $0.47 per class A and C share on a diluted basis.(A)(B) • EBITDA of $92.2 million and Adjusted EBITDA of $94.4 million for Q4 2022, up 306% and 115% YoY, respectively. Adjusted EBITDA margins of 47% for Q4 2022. Q4
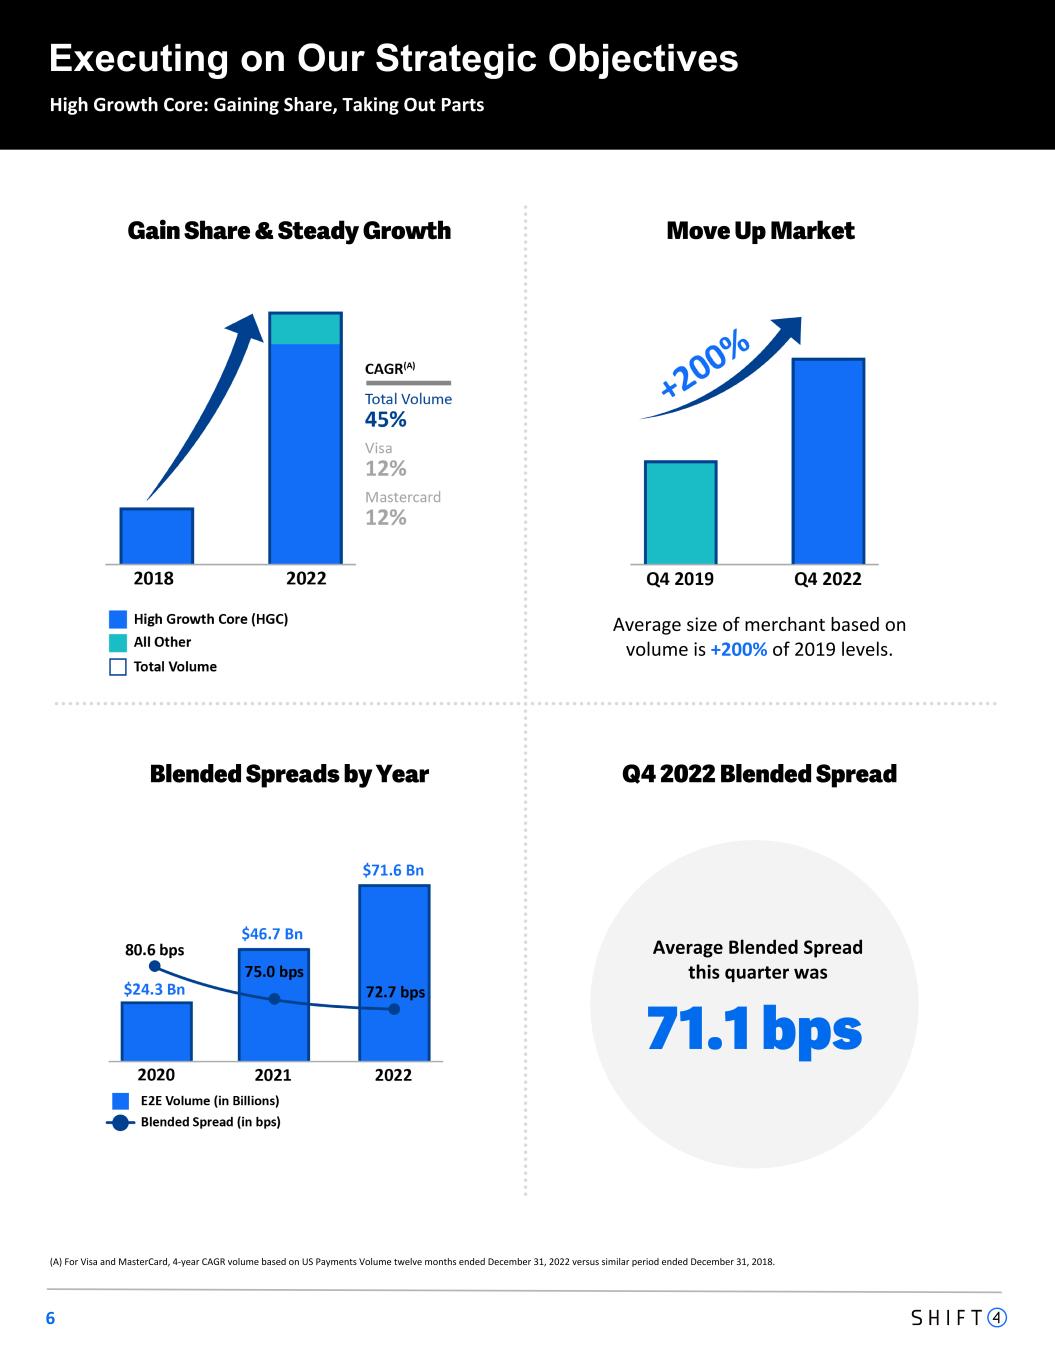
6 Blended Spreads by Year Average size of merchant based on volume is +200% of 2019 levels. Gain Share & Steady Growth Move Up Market High Growth Core: Gaining Share, Taking Out Parts Executing on Our Strategic Objectives (A) For Visa and MasterCard, 4-year CAGR volume based on US Payments Volume twelve months ended December 31, 2022 versus similar period ended December 31, 2018. Average Blended Spread this quarter was 71.1 bps Q4 2022 Blended Spread
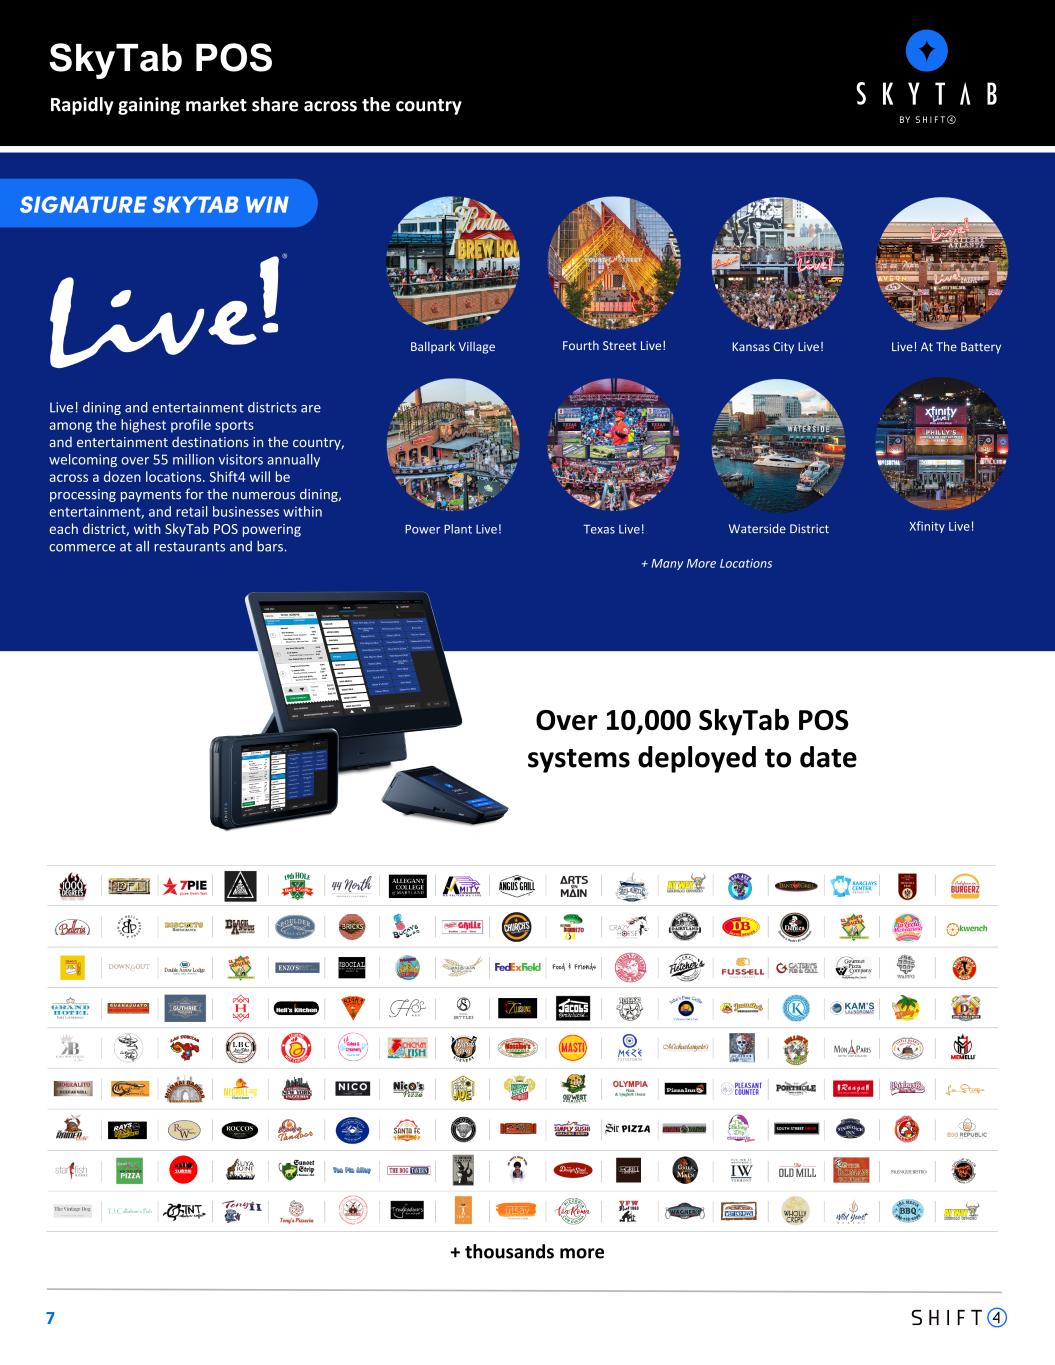
7 SkyTab POS Rapidly gaining market share across the country Live! dining and entertainment districts are among the highest profile sports and entertainment destinations in the country, welcoming over 55 million visitors annually across a dozen locations. Shift4 will be processing payments for the numerous dining, entertainment, and retail businesses within each district, with SkyTab POS powering commerce at all restaurants and bars. Over 10,000 SkyTab POS systems deployed to date Ballpark Village Waterside District Live! At The BatteryKansas City Live!Fourth Street Live! Xfinity Live!Power Plant Live! Texas Live! + Many More Locations + thousands more
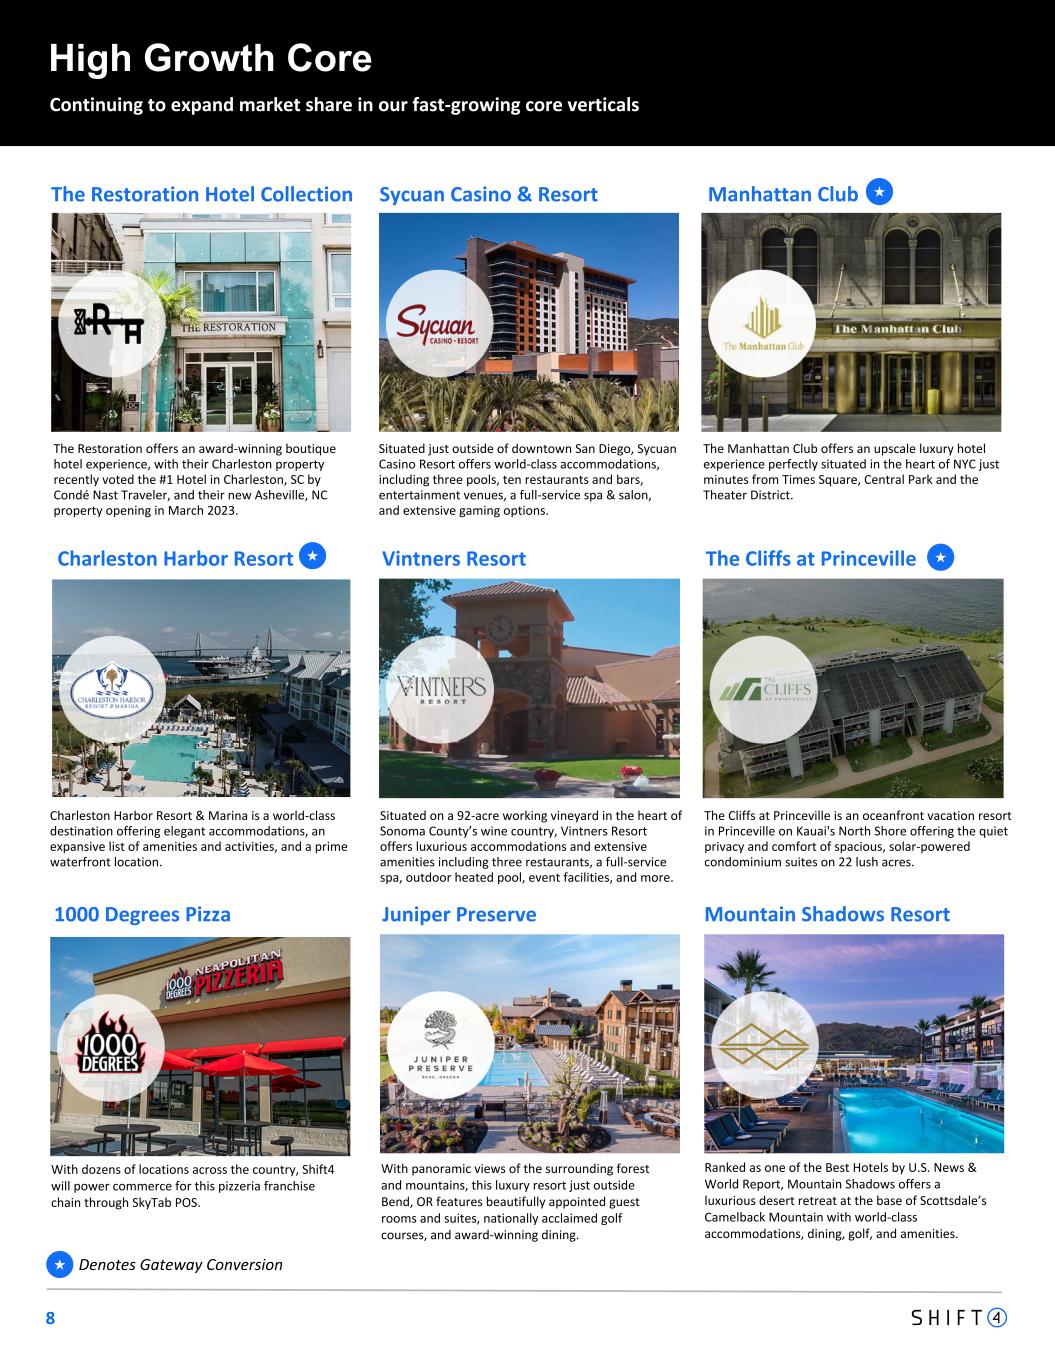
8 High Growth Core Continuing to expand market share in our fast-growing core verticals Denotes Gateway Conversion★ Situated just outside of downtown San Diego, Sycuan Casino Resort offers world-class accommodations, including three pools, ten restaurants and bars, entertainment venues, a full-service spa & salon, and extensive gaming options. Sycuan Casino & Resort The Manhattan Club offers an upscale luxury hotel experience perfectly situated in the heart of NYC just minutes from Times Square, Central Park and the Theater District. Manhattan Club Charleston Harbor Resort & Marina is a world-class destination offering elegant accommodations, an expansive list of amenities and activities, and a prime waterfront location. Charleston Harbor Resort Situated on a 92-acre working vineyard in the heart of Sonoma County’s wine country, Vintners Resort offers luxurious accommodations and extensive amenities including three restaurants, a full-service spa, outdoor heated pool, event facilities, and more. Vintners Resort The Cliffs at Princeville is an oceanfront vacation resort in Princeville on Kauai's North Shore offering the quiet privacy and comfort of spacious, solar-powered condominium suites on 22 lush acres. The Cliffs at Princeville The Restoration offers an award-winning boutique hotel experience, with their Charleston property recently voted the #1 Hotel in Charleston, SC by Condé Nast Traveler, and their new Asheville, NC property opening in March 2023. The Restoration Hotel Collection ★ ★ ★ Juniper Preserve Mountain Shadows Resort1000 Degrees Pizza With dozens of locations across the country, Shift4 will power commerce for this pizzeria franchise chain through SkyTab POS. With panoramic views of the surrounding forest and mountains, this luxury resort just outside Bend, OR features beautifully appointed guest rooms and suites, nationally acclaimed golf courses, and award-winning dining. Ranked as one of the Best Hotels by U.S. News & World Report, Mountain Shadows offers a luxurious desert retreat at the base of Scottsdale’s Camelback Mountain with world-class accommodations, dining, golf, and amenities.
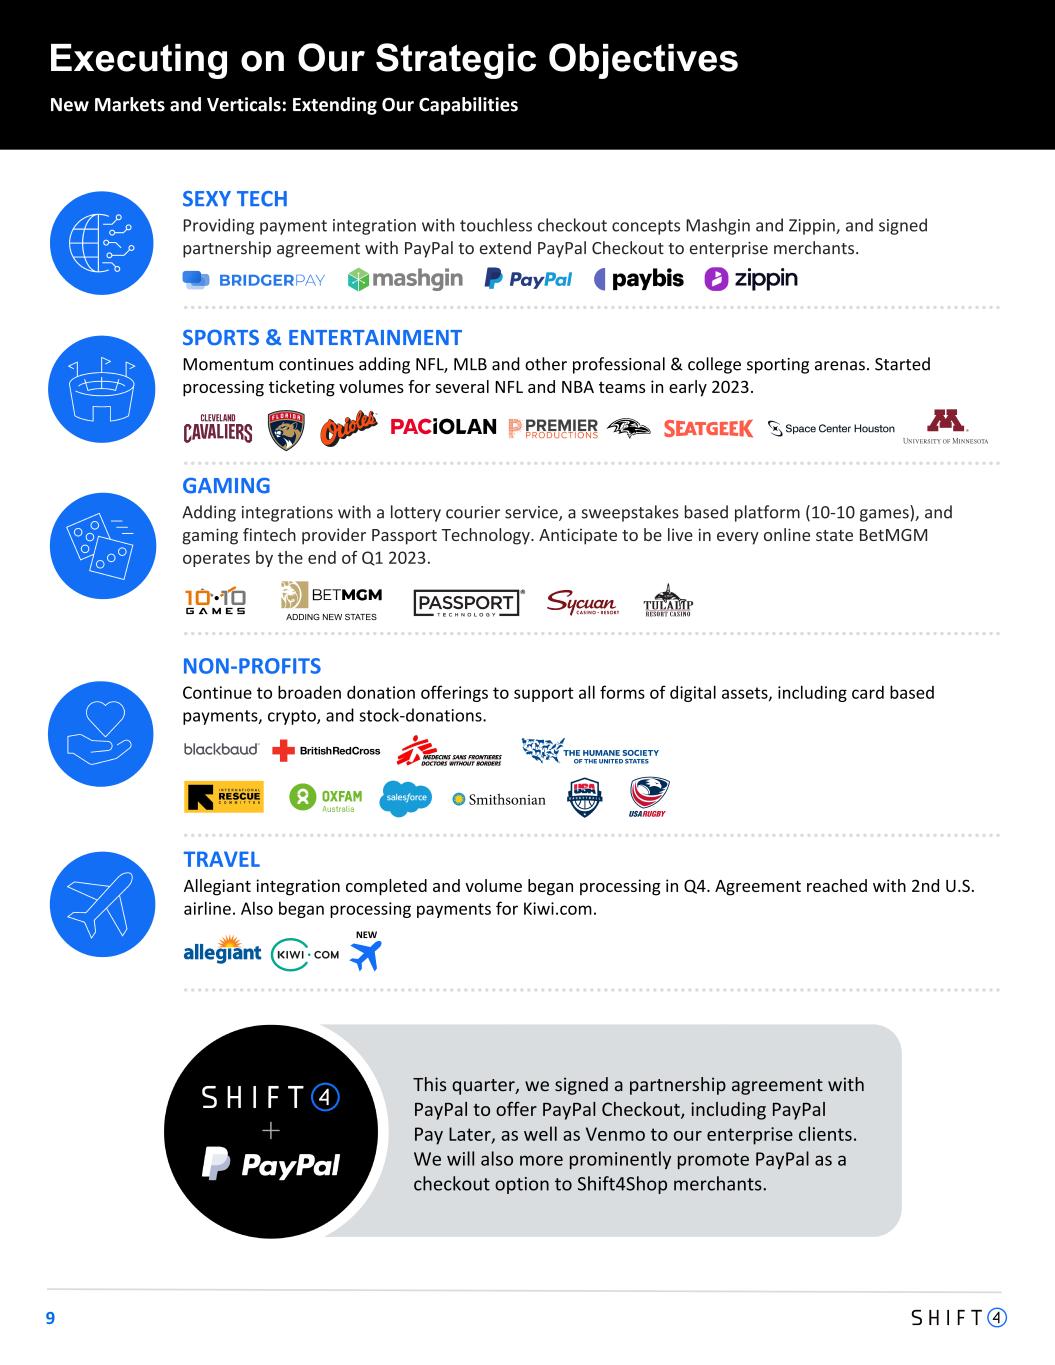
9 SEXY TECH Providing payment integration with touchless checkout concepts Mashgin and Zippin, and signed partnership agreement with PayPal to extend PayPal Checkout to enterprise merchants. SPORTS & ENTERTAINMENT Momentum continues adding NFL, MLB and other professional & college sporting arenas. Started processing ticketing volumes for several NFL and NBA teams in early 2023. NON-PROFITS Continue to broaden donation offerings to support all forms of digital assets, including card based payments, crypto, and stock-donations. GAMING Adding integrations with a lottery courier service, a sweepstakes based platform (10-10 games), and gaming fintech provider Passport Technology. Anticipate to be live in every online state BetMGM operates by the end of Q1 2023. TRAVEL Allegiant integration completed and volume began processing in Q4. Agreement reached with 2nd U.S. airline. Also began processing payments for Kiwi.com. New Markets and Verticals: Extending Our Capabilities Executing on Our Strategic Objectives This quarter, we signed a partnership agreement with PayPal to offer PayPal Checkout, including PayPal Pay Later, as well as Venmo to our enterprise clients. We will also more prominently promote PayPal as a checkout option to Shift4Shop merchants. ADDING NEW STATES NEW
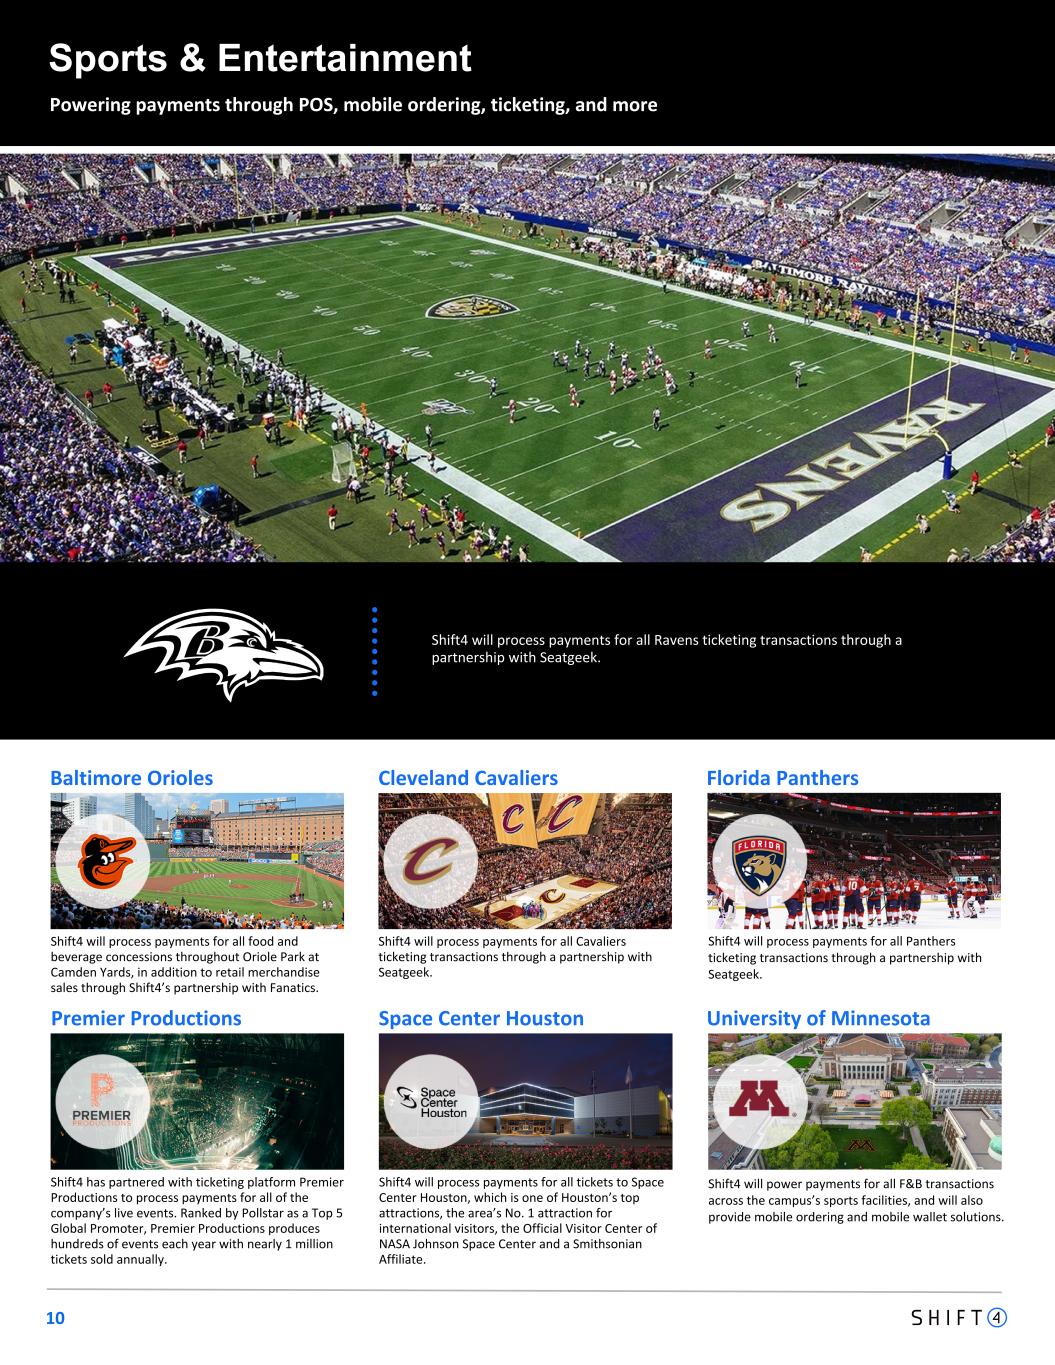
10 Sports & Entertainment Powering payments through POS, mobile ordering, ticketing, and more Shift4 will process payments for all Cavaliers ticketing transactions through a partnership with Seatgeek. Cleveland Cavaliers Shift4 will process payments for all tickets to Space Center Houston, which is one of Houston’s top attractions, the area’s No. 1 attraction for international visitors, the Official Visitor Center of NASA Johnson Space Center and a Smithsonian Affiliate. Space Center HoustonPremier Productions Shift4 has partnered with ticketing platform Premier Productions to process payments for all of the company’s live events. Ranked by Pollstar as a Top 5 Global Promoter, Premier Productions produces hundreds of events each year with nearly 1 million tickets sold annually. Shift4 will process payments for all food and beverage concessions throughout Oriole Park at Camden Yards, in addition to retail merchandise sales through Shift4’s partnership with Fanatics. Baltimore Orioles Shift4 will process payments for all Ravens ticketing transactions through a partnership with Seatgeek. Florida Panthers University of Minnesota Shift4 will process payments for all Panthers ticketing transactions through a partnership with Seatgeek. Shift4 will power payments for all F&B transactions across the campus’s sports facilities, and will also provide mobile ordering and mobile wallet solutions.
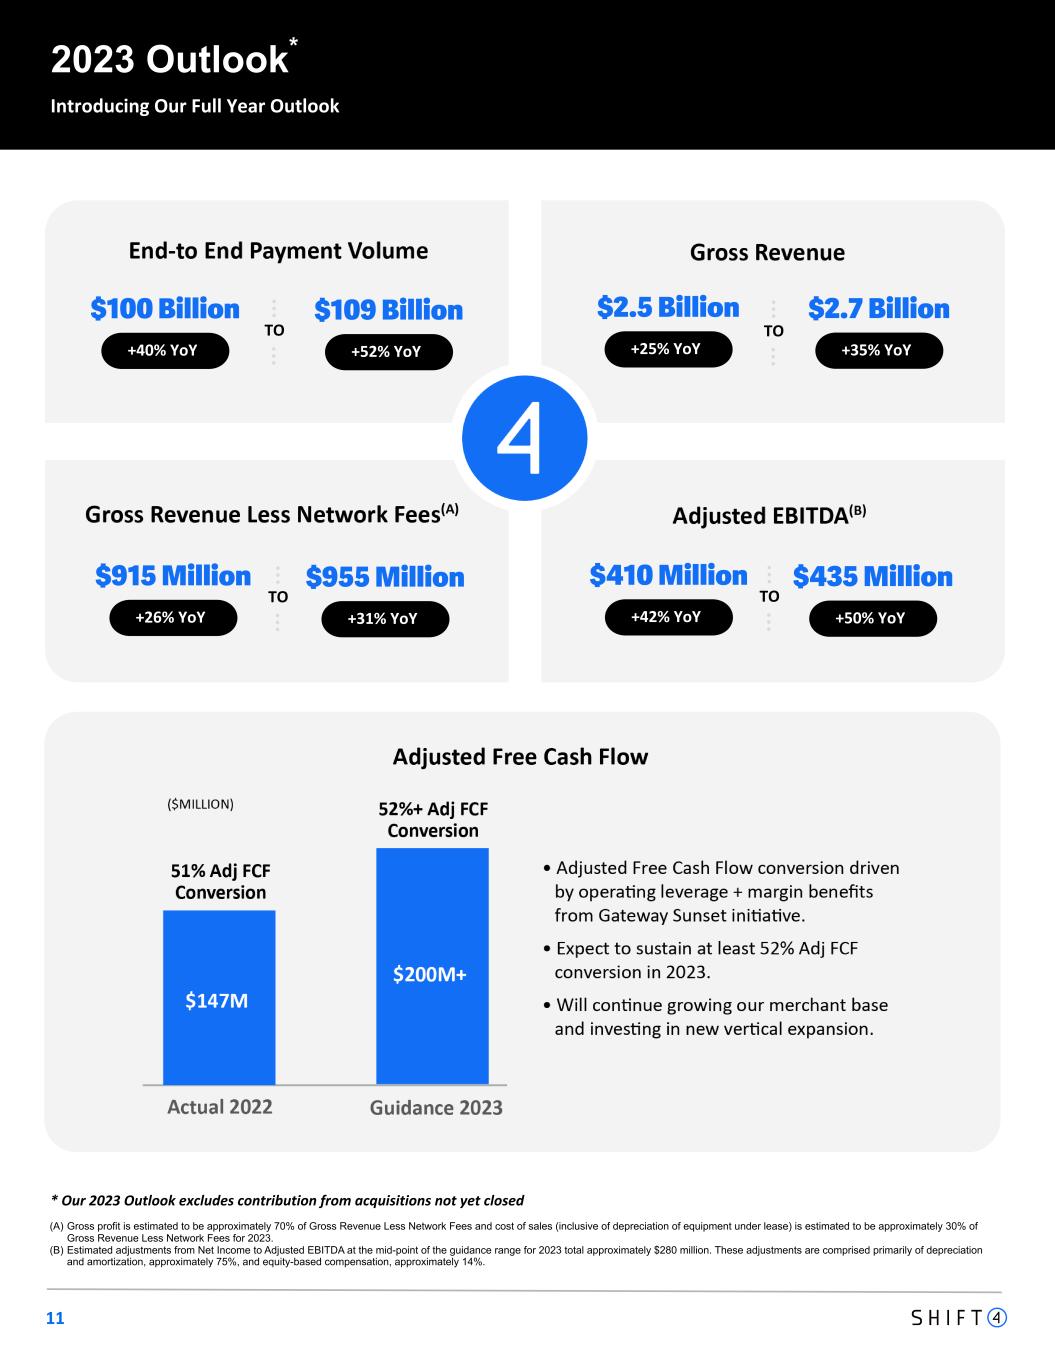
11 (A) Gross profit is estimated to be approximately 70% of Gross Revenue Less Network Fees and cost of sales (inclusive of depreciation of equipment under lease) is estimated to be approximately 30% of Gross Revenue Less Network Fees for 2023. (B) Estimated adjustments from Net Income to Adjusted EBITDA at the mid-point of the guidance range for 2023 total approximately $280 million. These adjustments are comprised primarily of depreciation and amortization, approximately 75%, and equity-based compensation, approximately 14%. * Our 2023 Outlook excludes contribution from acquisitions not yet closed TO 2023 Outlook* Introducing Our Full Year Outlook $100 Billion +40% YoY +52% YoY $109 Billion $2.5 Billion +25% YoY +35% YoY $2.7 Billion $915 Million +26% YoY +31% YoY $955 Million $410 Million +42% YoY +50% YoY $435 Million TO TO TO
Appendix - Financial Information 12
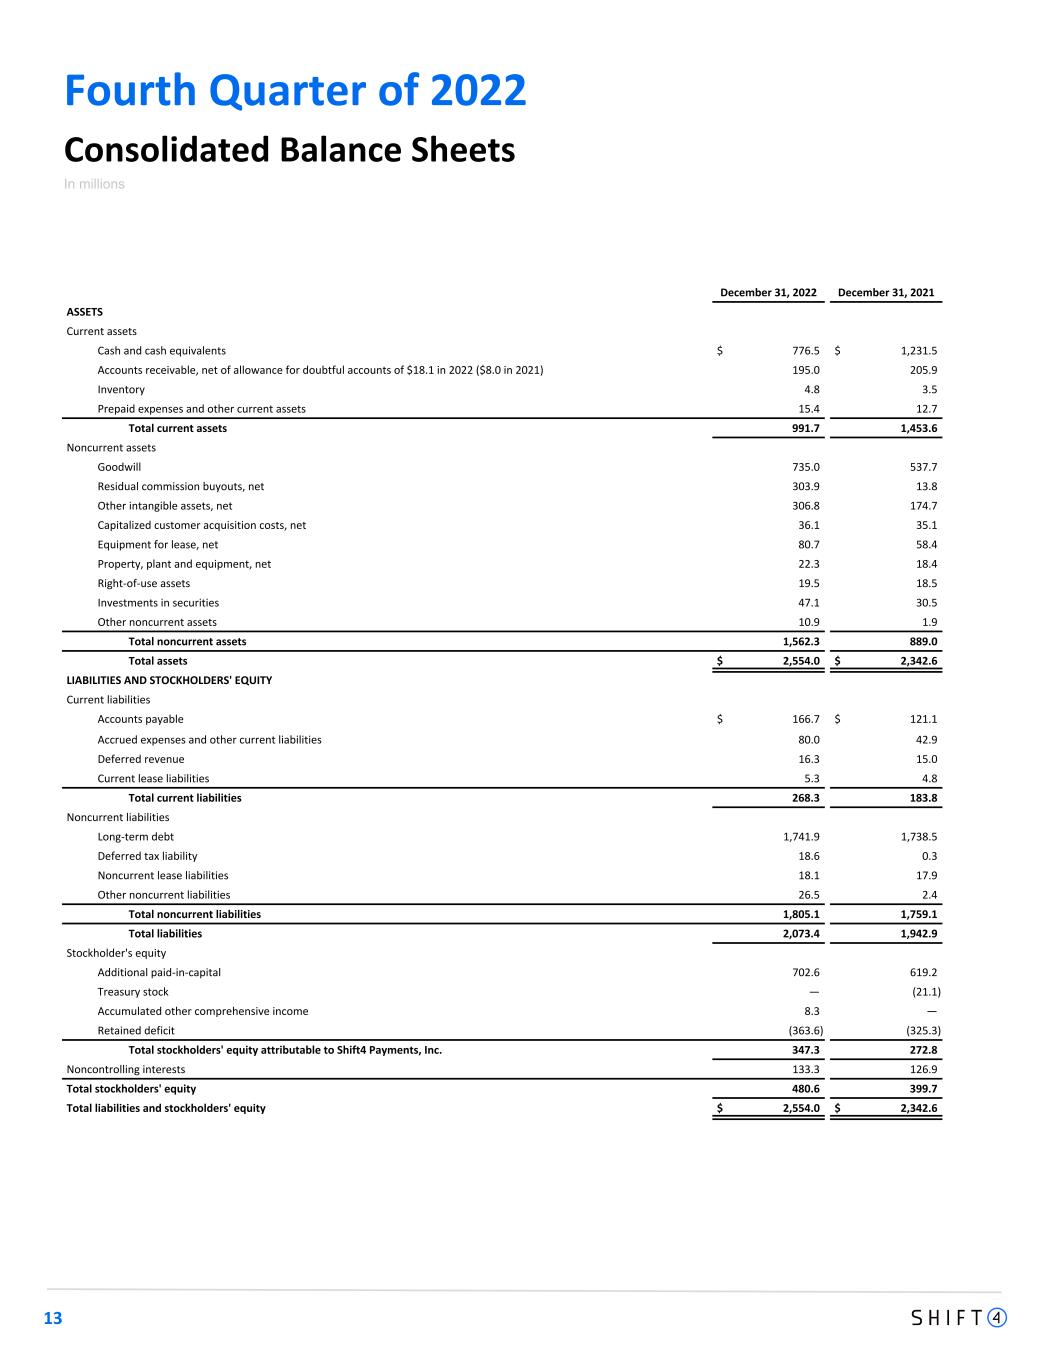
13 Fourth Quarter of 2022 Consolidated Balance Sheets In millions December 31, 2022 December 31, 2021 ASSETS Current assets Cash and cash equivalents $ 776.5 $ 1,231.5 Accounts receivable, net of allowance for doubtful accounts of $18.1 in 2022 ($8.0 in 2021) 195.0 205.9 Inventory 4.8 3.5 Prepaid expenses and other current assets 15.4 12.7 Total current assets 991.7 1,453.6 Noncurrent assets Goodwill 735.0 537.7 Residual commission buyouts, net 303.9 13.8 Other intangible assets, net 306.8 174.7 Capitalized customer acquisition costs, net 36.1 35.1 Equipment for lease, net 80.7 58.4 Property, plant and equipment, net 22.3 18.4 Right-of-use assets 19.5 18.5 Investments in securities 47.1 30.5 Other noncurrent assets 10.9 1.9 Total noncurrent assets 1,562.3 889.0 Total assets $ 2,554.0 $ 2,342.6 LIABILITIES AND STOCKHOLDERS' EQUITY Current liabilities Accounts payable $ 166.7 $ 121.1 Accrued expenses and other current liabilities 80.0 42.9 Deferred revenue 16.3 15.0 Current lease liabilities 5.3 4.8 Total current liabilities 268.3 183.8 Noncurrent liabilities Long-term debt 1,741.9 1,738.5 Deferred tax liability 18.6 0.3 Noncurrent lease liabilities 18.1 17.9 Other noncurrent liabilities 26.5 2.4 Total noncurrent liabilities 1,805.1 1,759.1 Total liabilities 2,073.4 1,942.9 Stockholder's equity Additional paid-in-capital 702.6 619.2 Treasury stock — (21.1) Accumulated other comprehensive income 8.3 — Retained deficit (363.6) (325.3) Total stockholders' equity attributable to Shift4 Payments, Inc. 347.3 272.8 Noncontrolling interests 133.3 126.9 Total stockholders' equity 480.6 399.7 Total liabilities and stockholders' equity $ 2,554.0 $ 2,342.6
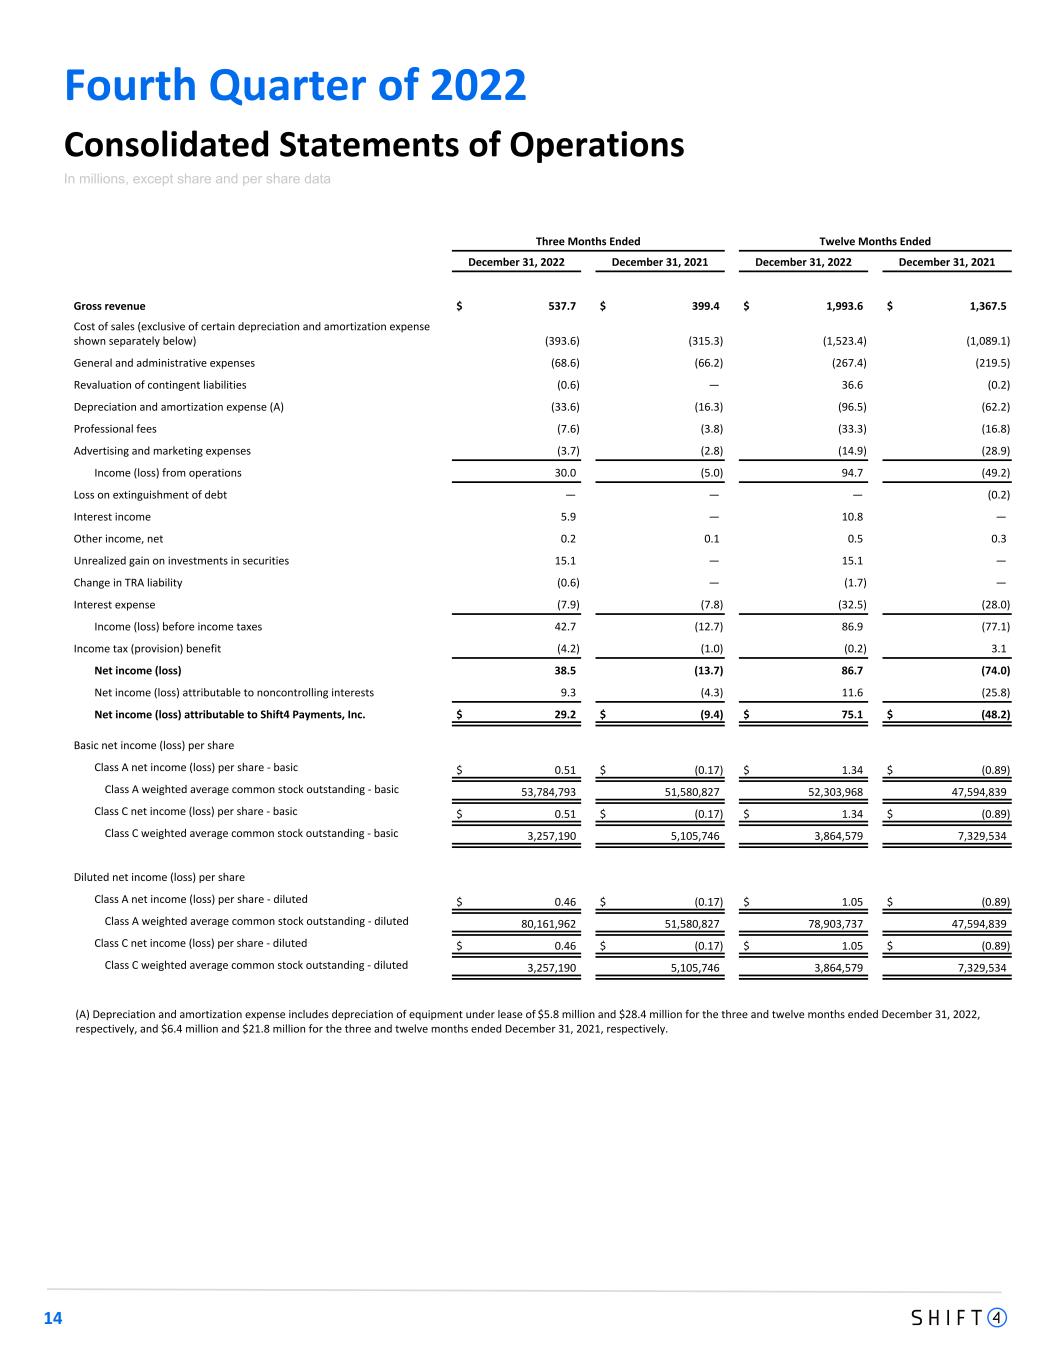
14 Fourth Quarter of 2022 Consolidated Statements of Operations In millions, except share and per share data Three Months Ended Twelve Months Ended December 31, 2022 December 31, 2021 December 31, 2022 December 31, 2021 Gross revenue $ 537.7 $ 399.4 $ 1,993.6 $ 1,367.5 Cost of sales (exclusive of certain depreciation and amortization expense shown separately below) (393.6) (315.3) (1,523.4) (1,089.1) General and administrative expenses (68.6) (66.2) (267.4) (219.5) Revaluation of contingent liabilities (0.6) — 36.6 (0.2) Depreciation and amortization expense (A) (33.6) (16.3) (96.5) (62.2) Professional fees (7.6) (3.8) (33.3) (16.8) Advertising and marketing expenses (3.7) (2.8) (14.9) (28.9) Income (loss) from operations 30.0 (5.0) 94.7 (49.2) Loss on extinguishment of debt — — — (0.2) Interest income 5.9 — 10.8 — Other income, net 0.2 0.1 0.5 0.3 Unrealized gain on investments in securities 15.1 — 15.1 — Change in TRA liability (0.6) — (1.7) — Interest expense (7.9) (7.8) (32.5) (28.0) Income (loss) before income taxes 42.7 (12.7) 86.9 (77.1) Income tax (provision) benefit (4.2) (1.0) (0.2) 3.1 Net income (loss) 38.5 (13.7) 86.7 (74.0) Net income (loss) attributable to noncontrolling interests 9.3 (4.3) 11.6 (25.8) Net income (loss) attributable to Shift4 Payments, Inc. $ 29.2 $ (9.4) $ 75.1 $ (48.2) Basic net income (loss) per share Class A net income (loss) per share - basic $ 0.51 $ (0.17) $ 1.34 $ (0.89) Class A weighted average common stock outstanding - basic 53,784,793 51,580,827 52,303,968 47,594,839 Class C net income (loss) per share - basic $ 0.51 $ (0.17) $ 1.34 $ (0.89) Class C weighted average common stock outstanding - basic 3,257,190 5,105,746 3,864,579 7,329,534 Diluted net income (loss) per share Class A net income (loss) per share - diluted $ 0.46 $ (0.17) $ 1.05 $ (0.89) Class A weighted average common stock outstanding - diluted 80,161,962 51,580,827 78,903,737 47,594,839 Class C net income (loss) per share - diluted $ 0.46 $ (0.17) $ 1.05 $ (0.89) Class C weighted average common stock outstanding - diluted 3,257,190 5,105,746 3,864,579 7,329,534 (A) Depreciation and amortization expense includes depreciation of equipment under lease of $5.8 million and $28.4 million for the three and twelve months ended December 31, 2022, respectively, and $6.4 million and $21.8 million for the three and twelve months ended December 31, 2021, respectively.
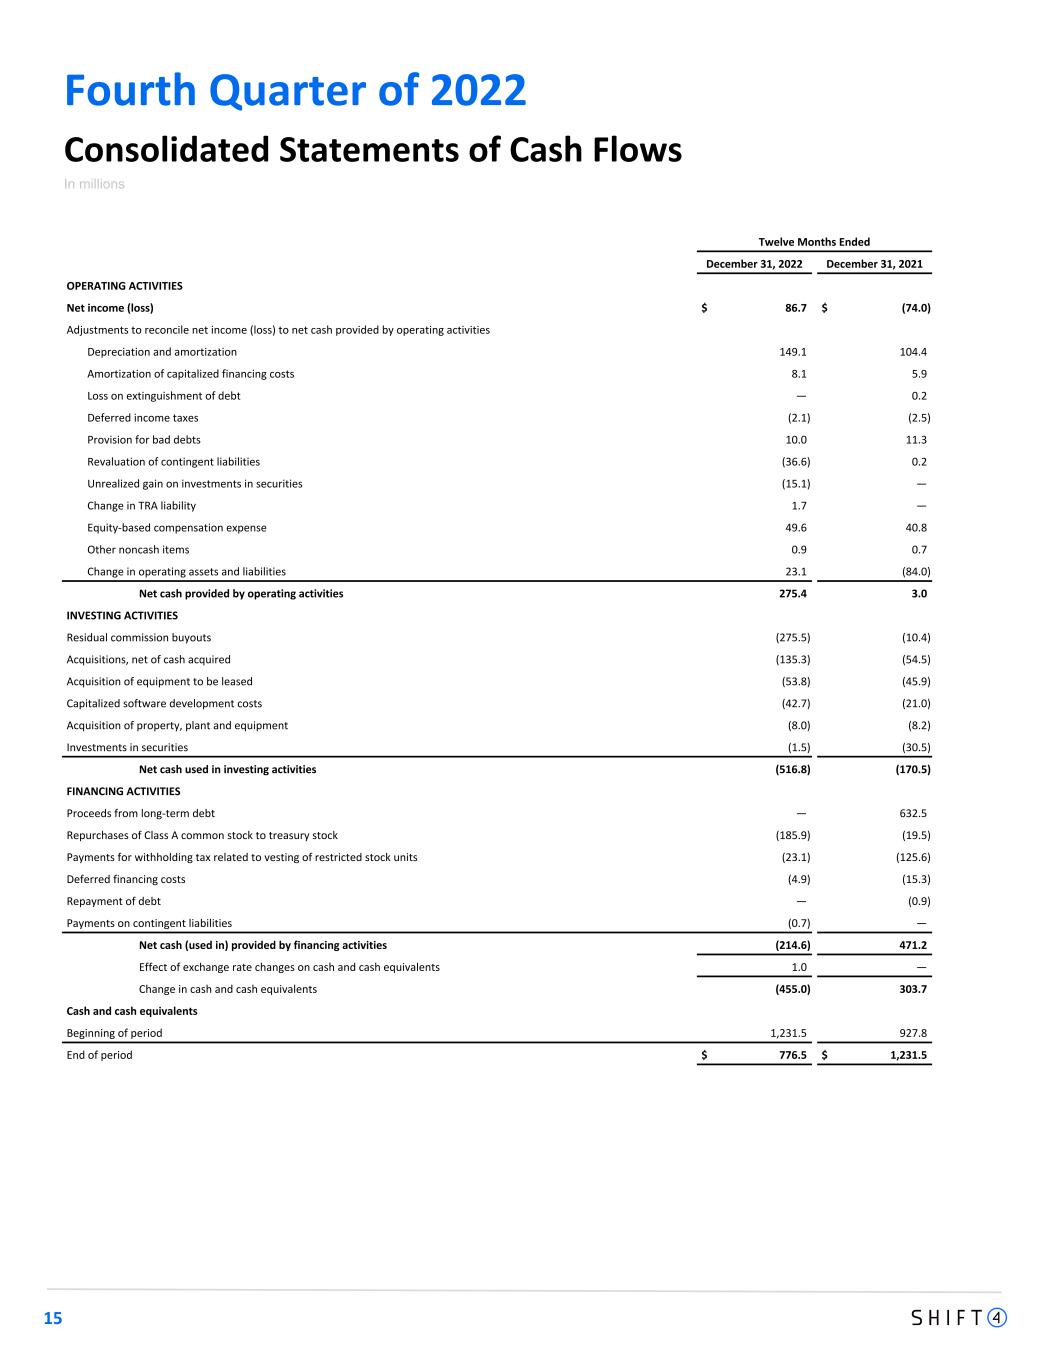
Fourth Quarter of 2022 15 Consolidated Statements of Cash Flows In millions Twelve Months Ended December 31, 2022 December 31, 2021 OPERATING ACTIVITIES Net income (loss) $ 86.7 $ (74.0) Adjustments to reconcile net income (loss) to net cash provided by operating activities Depreciation and amortization 149.1 104.4 Amortization of capitalized financing costs 8.1 5.9 Loss on extinguishment of debt — 0.2 Deferred income taxes (2.1) (2.5) Provision for bad debts 10.0 11.3 Revaluation of contingent liabilities (36.6) 0.2 Unrealized gain on investments in securities (15.1) — Change in TRA liability 1.7 — Equity-based compensation expense 49.6 40.8 Other noncash items 0.9 0.7 Change in operating assets and liabilities 23.1 (84.0) Net cash provided by operating activities 275.4 3.0 INVESTING ACTIVITIES Residual commission buyouts (275.5) (10.4) Acquisitions, net of cash acquired (135.3) (54.5) Acquisition of equipment to be leased (53.8) (45.9) Capitalized software development costs (42.7) (21.0) Acquisition of property, plant and equipment (8.0) (8.2) Investments in securities (1.5) (30.5) Net cash used in investing activities (516.8) (170.5) FINANCING ACTIVITIES Proceeds from long-term debt — 632.5 Repurchases of Class A common stock to treasury stock (185.9) (19.5) Payments for withholding tax related to vesting of restricted stock units (23.1) (125.6) Deferred financing costs (4.9) (15.3) Repayment of debt — (0.9) Payments on contingent liabilities (0.7) — Net cash (used in) provided by financing activities (214.6) 471.2 Effect of exchange rate changes on cash and cash equivalents 1.0 — Change in cash and cash equivalents (455.0) 303.7 Cash and cash equivalents Beginning of period 1,231.5 927.8 End of period $ 776.5 $ 1,231.5
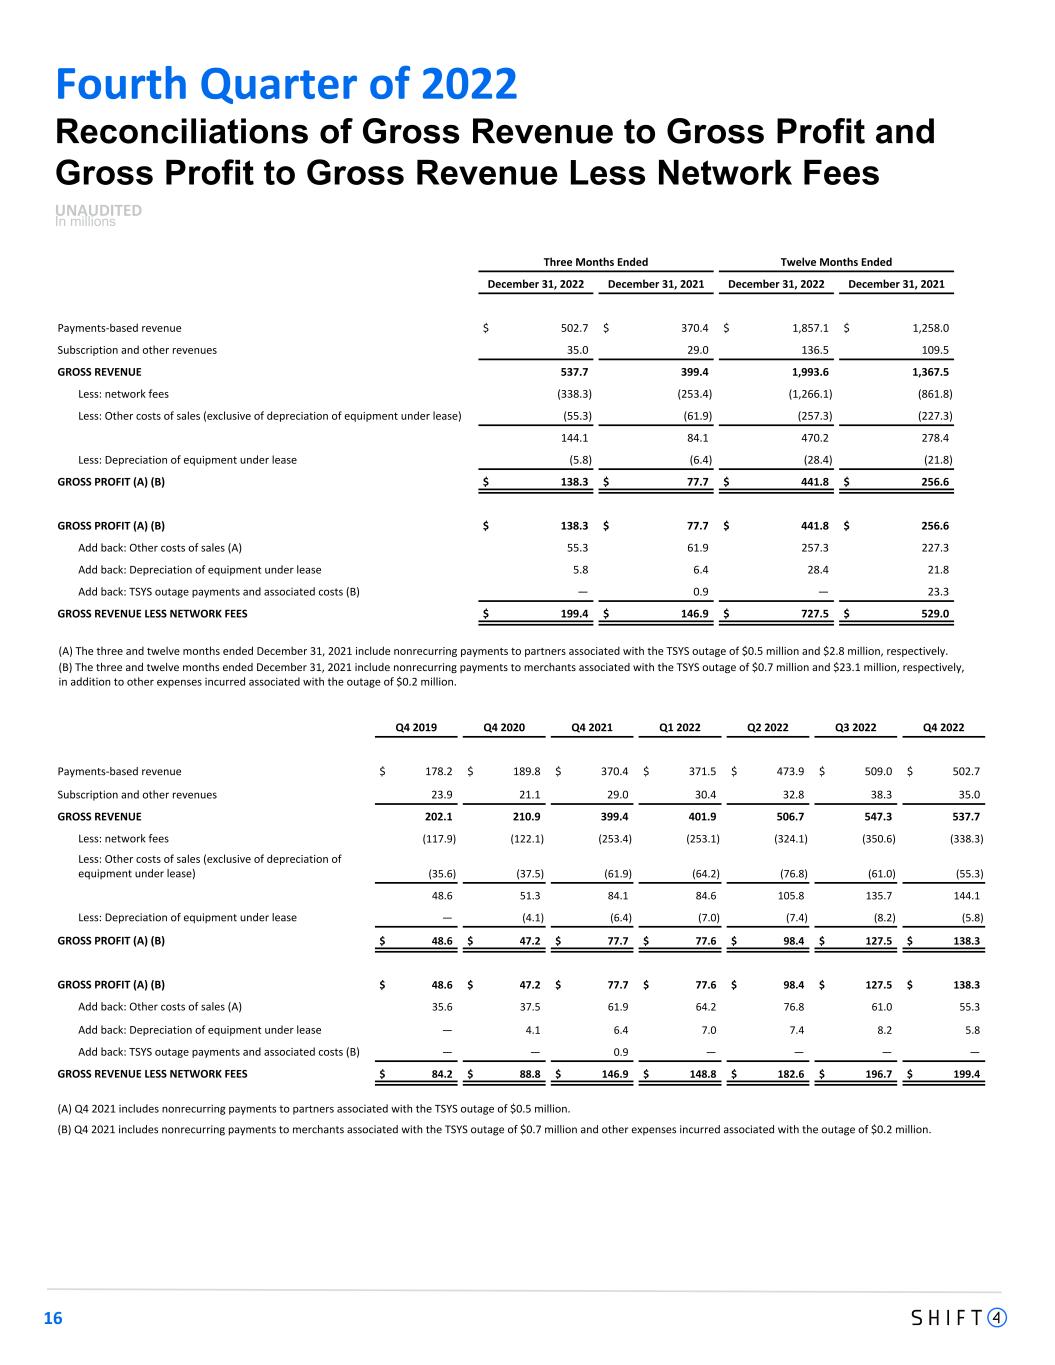
Fourth Quarter of 2022 Reconciliations of Gross Revenue to Gross Profit and Gross Profit to Gross Revenue Less Network Fees UNAUDITED In millions Three Months Ended Twelve Months Ended December 31, 2022 December 31, 2021 December 31, 2022 December 31, 2021 Payments-based revenue $ 502.7 $ 370.4 $ 1,857.1 $ 1,258.0 Subscription and other revenues 35.0 29.0 136.5 109.5 GROSS REVENUE 537.7 399.4 1,993.6 1,367.5 Less: network fees (338.3) (253.4) (1,266.1) (861.8) Less: Other costs of sales (exclusive of depreciation of equipment under lease) (55.3) (61.9) (257.3) (227.3) 144.1 84.1 470.2 278.4 Less: Depreciation of equipment under lease (5.8) (6.4) (28.4) (21.8) GROSS PROFIT (A) (B) $ 138.3 $ 77.7 $ 441.8 $ 256.6 GROSS PROFIT (A) (B) $ 138.3 $ 77.7 $ 441.8 $ 256.6 Add back: Other costs of sales (A) 55.3 61.9 257.3 227.3 Add back: Depreciation of equipment under lease 5.8 6.4 28.4 21.8 Add back: TSYS outage payments and associated costs (B) — 0.9 — 23.3 GROSS REVENUE LESS NETWORK FEES $ 199.4 $ 146.9 $ 727.5 $ 529.0 16 (A) The three and twelve months ended December 31, 2021 include nonrecurring payments to partners associated with the TSYS outage of $0.5 million and $2.8 million, respectively. (B) The three and twelve months ended December 31, 2021 include nonrecurring payments to merchants associated with the TSYS outage of $0.7 million and $23.1 million, respectively, in addition to other expenses incurred associated with the outage of $0.2 million. Q4 2019 Q4 2020 Q4 2021 Q1 2022 Q2 2022 Q3 2022 Q4 2022 Payments-based revenue $ 178.2 $ 189.8 $ 370.4 $ 371.5 $ 473.9 $ 509.0 $ 502.7 Subscription and other revenues 23.9 21.1 29.0 30.4 32.8 38.3 35.0 GROSS REVENUE 202.1 210.9 399.4 401.9 506.7 547.3 537.7 Less: network fees (117.9) (122.1) (253.4) (253.1) (324.1) (350.6) (338.3) Less: Other costs of sales (exclusive of depreciation of equipment under lease) (35.6) (37.5) (61.9) (64.2) (76.8) (61.0) (55.3) 48.6 51.3 84.1 84.6 105.8 135.7 144.1 Less: Depreciation of equipment under lease — (4.1) (6.4) (7.0) (7.4) (8.2) (5.8) GROSS PROFIT (A) (B) $ 48.6 $ 47.2 $ 77.7 $ 77.6 $ 98.4 $ 127.5 $ 138.3 GROSS PROFIT (A) (B) $ 48.6 $ 47.2 $ 77.7 $ 77.6 $ 98.4 $ 127.5 $ 138.3 Add back: Other costs of sales (A) 35.6 37.5 61.9 64.2 76.8 61.0 55.3 Add back: Depreciation of equipment under lease — 4.1 6.4 7.0 7.4 8.2 5.8 Add back: TSYS outage payments and associated costs (B) — — 0.9 — — — — GROSS REVENUE LESS NETWORK FEES $ 84.2 $ 88.8 $ 146.9 $ 148.8 $ 182.6 $ 196.7 $ 199.4 (A) Q4 2021 includes nonrecurring payments to partners associated with the TSYS outage of $0.5 million. (B) Q4 2021 includes nonrecurring payments to merchants associated with the TSYS outage of $0.7 million and other expenses incurred associated with the outage of $0.2 million.
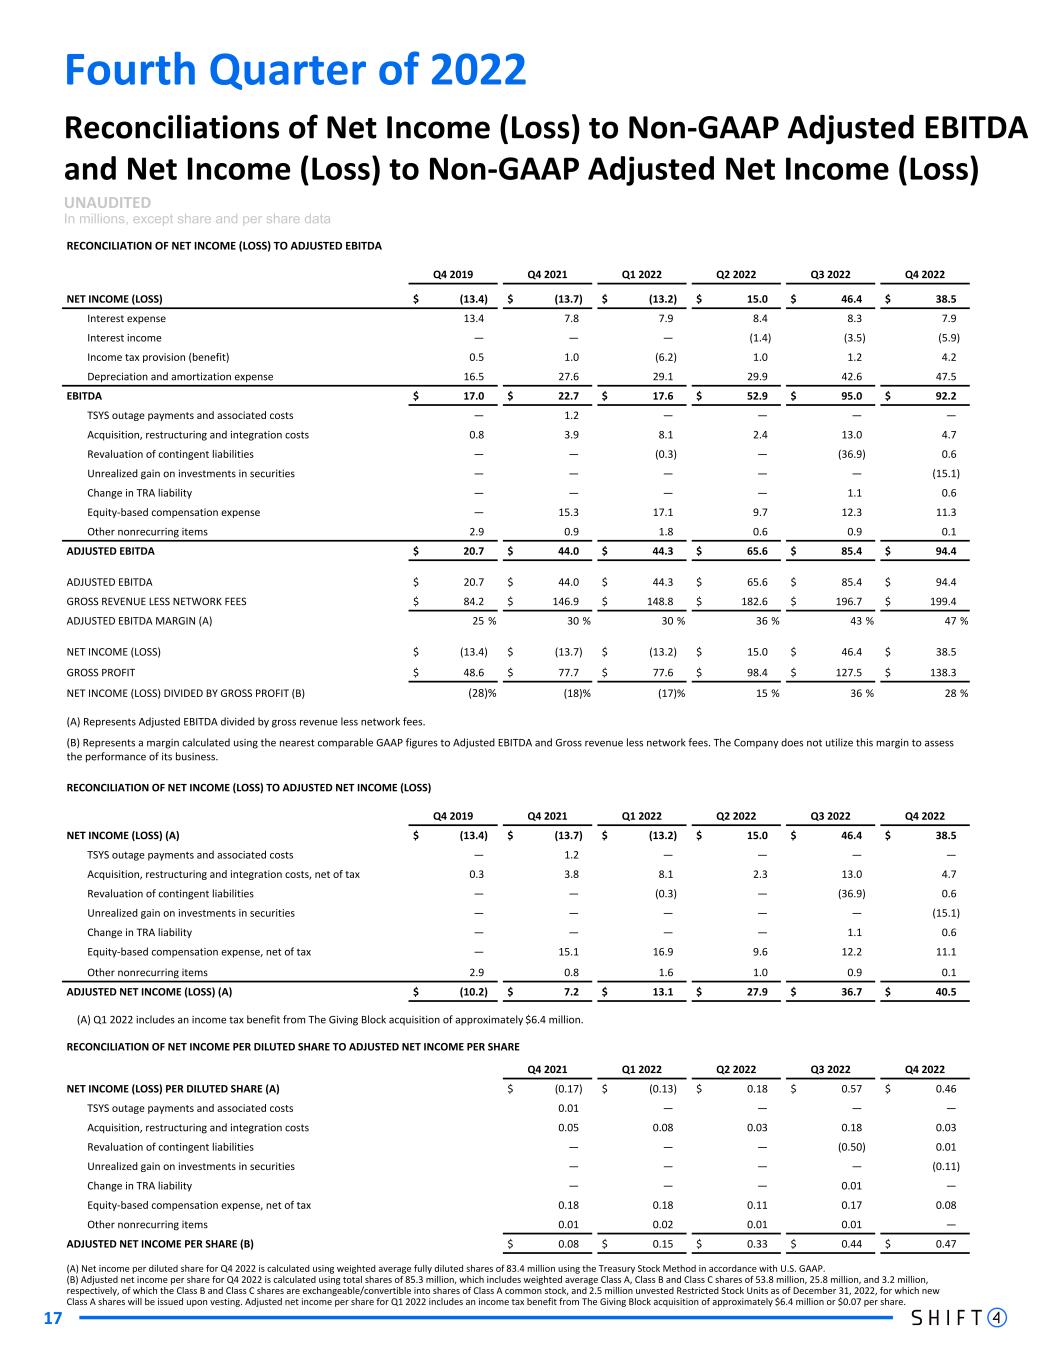
Fourth Quarter of 2022 17 Reconciliations of Net Income (Loss) to Non-GAAP Adjusted EBITDA and Net Income (Loss) to Non-GAAP Adjusted Net Income (Loss) UNAUDITED In millions, except share and per share data RECONCILIATION OF NET INCOME (LOSS) TO ADJUSTED EBITDA Q4 2019 Q4 2021 Q1 2022 Q2 2022 Q3 2022 Q4 2022 NET INCOME (LOSS) $ (13.4) $ (13.7) $ (13.2) $ 15.0 $ 46.4 $ 38.5 Interest expense 13.4 7.8 7.9 8.4 8.3 7.9 Interest income — — — (1.4) (3.5) (5.9) Income tax provision (benefit) 0.5 1.0 (6.2) 1.0 1.2 4.2 Depreciation and amortization expense 16.5 27.6 29.1 29.9 42.6 47.5 EBITDA $ 17.0 $ 22.7 $ 17.6 $ 52.9 $ 95.0 $ 92.2 TSYS outage payments and associated costs — 1.2 — — — — Acquisition, restructuring and integration costs 0.8 3.9 8.1 2.4 13.0 4.7 Revaluation of contingent liabilities — — (0.3) — (36.9) 0.6 Unrealized gain on investments in securities — — — — — (15.1) Change in TRA liability — — — — 1.1 0.6 Equity-based compensation expense — 15.3 17.1 9.7 12.3 11.3 Other nonrecurring items 2.9 0.9 1.8 0.6 0.9 0.1 ADJUSTED EBITDA $ 20.7 $ 44.0 $ 44.3 $ 65.6 $ 85.4 $ 94.4 ADJUSTED EBITDA $ 20.7 $ 44.0 $ 44.3 $ 65.6 $ 85.4 $ 94.4 GROSS REVENUE LESS NETWORK FEES $ 84.2 $ 146.9 $ 148.8 $ 182.6 $ 196.7 $ 199.4 ADJUSTED EBITDA MARGIN (A) 25 % 30 % 30 % 36 % 43 % 47 % NET INCOME (LOSS) $ (13.4) $ (13.7) $ (13.2) $ 15.0 $ 46.4 $ 38.5 GROSS PROFIT $ 48.6 $ 77.7 $ 77.6 $ 98.4 $ 127.5 $ 138.3 NET INCOME (LOSS) DIVIDED BY GROSS PROFIT (B) (28) % (18) % (17) % 15 % 36 % 28 % (A) Represents Adjusted EBITDA divided by gross revenue less network fees. (B) Represents a margin calculated using the nearest comparable GAAP figures to Adjusted EBITDA and Gross revenue less network fees. The Company does not utilize this margin to assess the performance of its business. RECONCILIATION OF NET INCOME (LOSS) TO ADJUSTED NET INCOME (LOSS) Q4 2019 Q4 2021 Q1 2022 Q2 2022 Q3 2022 Q4 2022 NET INCOME (LOSS) (A) $ (13.4) $ (13.7) $ (13.2) $ 15.0 $ 46.4 $ 38.5 TSYS outage payments and associated costs — 1.2 — — — — Acquisition, restructuring and integration costs, net of tax 0.3 3.8 8.1 2.3 13.0 4.7 Revaluation of contingent liabilities — — (0.3) — (36.9) 0.6 Unrealized gain on investments in securities — — — — — (15.1) Change in TRA liability — — — — 1.1 0.6 Equity-based compensation expense, net of tax — 15.1 16.9 9.6 12.2 11.1 Other nonrecurring items 2.9 0.8 1.6 1.0 0.9 0.1 ADJUSTED NET INCOME (LOSS) (A) $ (10.2) $ 7.2 $ 13.1 $ 27.9 $ 36.7 $ 40.5 (A) Q1 2022 includes an income tax benefit from The Giving Block acquisition of approximately $6.4 million. RECONCILIATION OF NET INCOME PER DILUTED SHARE TO ADJUSTED NET INCOME PER SHARE Q4 2021 Q1 2022 Q2 2022 Q3 2022 Q4 2022 NET INCOME (LOSS) PER DILUTED SHARE (A) $ (0.17) $ (0.13) $ 0.18 $ 0.57 $ 0.46 TSYS outage payments and associated costs 0.01 — — — — Acquisition, restructuring and integration costs 0.05 0.08 0.03 0.18 0.03 Revaluation of contingent liabilities — — — (0.50) 0.01 Unrealized gain on investments in securities — — — — (0.11) Change in TRA liability — — — 0.01 — Equity-based compensation expense, net of tax 0.18 0.18 0.11 0.17 0.08 Other nonrecurring items 0.01 0.02 0.01 0.01 — ADJUSTED NET INCOME PER SHARE (B) $ 0.08 $ 0.15 $ 0.33 $ 0.44 $ 0.47 (A) Net income per diluted share for Q4 2022 is calculated using weighted average fully diluted shares of 83.4 million using the Treasury Stock Method in accordance with U.S. GAAP. (B) Adjusted net income per share for Q4 2022 is calculated using total shares of 85.3 million, which includes weighted average Class A, Class B and Class C shares of 53.8 million, 25.8 million, and 3.2 million, respectively, of which the Class B and Class C shares are exchangeable/convertible into shares of Class A common stock, and 2.5 million unvested Restricted Stock Units as of December 31, 2022, for which new Class A shares will be issued upon vesting. Adjusted net income per share for Q1 2022 includes an income tax benefit from The Giving Block acquisition of approximately $6.4 million or $0.07 per share.
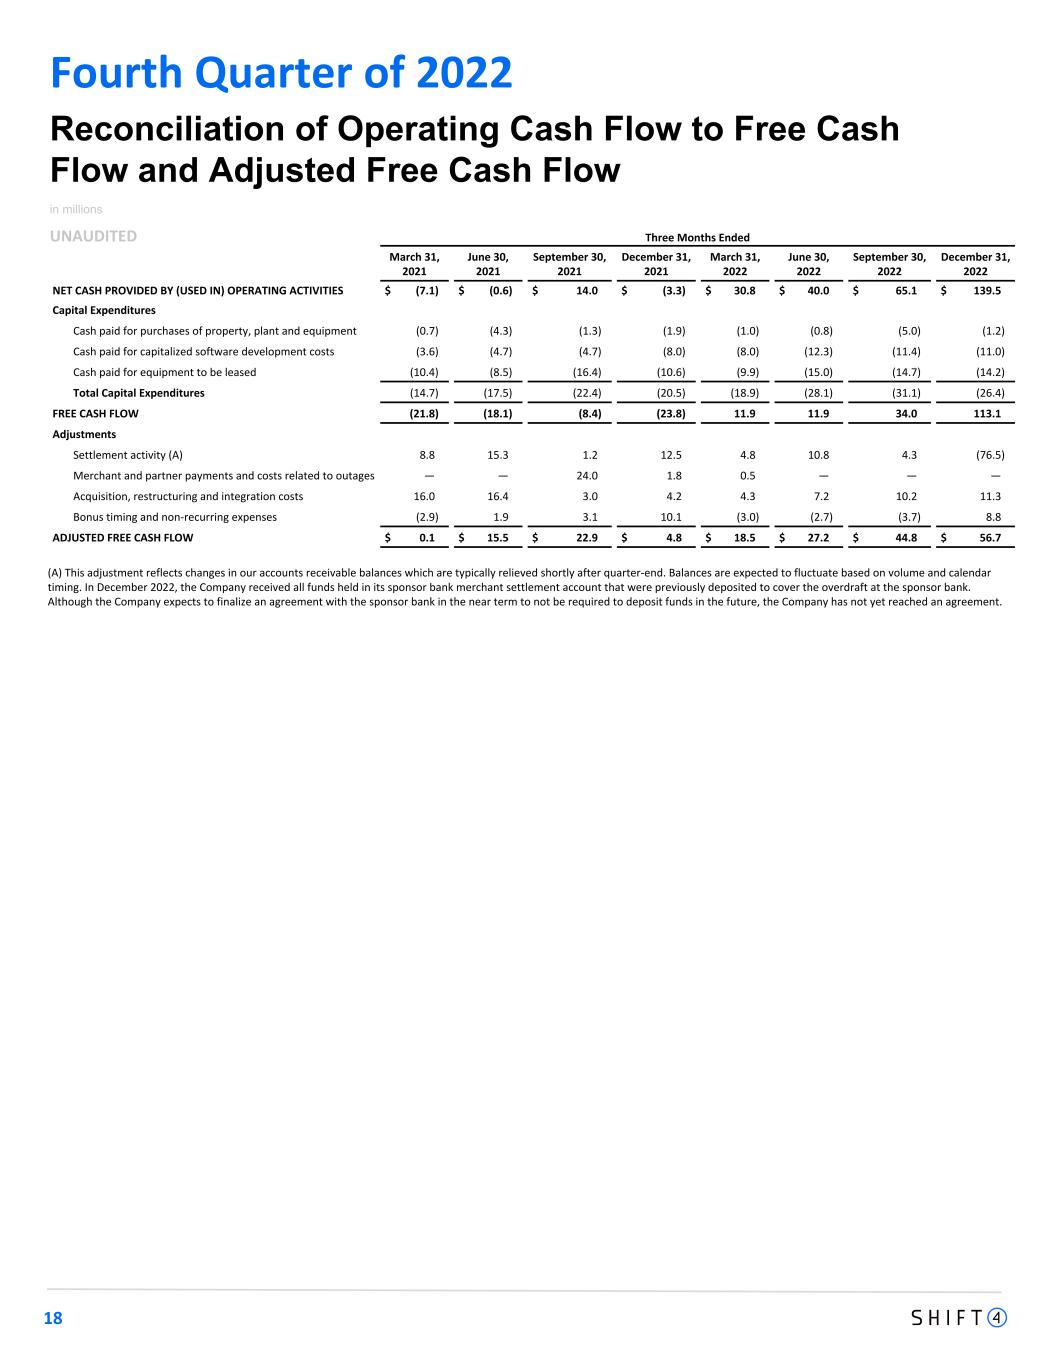
Three Months Ended March 31, 2021 June 30, 2021 September 30, 2021 December 31, 2021 March 31, 2022 June 30, 2022 September 30, 2022 December 31, 2022 NET CASH PROVIDED BY (USED IN) OPERATING ACTIVITIES $ (7.1) $ (0.6) $ 14.0 $ (3.3) $ 30.8 $ 40.0 $ 65.1 $ 139.5 Capital Expenditures Cash paid for purchases of property, plant and equipment (0.7) (4.3) (1.3) (1.9) (1.0) (0.8) (5.0) (1.2) Cash paid for capitalized software development costs (3.6) (4.7) (4.7) (8.0) (8.0) (12.3) (11.4) (11.0) Cash paid for equipment to be leased (10.4) (8.5) (16.4) (10.6) (9.9) (15.0) (14.7) (14.2) Total Capital Expenditures (14.7) (17.5) (22.4) (20.5) (18.9) (28.1) (31.1) (26.4) FREE CASH FLOW (21.8) (18.1) (8.4) (23.8) 11.9 11.9 34.0 113.1 Adjustments Settlement activity (A) 8.8 15.3 1.2 12.5 4.8 10.8 4.3 (76.5) Merchant and partner payments and costs related to outages — — 24.0 1.8 0.5 — — — Acquisition, restructuring and integration costs 16.0 16.4 3.0 4.2 4.3 7.2 10.2 11.3 Bonus timing and non-recurring expenses (2.9) 1.9 3.1 10.1 (3.0) (2.7) (3.7) 8.8 ADJUSTED FREE CASH FLOW $ 0.1 $ 15.5 $ 22.9 $ 4.8 $ 18.5 $ 27.2 $ 44.8 $ 56.7 Reconciliation of Operating Cash Flow to Free Cash Flow and Adjusted Free Cash Flow in millions UNAUDITED 18 Fourth Quarter of 2022 (A) This adjustment reflects changes in our accounts receivable balances which are typically relieved shortly after quarter-end. Balances are expected to fluctuate based on volume and calendar timing. In December 2022, the Company received all funds held in its sponsor bank merchant settlement account that were previously deposited to cover the overdraft at the sponsor bank. Although the Company expects to finalize an agreement with the sponsor bank in the near term to not be required to deposit funds in the future, the Company has not yet reached an agreement.
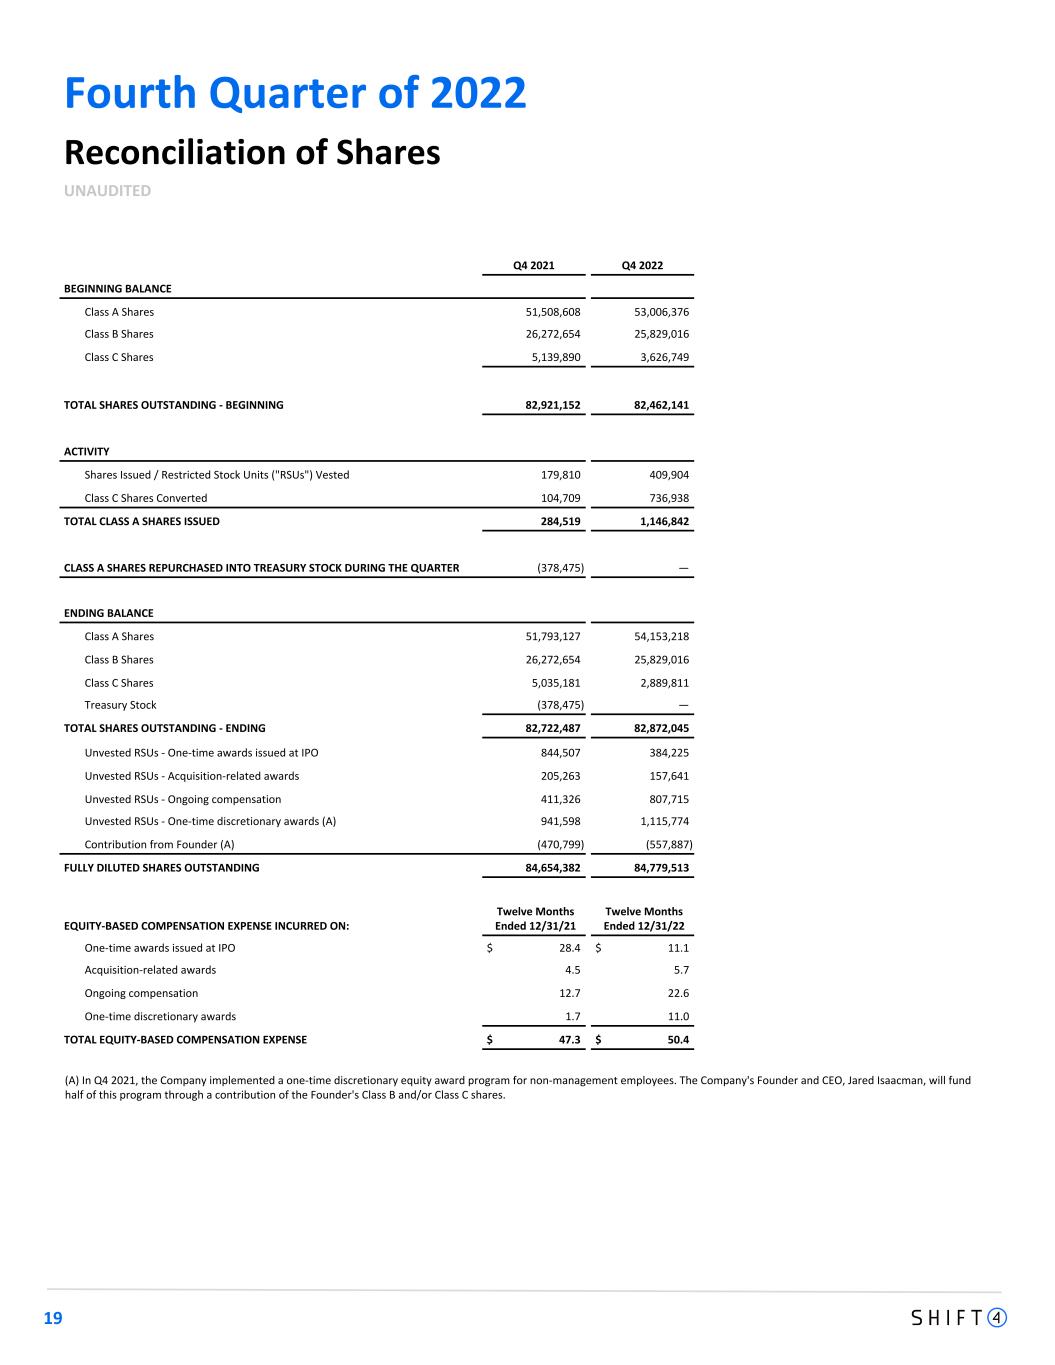
Fourth Quarter of 2022 19 Reconciliation of Shares UNAUDITED Q4 2021 Q4 2022 BEGINNING BALANCE Class A Shares 51,508,608 53,006,376 Class B Shares 26,272,654 25,829,016 Class C Shares 5,139,890 3,626,749 TOTAL SHARES OUTSTANDING - BEGINNING 82,921,152 82,462,141 ACTIVITY Shares Issued / Restricted Stock Units ("RSUs") Vested 179,810 409,904 Class C Shares Converted 104,709 736,938 TOTAL CLASS A SHARES ISSUED 284,519 1,146,842 CLASS A SHARES REPURCHASED INTO TREASURY STOCK DURING THE QUARTER (378,475) — ENDING BALANCE Class A Shares 51,793,127 54,153,218 Class B Shares 26,272,654 25,829,016 Class C Shares 5,035,181 2,889,811 Treasury Stock (378,475) — TOTAL SHARES OUTSTANDING - ENDING 82,722,487 82,872,045 Unvested RSUs - One-time awards issued at IPO 844,507 384,225 Unvested RSUs - Acquisition-related awards 205,263 157,641 Unvested RSUs - Ongoing compensation 411,326 807,715 Unvested RSUs - One-time discretionary awards (A) 941,598 1,115,774 Contribution from Founder (A) (470,799) (557,887) FULLY DILUTED SHARES OUTSTANDING 84,654,382 84,779,513 EQUITY-BASED COMPENSATION EXPENSE INCURRED ON: Twelve Months Ended 12/31/21 Twelve Months Ended 12/31/22 One-time awards issued at IPO $ 28.4 $ 11.1 Acquisition-related awards 4.5 5.7 Ongoing compensation 12.7 22.6 One-time discretionary awards 1.7 11.0 TOTAL EQUITY-BASED COMPENSATION EXPENSE $ 47.3 $ 50.4 (A) In Q4 2021, the Company implemented a one-time discretionary equity award program for non-management employees. The Company's Founder and CEO, Jared Isaacman, will fund half of this program through a contribution of the Founder's Class B and/or Class C shares.