
Q1 2023 SHAREHOLDER LETTER INVESTORS.SHIFT4.COM Exhibit 99.1
Non-GAAP Financial Measures and Key Performance Indicators Safe Harbor Statement and Forward-Looking Information We use supplemental measures of our performance which are derived from our consolidated financial information but which are not presented in our consolidated financial statements prepared in accordance with generally accepted accounting principles ("GAAP"). These non-GAAP financial measures include: gross revenue less network fees, which includes interchange and assessment fees; adjusted net income; adjusted net income per share; free cash flow; adjusted free cash flow; earnings before interest, income taxes, depreciation, and amortization (“EBITDA”); Adjusted EBITDA, Adjusted EBITDA conversion rate; and Adjusted EBITDA margin. Gross revenue less network fees represents a key performance metric that management uses to measure changes in the mix and value derived from our customer base as we continue to execute our strategy to expand our reach to serve larger, complex merchants. Adjusted net income represents net income (loss) adjusted for certain non-cash and other nonrecurring items that management believes are not indicative of ongoing operations, such as acquisition, restructuring and integration costs, revaluation of contingent liabilities, unrealized gain on investments in securities, change in TRA liability, equity-based compensation expense, and other nonrecurring items. Adjusted EBITDA is the primary financial performance measure used by management to evaluate its business and monitor results of operations. Adjusted EBITDA represents EBITDA further adjusted for certain non- cash and other nonrecurring items that management believes are not indicative of ongoing operations. These adjustments include acquisition, restructuring and integration costs, revaluation of contingent liabilities, unrealized gain on investments in securities, change in TRA liability, equity-based compensation expense, and other nonrecurring items. Free cash flow represents net cash provided by operating activities adjusted for non-discretionary capital expenditures. This presentation contains forward-looking statements within the meaning of the Private Securities Litigation Reform Act of 1995. All statements contained in this presentation that do not relate to matters of historical fact should be considered forward-looking statements, including statements regarding Shift4 Payments, Inc.’s (“our”, the “Company” or "Shift4”) expectations regarding new customers; acquisitions and other transactions, including of our sales partners and their residual streams, and our ability to close said transactions on the timeline we expect or at all; our plans and agreements regarding future payment processing commitments; our expectations with respect to economic recovery; our stock price; and anticipated financial performance, including our financial outlook for fiscal year 2023 and future periods. These statements are neither promises nor guarantees, but involve known and unknown risks, uncertainties and other important factors that may cause our actual results, performance or achievements to be materially different from any future results, performance or achievements expressed or implied by the forward-looking statements, including, but not limited to, the following: our ability to differentiate ourselves from our competitors and compete effectively; our ability to anticipate and respond to changing industry trends and merchant and consumer needs; our ability to continue making acquisitions of businesses or assets; our Adjusted Free Cash Flow represents free cash flow further adjusted for certain transactions that are not indicative of future operating cash flows, including settlement activity, which represents the change in our settlement obligation, which fluctuated based on volumes and calendar timing, acquisition, restructuring and integration costs, the impact of timing of annual performance bonuses, other nonrecurring expenses, and nonrecurring strategic capital expenditures that are not indicative of ongoing activities. We believe Adjusted Free Cash Flow is useful to measure the funds generated in a given period that are available to invest in the business, to repurchase stock and to make strategic decisions. We believe this supplemental information enhances shareholders’ ability to evaluate the Company’s performance. The Adjusted EBITDA conversion rate is calculated as Adjusted Free Cash Flow divided by Adjusted EBITDA. We use non-GAAP financial measures to supplement financial information presented on a GAAP basis. We believe that excluding certain items from our GAAP results allows management to better understand our consolidated financial performance from period to period and better project our future consolidated financial performance as forecasts are developed at a level of detail different from that used to prepare GAAP-based financial measures. Moreover, we believe these non-GAAP financial measures provide our stakeholders with useful information to help them evaluate our operating results by facilitating an enhanced understanding of our operating performance and enabling them to make more meaningful period to period comparisons. There are limitations to the use of the non-GAAP financial measures presented in this presentation. Our non-GAAP financial measures may not be comparable to similarly titled measures of other companies. Other companies, including companies in our industry, may calculate non-GAAP financial measures differently than we do, limiting the usefulness of those measures for comparative purposes. The non- GAAP financial measures are not meant to be ability to continue to expand our market share or expand into new markets; our reliance on third-party vendors to provide products and services; our ability to integrate our services and products with operating systems, devices, software and web browsers; our ability to maintain merchant and software partner relationships and strategic partnerships; the effects of global economic, political and other conditions, including inflationary pressure and rising interest rates, on consumer, business and government spending; our compliance with governmental regulation and other legal obligations, particularly related to privacy, data protection and information security, and consumer protection laws; our ability to establish, maintain and enforce effective risk management policies and procedures; our ability to protect our systems and data from continually evolving cybersecurity risks, security breaches and other technological risks; potential harm caused by software defects, computer viruses and development delays; the effect of degradation of the quality of the products and services we offer; potential harm caused by increased customer attrition; potential harm caused by fraud by merchants or others; potential harm caused by damage to our reputation or brands; our ability to recruit, retain and develop qualified personnel; our reliance on a single or limited number of suppliers; the effects of seasonality and volatility on our operating results; the effect of various legal considered as indicators of performance in isolation from or as a substitute for net income (loss) prepared in accordance with GAAP, and should be read only in conjunction with financial information presented on a GAAP basis. Reconciliations each of EBITDA and Adjusted EBITDA, gross revenue less network fees, adjusted net income, adjusted net income per share, free cash flow and Adjusted Free Cash Flow to its most directly comparable GAAP financial measure are presented in Appendix - Financial Information. We are unable to provide a reconciliation of Adjusted Free Cash Flow for 2023 to net cash provided by operating activities, the nearest comparable GAAP measure, without unreasonable efforts. We encourage you to review the reconciliations in conjunction with the presentation of the non-GAAP financial measures for each of the periods presented. In future fiscal periods, we may exclude such items and may incur income and expenses similar to these excluded items. In addition, key performance indicators include end-to-end payment volume, spread and margin. End-to-end payment volume is defined as the total dollar amount of payments that we deliver for settlement on behalf of our merchants. Included in end-to-end volume are dollars routed via our international payments platform and alternative payment methods, including cryptocurrency and stock donations, plus volume we route to one or more third party merchant acquirers on behalf of strategic enterprise merchant relationships, translated to U.S. dollars. This volume does not include volume processed through our legacy gateway-only offering. Spread represents the average yield Shift4 earns on the average end-to-end payment volume processed for a given period after network fees. Spread is calculated as payments-based revenue less gateway revenue and network fees for a given period divided by the end-to-end payment volume processed for the similar period. Adjusted EBITDA Margin represents Adjusted EBITDA divided by gross revenue less network fees. proceedings; our ability to raise additional capital to fund our operations; our ability to protect, enforce and defend our intellectual property rights; our ability to establish and maintain effective internal control over financial reporting and disclosure controls and procedures; our compliance with laws, regulations and enforcement activities that affect our industry; our dependence on distributions from Shift4 Payments, LLC to pay our taxes and expenses, including payments under the Tax Receivable Agreement; the significant influence Rook has over us, including control over decisions that require the approval of stockholders; and the potential impact of any future material weaknesses in our internal control over financial reporting. These and other important factors are described in “Cautionary Note Regarding Forward-Looking Statements” and “Risk Factors” in Part I, Item 1A. in our Annual Report on Form 10-K for the year ended December 31, 2022, and could cause actual results to differ materially from those indicated by the forward-looking statements made in this presentation. Any such forward-looking statements represent management’s estimates as of the date of this presentation. While we may elect to update such forward-looking statements at some point in the future, we disclaim any obligation to do so, even if subsequent events cause our views to change. 2
Dear Shareholders, 3 We just wrapped up what was a reasonably strong quarter. I am especially proud that we have established new quarterly records for volume, gross revenue less network fees, and free cash flow. Simply put, we achieved these results by executing & winning share in a large addressable market. Additionally, we completed a small but important acquisition, and advanced many of our organic initiatives. As a result, we are positively revising our 2023 guidance. Considering we were anticipating a more challenging economic climate, it’s hard not to be cautiously optimistic. More specifically, in Q1 2023 we grew our end-to-end volume, gross revenue, and gross revenue less network fees 66%, 36%, and 34%, respectively versus the comparable period a year ago. The majority of our growth continues to come from our high growth core, which represents restaurants and hotels. This past quarter also benefited from our new verticals, especially Sports & Entertainment including ticketing, as well as Travel, Gaming and our strategic enterprise relationships. Our average customer size has increased 230% over the last 3 years and we now serve approximately 50 enterprise merchants that process in excess of $100 million a year in payments and over 70 on our gateway that we are working on converting to our end-to-end offering. This quarter, we added several new signature merchants including a mega resort in Arizona called VAI, as well as the Chicago White Sox, Washington Commanders, and two large Las Vegas properties that we are not permitted to disclose. Additionally, we signed an agreement with Six Flags theme parks to use our software and payment technology for their food and beverage operations. Keep in mind, we also get excited when we renew and expand our relationship with existing merchants. For example, we renewed & expanded our agreements with two major undisclosed hospitality operators. We now have a hunting license to promote SkyTab POS across hundreds of hotel properties, and will deploy our VenueNext mobile software in the other resort operator. The Shift4 story is about more than moving the top line. We have been EBITDA positive for nearly 20 years and self-funded through our first 15 years in business. This past quarter, we generated net income of $20.4 million versus a net loss of ($13.2) million a year ago, and we increased our Adjusted EBITDA 102% over the similar period. Considering how quickly we are generating cash and deleveraging, the Board has authorized a $250 million share buyback program. Although there are clearly other capital allocation priorities as well. The expanding profitability profile of the company is being driven by our move upmarket to enterprise merchants as well as the largely direct-sales approach we have taken with our new SkyTab POS program. Additionally, we remain very disciplined with the goal of keeping expenses & headcount as flat as possible exiting 2022. To sustain our growth, we fully expect to upgrade talent throughout the year, we just don’t plan to add to it.
4 As mentioned above, consumer spending largely exceeded our expectations. Like others have reported, we did see a bit of a moderation in March. Some have attributed this to the short-lived banking crisis, others to lower tax refunds. While it is possible that this moderation was an anomaly, we are not ignoring it with respect to our upwardly revised guidance. It is worth highlighting, that as we diversify into new verticals, restaurants no longer represent the majority of the volume we process, but still represent the highest take rates. Alongside a great team, I have personally always enjoyed the challenge of building and growing a business. You can tell we are not afraid of the challenge; we went public June 5th 2020 during the earliest months of the pandemic. We have battled through industry disruptors, two recessions, a pandemic, social and political unrest, red hot inflation, rising interest rates, a banking crisis and more than our fair share of unsubstantiated critics. After 24 years in business, I can’t help but think that the more we are tested and the more we battle, the stronger, wiser and more effective we become. As always, I welcome all your feedback, including business opportunities, areas of improvement and general suggestions. Please don’t hesitate to contact me directly. Boldly Forward, Jared Isaacman CEO jared@shift4.com
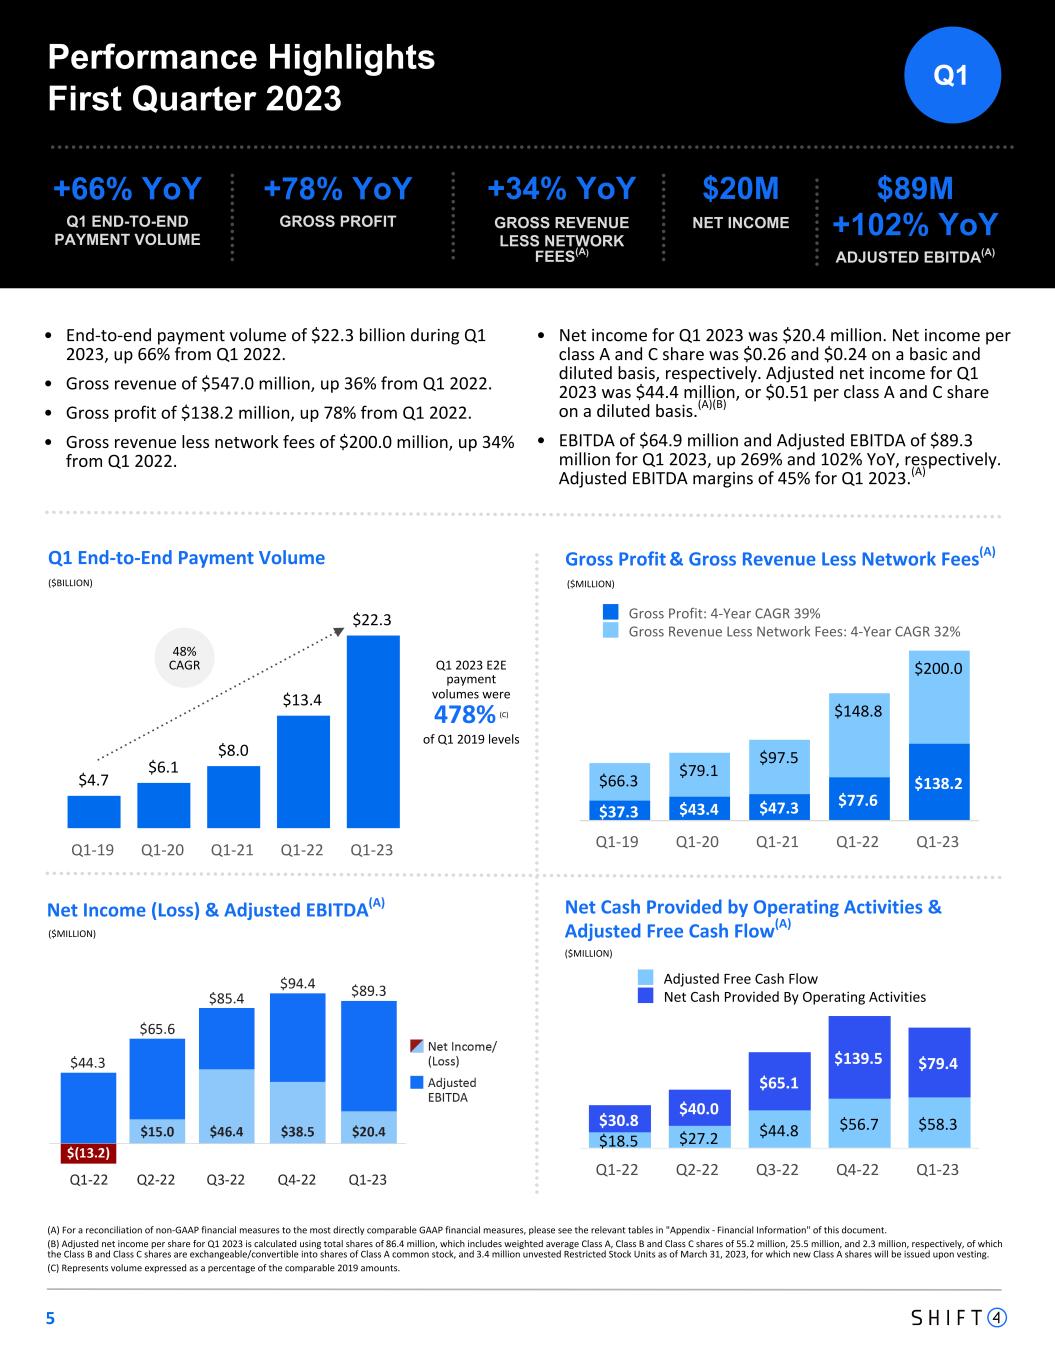
Q1 2023 E2E payment volumes were 478% (C) of Q1 2019 levels $4.7 $6.1 $8.0 $13.4 $22.3 Q1-19 Q1-20 Q1-21 Q1-22 Q1-23 (A) For a reconciliation of non-GAAP financial measures to the most directly comparable GAAP financial measures, please see the relevant tables in "Appendix - Financial Information" of this document. (B) Adjusted net income per share for Q1 2023 is calculated using total shares of 86.4 million, which includes weighted average Class A, Class B and Class C shares of 55.2 million, 25.5 million, and 2.3 million, respectively, of which the Class B and Class C shares are exchangeable/convertible into shares of Class A common stock, and 3.4 million unvested Restricted Stock Units as of March 31, 2023, for which new Class A shares will be issued upon vesting. (C) Represents volume expressed as a percentage of the comparable 2019 amounts. 5 Q1 End-to-End Payment Volume Gross Profit & Gross Revenue Less Network Fees(A) ($BILLION) Performance Highlights First Quarter 2023 +66% YoY Q1 END-TO-END PAYMENT VOLUME $37.3 $43.4 $47.3 $77.6 $138.2$66.3 $79.1 $97.5 $148.8 $200.0 Gross Profit: 4-Year CAGR 39% Gross Revenue Less Network Fees: 4-Year CAGR 32% Q1-19 Q1-20 Q1-21 Q1-22 Q1-23 48% CAGR Net Income (Loss) & Adjusted EBITDA(A) $18.5 $27.2 $44.8 $56.7 $58.3$30.8 $40.0 $65.1 $139.5 $79.4 Adjusted Free Cash Flow Net Cash Provided By Operating Activities Q1-22 Q2-22 Q3-22 Q4-22 Q1-23 Net Cash Provided by Operating Activities & Adjusted Free Cash Flow(A) ($MILLION) ($MILLION) ($MILLION) +78% YoY GROSS PROFIT $20M NET INCOME • $89M +102% YoY ADJUSTED EBITDA(A) +34% YoY GROSS REVENUE LESS NETWORK FEES(A) • End-to-end payment volume of $22.3 billion during Q1 2023, up 66% from Q1 2022. • Gross revenue of $547.0 million, up 36% from Q1 2022. • Gross profit of $138.2 million, up 78% from Q1 2022. • Gross revenue less network fees of $200.0 million, up 34% from Q1 2022. • Net income for Q1 2023 was $20.4 million. Net income per class A and C share was $0.26 and $0.24 on a basic and diluted basis, respectively. Adjusted net income for Q1 2023 was $44.4 million, or $0.51 per class A and C share on a diluted basis.(A)(B) • EBITDA of $64.9 million and Adjusted EBITDA of $89.3 million for Q1 2023, up 269% and 102% YoY, respectively. Adjusted EBITDA margins of 45% for Q1 2023.(A) Q1
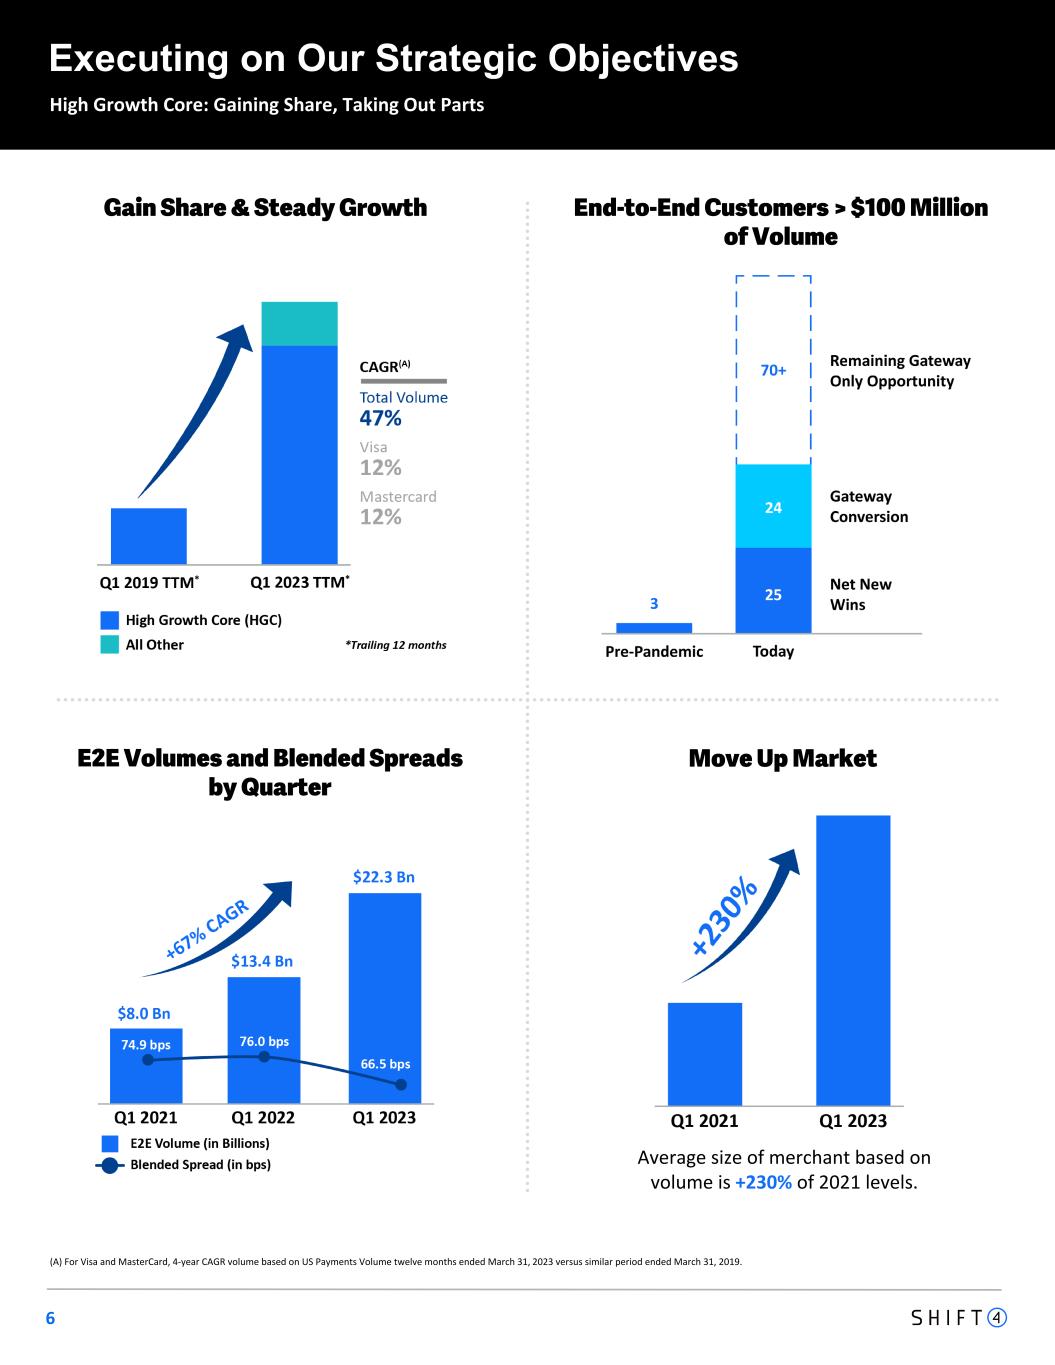
6 E2E Volumes and Blended Spreads by Quarter Gain Share & Steady Growth End-to-End Customers > $100 Million of Volume High Growth Core: Gaining Share, Taking Out Parts Executing on Our Strategic Objectives (A) For Visa and MasterCard, 4-year CAGR volume based on US Payments Volume twelve months ended March 31, 2023 versus similar period ended March 31, 2019. Average size of merchant based on volume is +230% of 2021 levels. Move Up Market
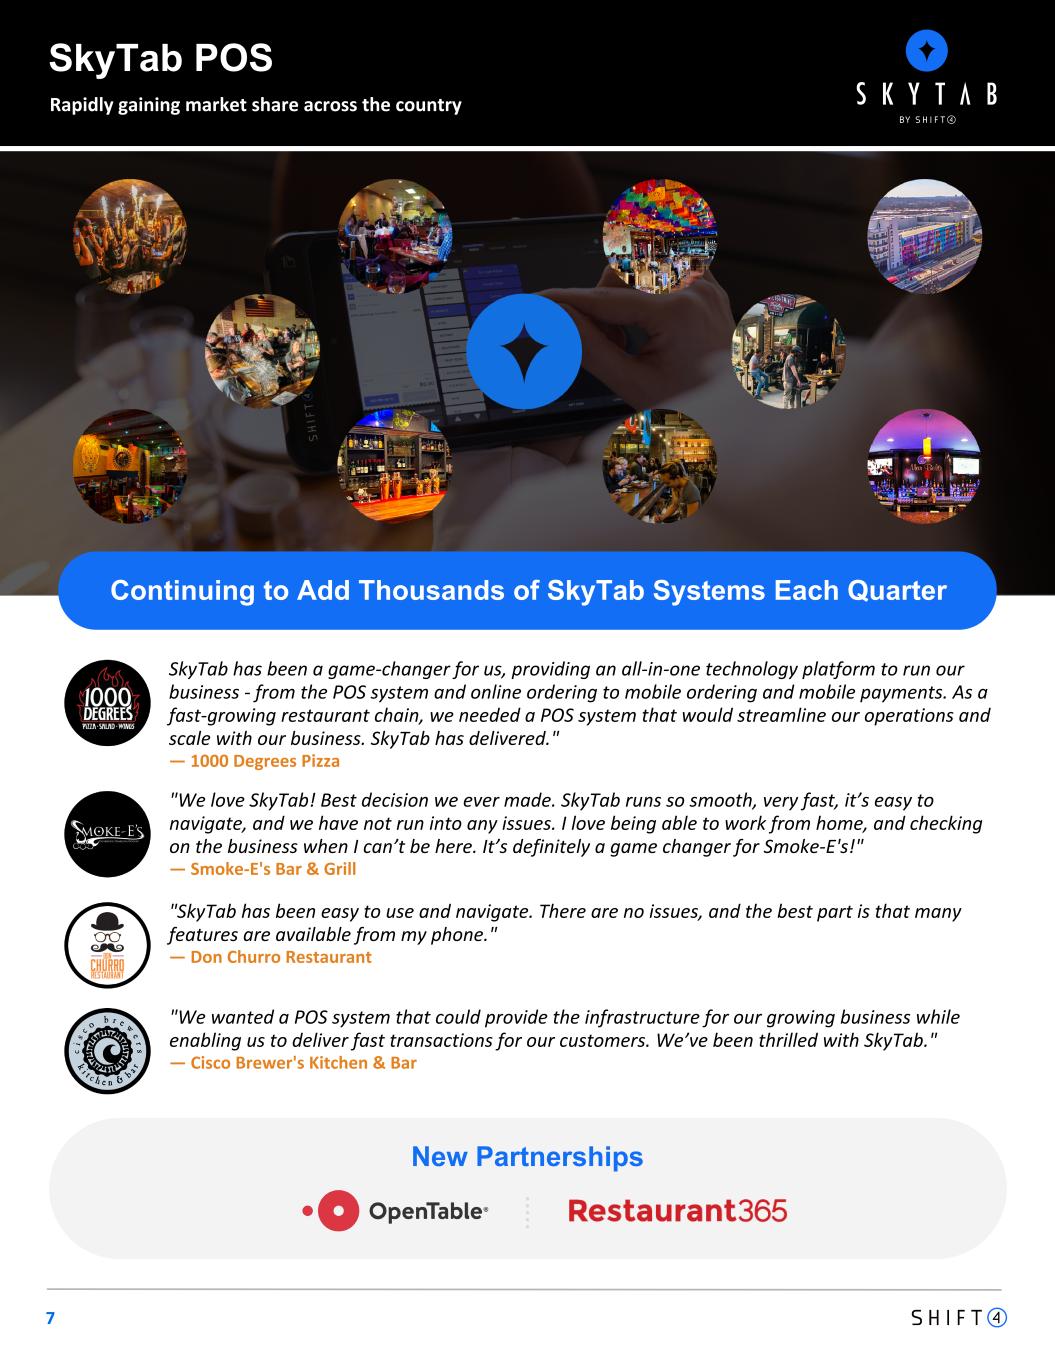
7 SkyTab POS Rapidly gaining market share across the country Continuing to Add Thousands of SkyTab Systems Each Quarter "We love SkyTab! Best decision we ever made. SkyTab runs so smooth, very fast, it’s easy to navigate, and we have not run into any issues. I love being able to work from home, and checking on the business when I can’t be here. It’s definitely a game changer for Smoke-E's!" — Smoke-E's Bar & Grill "SkyTab has been easy to use and navigate. There are no issues, and the best part is that many features are available from my phone." — Don Churro Restaurant "We wanted a POS system that could provide the infrastructure for our growing business while enabling us to deliver fast transactions for our customers. We’ve been thrilled with SkyTab." — Cisco Brewer's Kitchen & Bar New Partnerships SkyTab has been a game-changer for us, providing an all-in-one technology platform to run our business - from the POS system and online ordering to mobile ordering and mobile payments. As a fast-growing restaurant chain, we needed a POS system that would streamline our operations and scale with our business. SkyTab has delivered." — 1000 Degrees Pizza
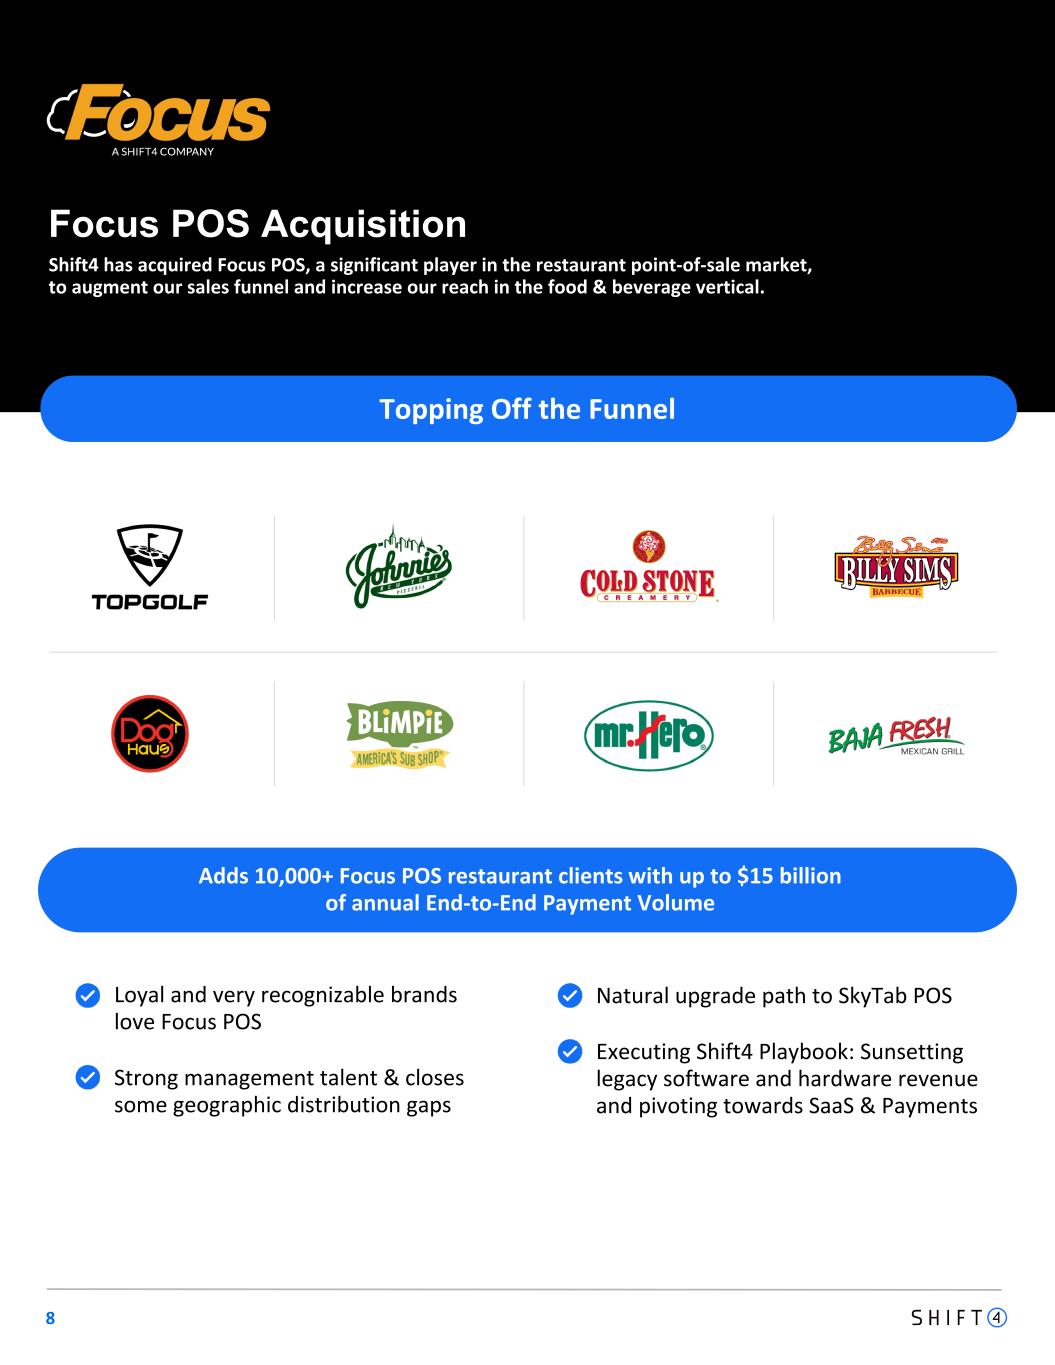
8 Focus POS Acquisition Shift4 has acquired Focus POS, a significant player in the restaurant point-of-sale market, to augment our sales funnel and increase our reach in the food & beverage vertical. Topping Off the Funnel Loyal and very recognizable brands love Focus POS Strong management talent & closes some geographic distribution gaps Natural upgrade path to SkyTab POS Executing Shift4 Playbook: Sunsetting legacy software and hardware revenue and pivoting towards SaaS & Payments Adds 10,000+ Focus POS restaurant clients with up to $15 billion of annual End-to-End Payment Volume

9 High Growth Core Continuing to expand market share in our fast-growing core verticals Denotes Gateway Conversion★ The Lucerne Hotel offers excellent accommodations in the heart of Manhattan's Upper West Side, with onsite meeting and event facilities as well as four-star dining at Nice Matin, voted one of the city’s best restaurants by New York Magazine. The Lucerne This AAA Four-Diamond oceanfront resort in Atlantic Beach, FL features lavish rooms and suites, award- winning cuisine, ample event space, and luxurious spa facilities. One Ocean Resort This 12-acre resort in Fort Myers, FL features beachfront accommodations, meeting facilities, a relaxing spa, full-service marina, and two restaurants. The Pink Shell Beach Resort With 10 locations across the country, King’s combines high quality food and “crafty cocktails” with an upscale bowling experience to provide the premier social gaming and entertainment venue. King’s Dining & Entertainment Featured on the Food Network’s “Diners, Drive-ins, and Dives”, this unique business in Sioux Falls, ID features a retail market as well as a large food hall, brewery, and multiple outdoor patios. Look’s Marketplace Voted the #1 family resort in the US 3 times in the past 5 years by USA Today, Woodloch includes world- class accommodations, a luxurious spa, and a championship golf course recognized by GOLF Magazine as "one of the finest courses in America." Woodloch Spa Resort ★ ★ This brand new mega-resort in Glendale, AZ will feature four unique hotel towers, a five- acre pool, world-class spa and fitness facilities, 40,000 square feet of event space, 12 onsite restaurants, 10 bars, a two-story nightclub, a multi-level concert amphitheater, and Konos Island, the first man-made party island in the US. ★ ★ ★
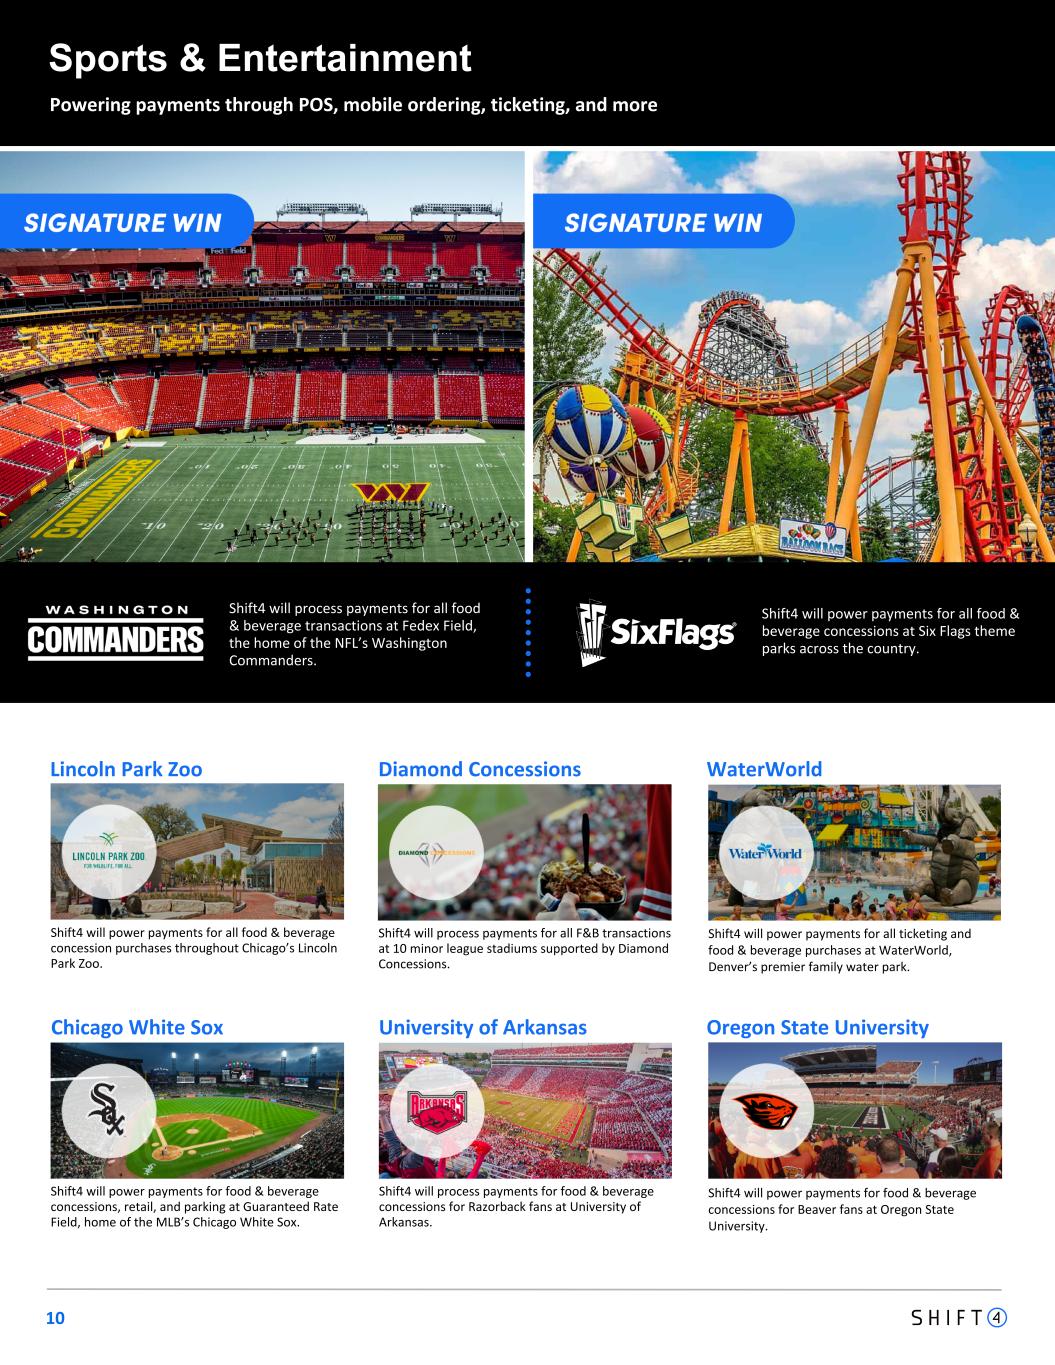
10 Sports & Entertainment Powering payments through POS, mobile ordering, ticketing, and more Diamond Concessions Shift4 will process payments for food & beverage concessions for Razorback fans at University of Arkansas. University of Arkansas Chicago White Sox Shift4 will power payments for food & beverage concessions, retail, and parking at Guaranteed Rate Field, home of the MLB’s Chicago White Sox. Shift4 will power payments for all food & beverage concession purchases throughout Chicago’s Lincoln Park Zoo. Lincoln Park Zoo WaterWorld Oregon State University Shift4 will power payments for all ticketing and food & beverage purchases at WaterWorld, Denver’s premier family water park. Shift4 will power payments for food & beverage concessions for Beaver fans at Oregon State University. Shift4 will process payments for all food & beverage transactions at Fedex Field, the home of the NFL’s Washington Commanders. Shift4 will process payments for all F&B transactions at 10 minor league stadiums supported by Diamond Concessions. Shift4 will power payments for all food & beverage concessions at Six Flags theme parks across the country.
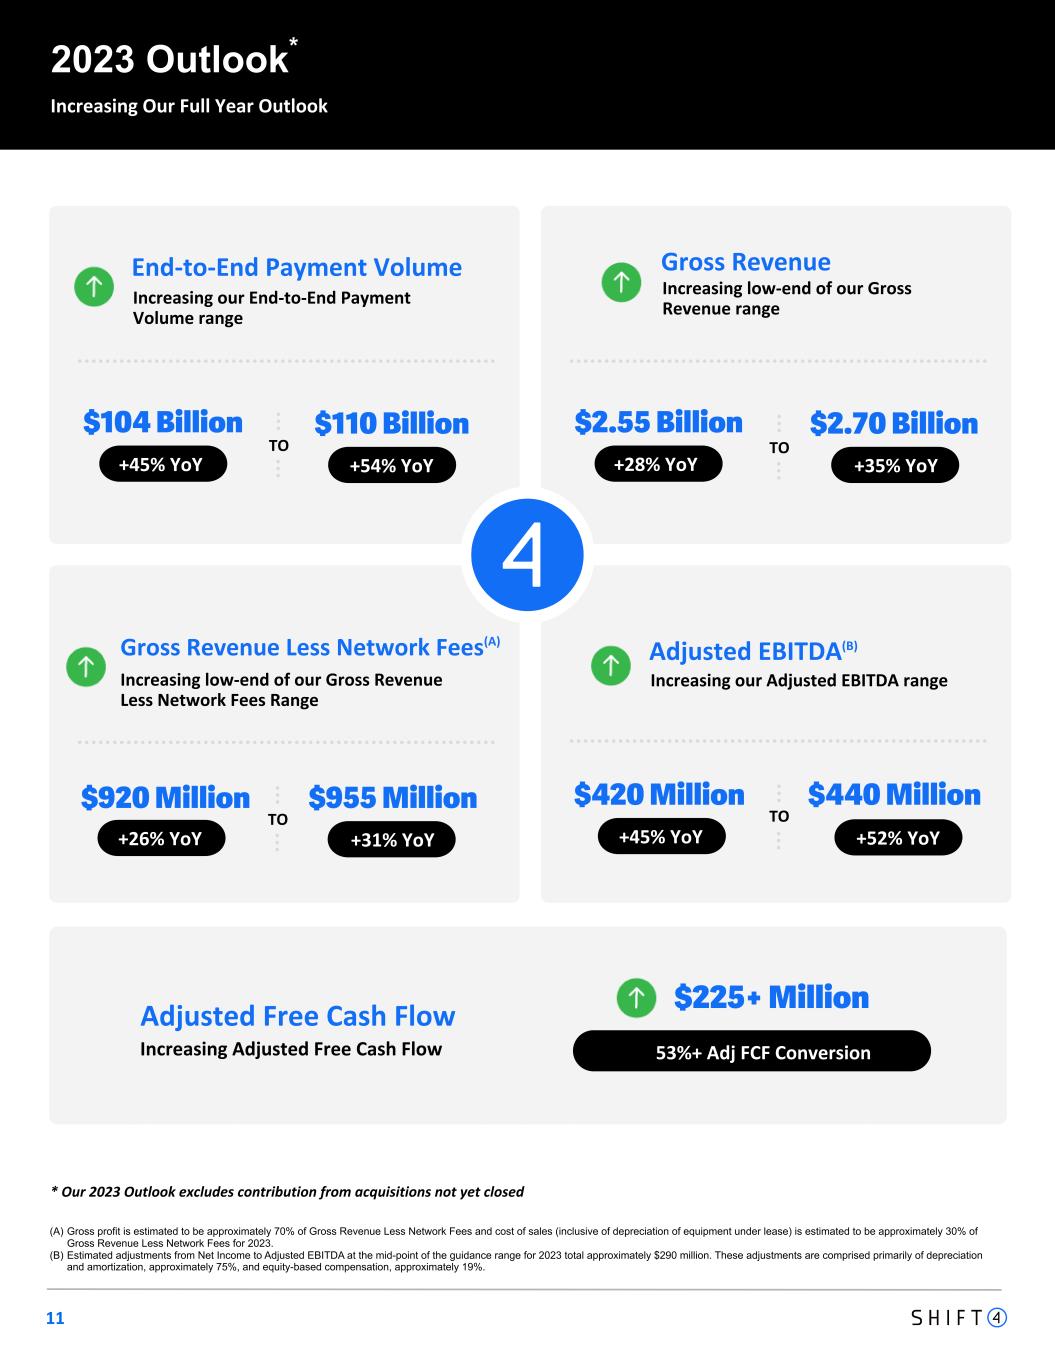
11 (A) Gross profit is estimated to be approximately 70% of Gross Revenue Less Network Fees and cost of sales (inclusive of depreciation of equipment under lease) is estimated to be approximately 30% of Gross Revenue Less Network Fees for 2023. (B) Estimated adjustments from Net Income to Adjusted EBITDA at the mid-point of the guidance range for 2023 total approximately $290 million. These adjustments are comprised primarily of depreciation and amortization, approximately 75%, and equity-based compensation, approximately 19%. * Our 2023 Outlook excludes contribution from acquisitions not yet closed 2023 Outlook* Increasing Our Full Year Outlook $104 Billion +45% YoY +54% YoY $110 Billion $2.55 Billion +28% YoY +35% YoY $2.70 Billion TO TO 53%+ Adj FCF Conversion $225+ Million Increasing our End-to-End Payment Volume range End-to-End Payment Volume Increasing low-end of our Gross Revenue range Gross Revenue Increasing low-end of our Gross Revenue Less Network Fees Range Gross Revenue Less Network Fees(A) TO $920 Million +26% YoY +31% YoY $955 Million Increasing our Adjusted EBITDA range Adjusted EBITDA(B) $420 Million +45% YoY +52% YoY $440 Million TO Increasing Adjusted Free Cash Flow Adjusted Free Cash Flow
Appendix - Financial Information 12
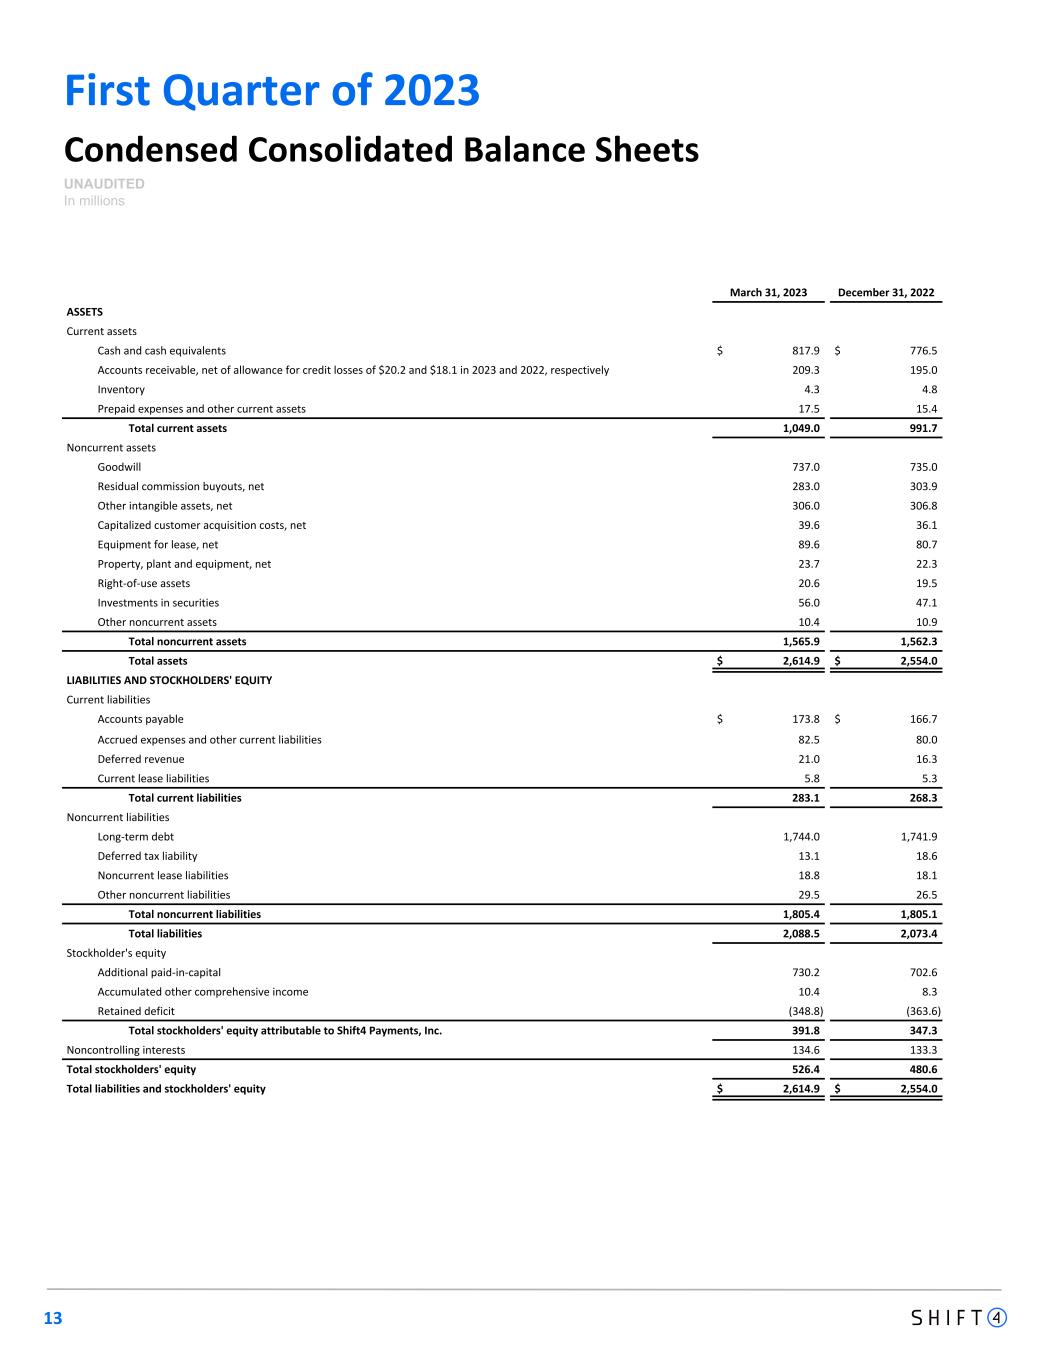
13 First Quarter of 2023 Condensed Consolidated Balance Sheets UNAUDITED In millions March 31, 2023 December 31, 2022 ASSETS Current assets Cash and cash equivalents $ 817.9 $ 776.5 Accounts receivable, net of allowance for credit losses of $20.2 and $18.1 in 2023 and 2022, respectively 209.3 195.0 Inventory 4.3 4.8 Prepaid expenses and other current assets 17.5 15.4 Total current assets 1,049.0 991.7 Noncurrent assets Goodwill 737.0 735.0 Residual commission buyouts, net 283.0 303.9 Other intangible assets, net 306.0 306.8 Capitalized customer acquisition costs, net 39.6 36.1 Equipment for lease, net 89.6 80.7 Property, plant and equipment, net 23.7 22.3 Right-of-use assets 20.6 19.5 Investments in securities 56.0 47.1 Other noncurrent assets 10.4 10.9 Total noncurrent assets 1,565.9 1,562.3 Total assets $ 2,614.9 $ 2,554.0 LIABILITIES AND STOCKHOLDERS' EQUITY Current liabilities Accounts payable $ 173.8 $ 166.7 Accrued expenses and other current liabilities 82.5 80.0 Deferred revenue 21.0 16.3 Current lease liabilities 5.8 5.3 Total current liabilities 283.1 268.3 Noncurrent liabilities Long-term debt 1,744.0 1,741.9 Deferred tax liability 13.1 18.6 Noncurrent lease liabilities 18.8 18.1 Other noncurrent liabilities 29.5 26.5 Total noncurrent liabilities 1,805.4 1,805.1 Total liabilities 2,088.5 2,073.4 Stockholder's equity Additional paid-in-capital 730.2 702.6 Accumulated other comprehensive income 10.4 8.3 Retained deficit (348.8) (363.6) Total stockholders' equity attributable to Shift4 Payments, Inc. 391.8 347.3 Noncontrolling interests 134.6 133.3 Total stockholders' equity 526.4 480.6 Total liabilities and stockholders' equity $ 2,614.9 $ 2,554.0
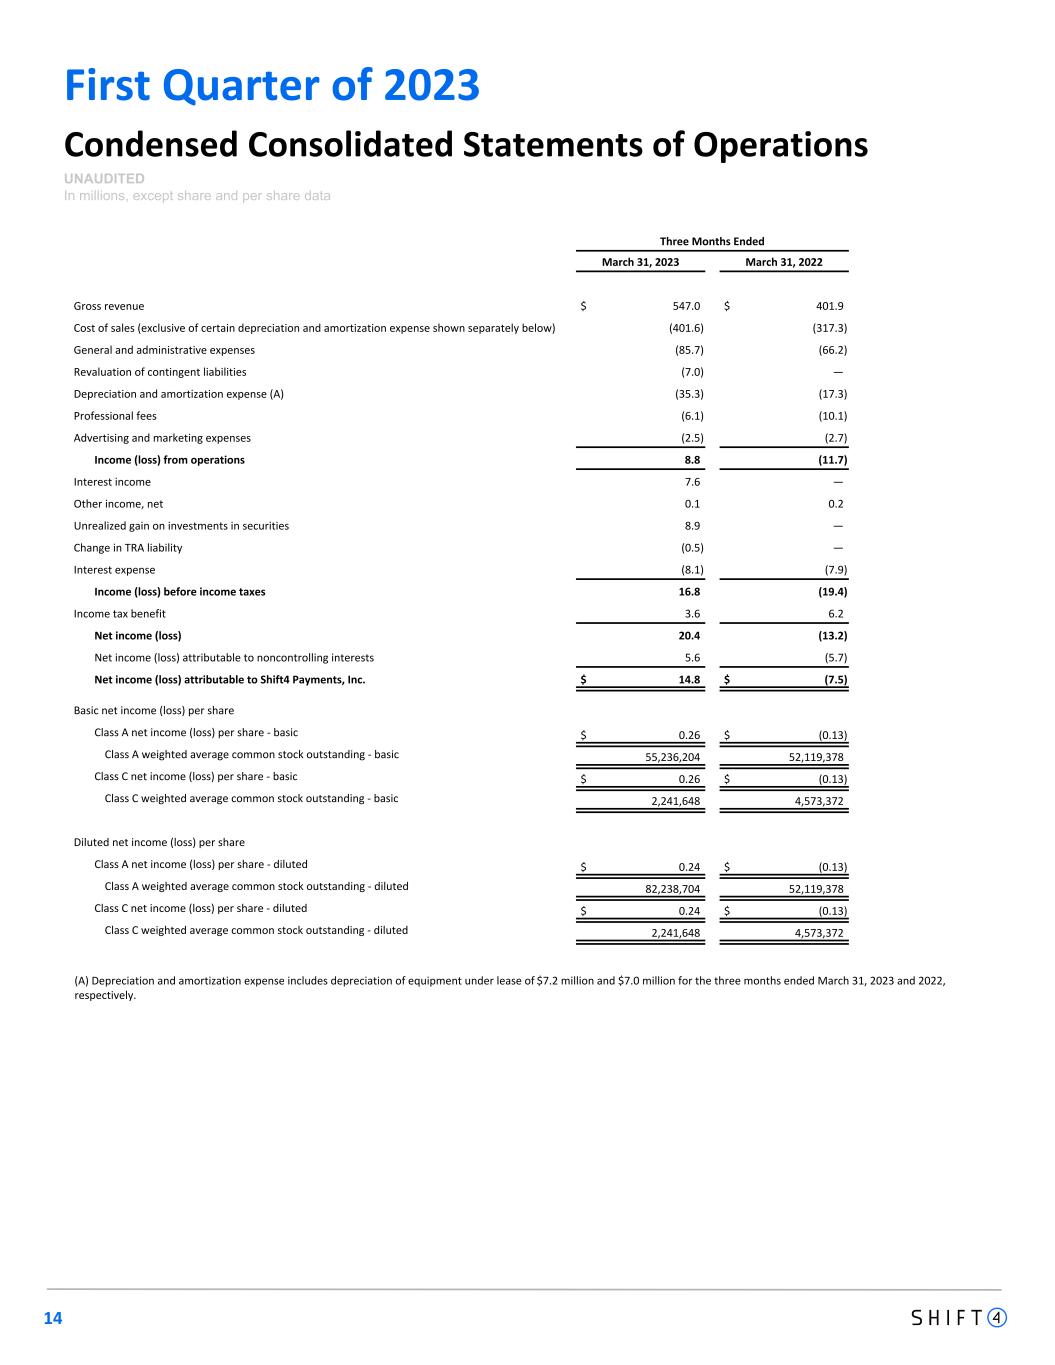
14 First Quarter of 2023 Condensed Consolidated Statements of Operations UNAUDITED In millions, except share and per share data Three Months Ended March 31, 2023 March 31, 2022 Gross revenue $ 547.0 $ 401.9 Cost of sales (exclusive of certain depreciation and amortization expense shown separately below) (401.6) (317.3) General and administrative expenses (85.7) (66.2) Revaluation of contingent liabilities (7.0) — Depreciation and amortization expense (A) (35.3) (17.3) Professional fees (6.1) (10.1) Advertising and marketing expenses (2.5) (2.7) Income (loss) from operations 8.8 (11.7) Interest income 7.6 — Other income, net 0.1 0.2 Unrealized gain on investments in securities 8.9 — Change in TRA liability (0.5) — Interest expense (8.1) (7.9) Income (loss) before income taxes 16.8 (19.4) Income tax benefit 3.6 6.2 Net income (loss) 20.4 (13.2) Net income (loss) attributable to noncontrolling interests 5.6 (5.7) Net income (loss) attributable to Shift4 Payments, Inc. $ 14.8 $ (7.5) Basic net income (loss) per share Class A net income (loss) per share - basic $ 0.26 $ (0.13) Class A weighted average common stock outstanding - basic 55,236,204 52,119,378 Class C net income (loss) per share - basic $ 0.26 $ (0.13) Class C weighted average common stock outstanding - basic 2,241,648 4,573,372 Diluted net income (loss) per share Class A net income (loss) per share - diluted $ 0.24 $ (0.13) Class A weighted average common stock outstanding - diluted 82,238,704 52,119,378 Class C net income (loss) per share - diluted $ 0.24 $ (0.13) Class C weighted average common stock outstanding - diluted 2,241,648 4,573,372 (A) Depreciation and amortization expense includes depreciation of equipment under lease of $7.2 million and $7.0 million for the three months ended March 31, 2023 and 2022, respectively.
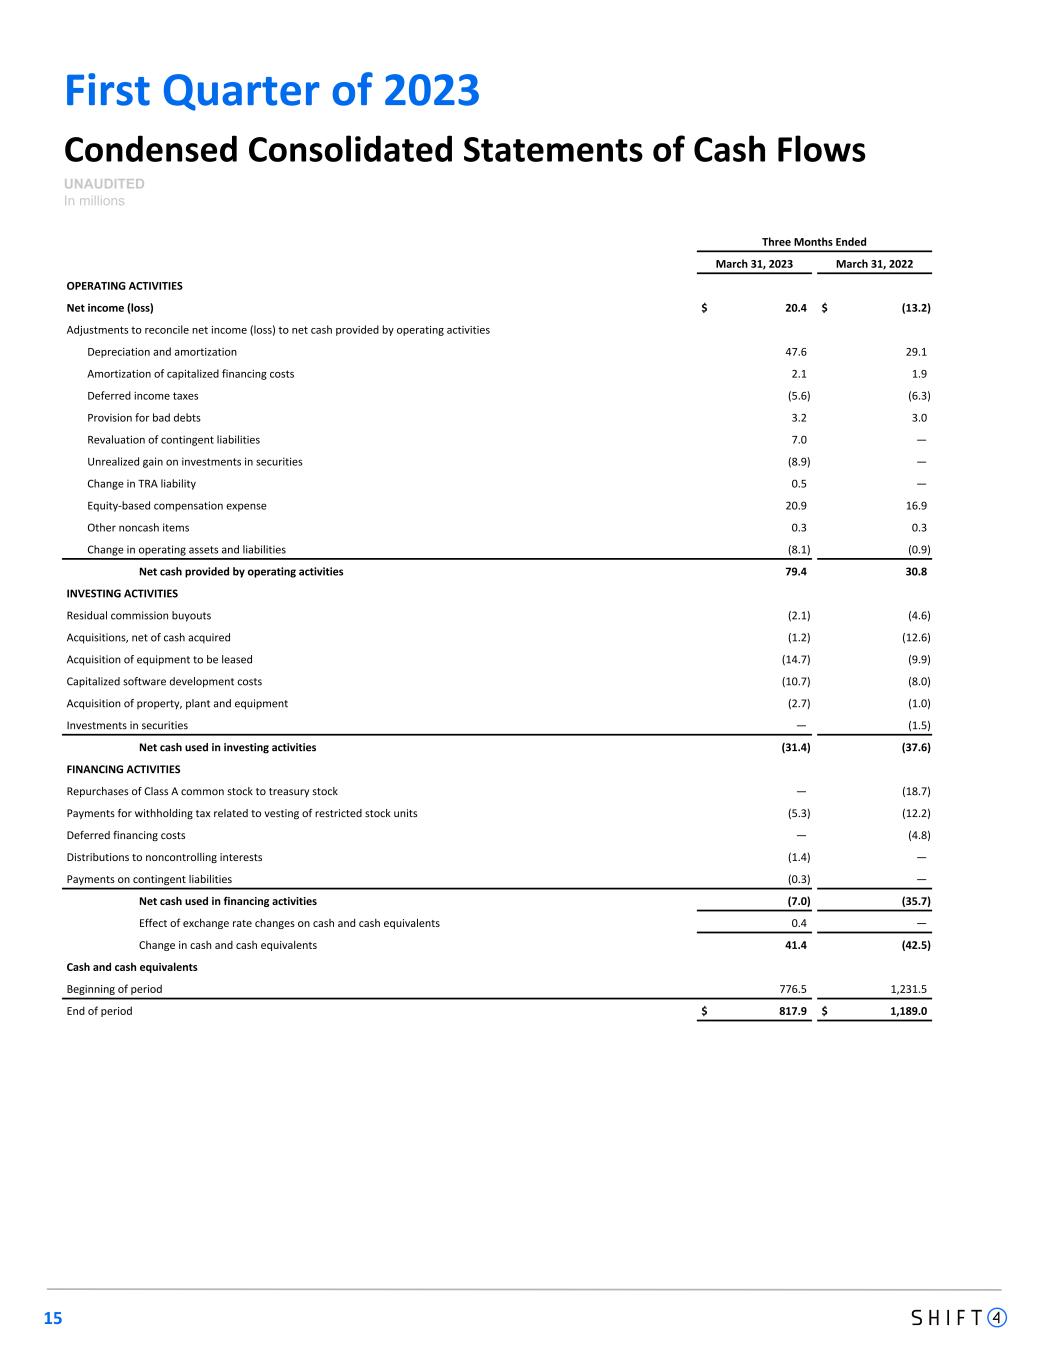
First Quarter of 2023 15 Condensed Consolidated Statements of Cash Flows UNAUDITED In millions Three Months Ended March 31, 2023 March 31, 2022 OPERATING ACTIVITIES Net income (loss) $ 20.4 $ (13.2) Adjustments to reconcile net income (loss) to net cash provided by operating activities Depreciation and amortization 47.6 29.1 Amortization of capitalized financing costs 2.1 1.9 Deferred income taxes (5.6) (6.3) Provision for bad debts 3.2 3.0 Revaluation of contingent liabilities 7.0 — Unrealized gain on investments in securities (8.9) — Change in TRA liability 0.5 — Equity-based compensation expense 20.9 16.9 Other noncash items 0.3 0.3 Change in operating assets and liabilities (8.1) (0.9) Net cash provided by operating activities 79.4 30.8 INVESTING ACTIVITIES Residual commission buyouts (2.1) (4.6) Acquisitions, net of cash acquired (1.2) (12.6) Acquisition of equipment to be leased (14.7) (9.9) Capitalized software development costs (10.7) (8.0) Acquisition of property, plant and equipment (2.7) (1.0) Investments in securities — (1.5) Net cash used in investing activities (31.4) (37.6) FINANCING ACTIVITIES Repurchases of Class A common stock to treasury stock — (18.7) Payments for withholding tax related to vesting of restricted stock units (5.3) (12.2) Deferred financing costs — (4.8) Distributions to noncontrolling interests (1.4) — Payments on contingent liabilities (0.3) — Net cash used in financing activities (7.0) (35.7) Effect of exchange rate changes on cash and cash equivalents 0.4 — Change in cash and cash equivalents 41.4 (42.5) Cash and cash equivalents Beginning of period 776.5 1,231.5 End of period $ 817.9 $ 1,189.0
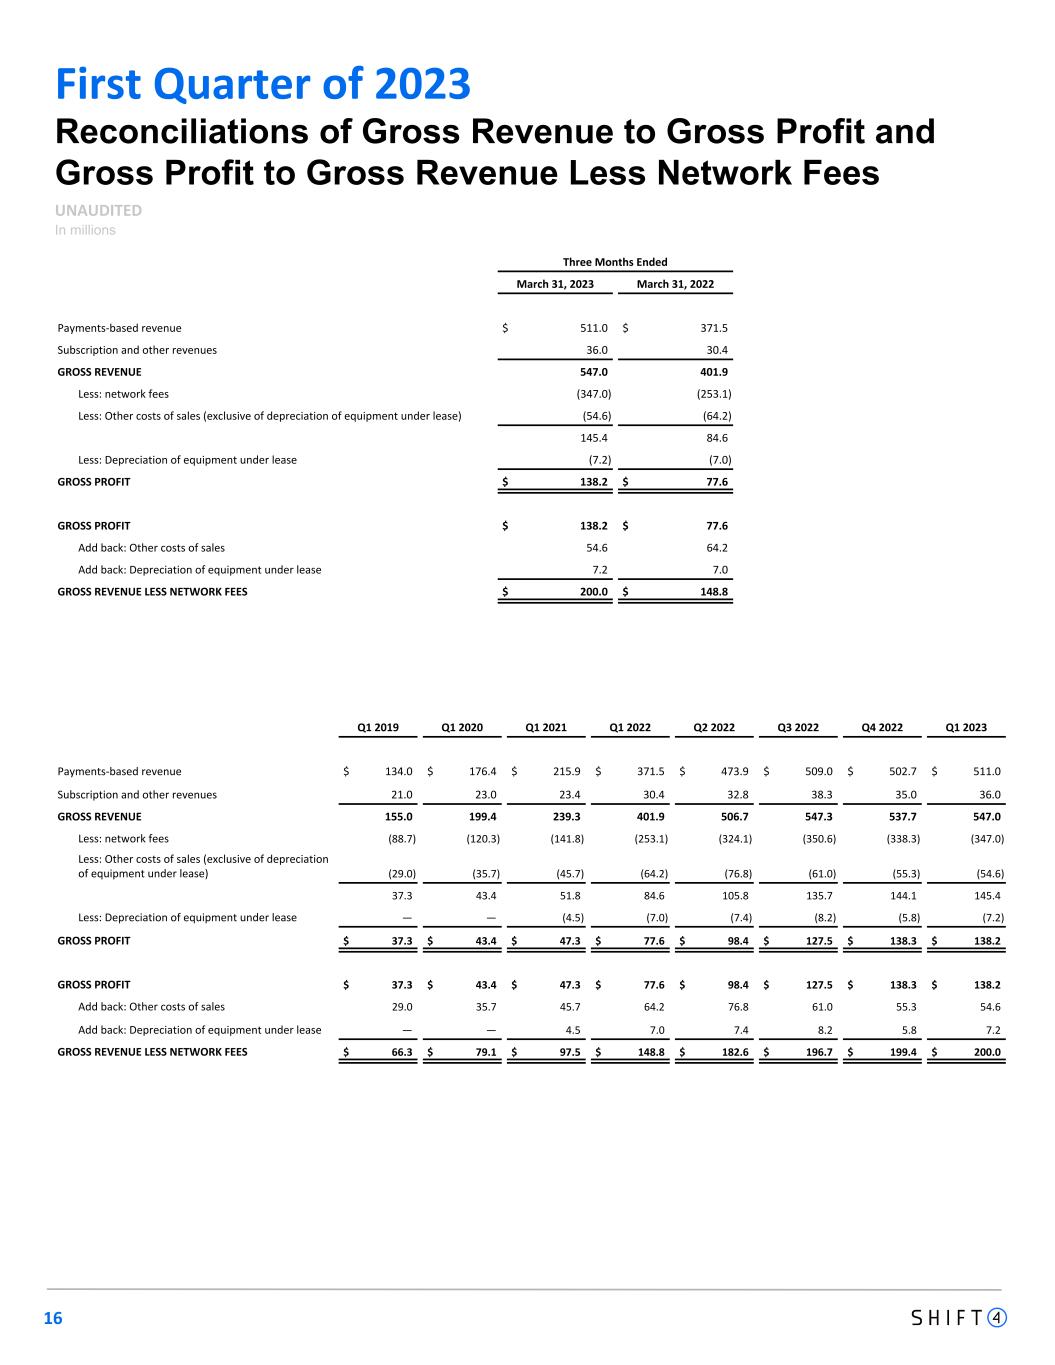
First Quarter of 2023 Reconciliations of Gross Revenue to Gross Profit and Gross Profit to Gross Revenue Less Network Fees UNAUDITED In millions Three Months Ended March 31, 2023 March 31, 2022 Payments-based revenue $ 511.0 $ 371.5 Subscription and other revenues 36.0 30.4 GROSS REVENUE 547.0 401.9 Less: network fees (347.0) (253.1) Less: Other costs of sales (exclusive of depreciation of equipment under lease) (54.6) (64.2) 145.4 84.6 Less: Depreciation of equipment under lease (7.2) (7.0) GROSS PROFIT $ 138.2 $ 77.6 GROSS PROFIT $ 138.2 $ 77.6 Add back: Other costs of sales 54.6 64.2 Add back: Depreciation of equipment under lease 7.2 7.0 GROSS REVENUE LESS NETWORK FEES $ 200.0 $ 148.8 16 Q1 2019 Q1 2020 Q1 2021 Q1 2022 Q2 2022 Q3 2022 Q4 2022 Q1 2023 Payments-based revenue $ 134.0 $ 176.4 $ 215.9 $ 371.5 $ 473.9 $ 509.0 $ 502.7 $ 511.0 Subscription and other revenues 21.0 23.0 23.4 30.4 32.8 38.3 35.0 36.0 GROSS REVENUE 155.0 199.4 239.3 401.9 506.7 547.3 537.7 547.0 Less: network fees (88.7) (120.3) (141.8) (253.1) (324.1) (350.6) (338.3) (347.0) Less: Other costs of sales (exclusive of depreciation of equipment under lease) (29.0) (35.7) (45.7) (64.2) (76.8) (61.0) (55.3) (54.6) 37.3 43.4 51.8 84.6 105.8 135.7 144.1 145.4 Less: Depreciation of equipment under lease — — (4.5) (7.0) (7.4) (8.2) (5.8) (7.2) GROSS PROFIT $ 37.3 $ 43.4 $ 47.3 $ 77.6 $ 98.4 $ 127.5 $ 138.3 $ 138.2 GROSS PROFIT $ 37.3 $ 43.4 $ 47.3 $ 77.6 $ 98.4 $ 127.5 $ 138.3 $ 138.2 Add back: Other costs of sales 29.0 35.7 45.7 64.2 76.8 61.0 55.3 54.6 Add back: Depreciation of equipment under lease — — 4.5 7.0 7.4 8.2 5.8 7.2 GROSS REVENUE LESS NETWORK FEES $ 66.3 $ 79.1 $ 97.5 $ 148.8 $ 182.6 $ 196.7 $ 199.4 $ 200.0
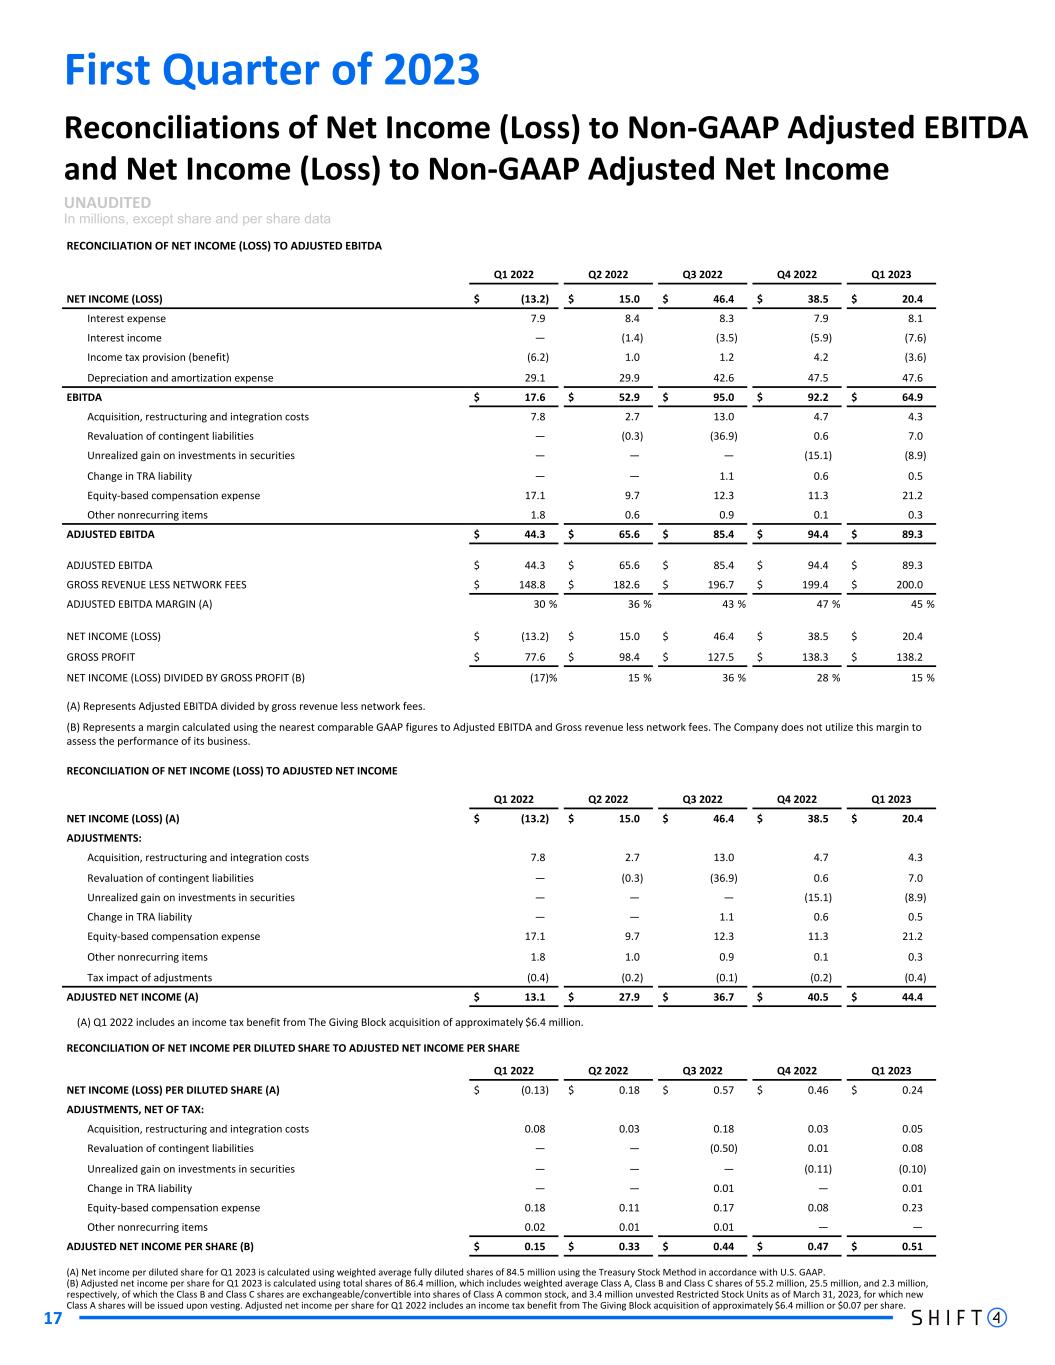
First Quarter of 2023 17 Reconciliations of Net Income (Loss) to Non-GAAP Adjusted EBITDA and Net Income (Loss) to Non-GAAP Adjusted Net Income UNAUDITED In millions, except share and per share data RECONCILIATION OF NET INCOME (LOSS) TO ADJUSTED EBITDA Q1 2022 Q2 2022 Q3 2022 Q4 2022 Q1 2023 NET INCOME (LOSS) $ (13.2) $ 15.0 $ 46.4 $ 38.5 $ 20.4 Interest expense 7.9 8.4 8.3 7.9 8.1 Interest income — (1.4) (3.5) (5.9) (7.6) Income tax provision (benefit) (6.2) 1.0 1.2 4.2 (3.6) Depreciation and amortization expense 29.1 29.9 42.6 47.5 47.6 EBITDA $ 17.6 $ 52.9 $ 95.0 $ 92.2 $ 64.9 Acquisition, restructuring and integration costs 7.8 2.7 13.0 4.7 4.3 Revaluation of contingent liabilities — (0.3) (36.9) 0.6 7.0 Unrealized gain on investments in securities — — — (15.1) (8.9) Change in TRA liability — — 1.1 0.6 0.5 Equity-based compensation expense 17.1 9.7 12.3 11.3 21.2 Other nonrecurring items 1.8 0.6 0.9 0.1 0.3 ADJUSTED EBITDA $ 44.3 $ 65.6 $ 85.4 $ 94.4 $ 89.3 ADJUSTED EBITDA $ 44.3 $ 65.6 $ 85.4 $ 94.4 $ 89.3 GROSS REVENUE LESS NETWORK FEES $ 148.8 $ 182.6 $ 196.7 $ 199.4 $ 200.0 ADJUSTED EBITDA MARGIN (A) 30 % 36 % 43 % 47 % 45 % NET INCOME (LOSS) $ (13.2) $ 15.0 $ 46.4 $ 38.5 $ 20.4 GROSS PROFIT $ 77.6 $ 98.4 $ 127.5 $ 138.3 $ 138.2 NET INCOME (LOSS) DIVIDED BY GROSS PROFIT (B) (17) % 15 % 36 % 28 % 15 % (A) Represents Adjusted EBITDA divided by gross revenue less network fees. (B) Represents a margin calculated using the nearest comparable GAAP figures to Adjusted EBITDA and Gross revenue less network fees. The Company does not utilize this margin to assess the performance of its business. RECONCILIATION OF NET INCOME (LOSS) TO ADJUSTED NET INCOME Q1 2022 Q2 2022 Q3 2022 Q4 2022 Q1 2023 NET INCOME (LOSS) (A) $ (13.2) $ 15.0 $ 46.4 $ 38.5 $ 20.4 ADJUSTMENTS: Acquisition, restructuring and integration costs 7.8 2.7 13.0 4.7 4.3 Revaluation of contingent liabilities — (0.3) (36.9) 0.6 7.0 Unrealized gain on investments in securities — — — (15.1) (8.9) Change in TRA liability — — 1.1 0.6 0.5 Equity-based compensation expense 17.1 9.7 12.3 11.3 21.2 Other nonrecurring items 1.8 1.0 0.9 0.1 0.3 Tax impact of adjustments (0.4) (0.2) (0.1) (0.2) (0.4) ADJUSTED NET INCOME (A) $ 13.1 $ 27.9 $ 36.7 $ 40.5 $ 44.4 (A) Q1 2022 includes an income tax benefit from The Giving Block acquisition of approximately $6.4 million. RECONCILIATION OF NET INCOME PER DILUTED SHARE TO ADJUSTED NET INCOME PER SHARE Q1 2022 Q2 2022 Q3 2022 Q4 2022 Q1 2023 NET INCOME (LOSS) PER DILUTED SHARE (A) $ (0.13) $ 0.18 $ 0.57 $ 0.46 $ 0.24 ADJUSTMENTS, NET OF TAX: Acquisition, restructuring and integration costs 0.08 0.03 0.18 0.03 0.05 Revaluation of contingent liabilities — — (0.50) 0.01 0.08 Unrealized gain on investments in securities — — — (0.11) (0.10) Change in TRA liability — — 0.01 — 0.01 Equity-based compensation expense 0.18 0.11 0.17 0.08 0.23 Other nonrecurring items 0.02 0.01 0.01 — — ADJUSTED NET INCOME PER SHARE (B) $ 0.15 $ 0.33 $ 0.44 $ 0.47 $ 0.51 (A) Net income per diluted share for Q1 2023 is calculated using weighted average fully diluted shares of 84.5 million using the Treasury Stock Method in accordance with U.S. GAAP. (B) Adjusted net income per share for Q1 2023 is calculated using total shares of 86.4 million, which includes weighted average Class A, Class B and Class C shares of 55.2 million, 25.5 million, and 2.3 million, respectively, of which the Class B and Class C shares are exchangeable/convertible into shares of Class A common stock, and 3.4 million unvested Restricted Stock Units as of March 31, 2023, for which new Class A shares will be issued upon vesting. Adjusted net income per share for Q1 2022 includes an income tax benefit from The Giving Block acquisition of approximately $6.4 million or $0.07 per share.
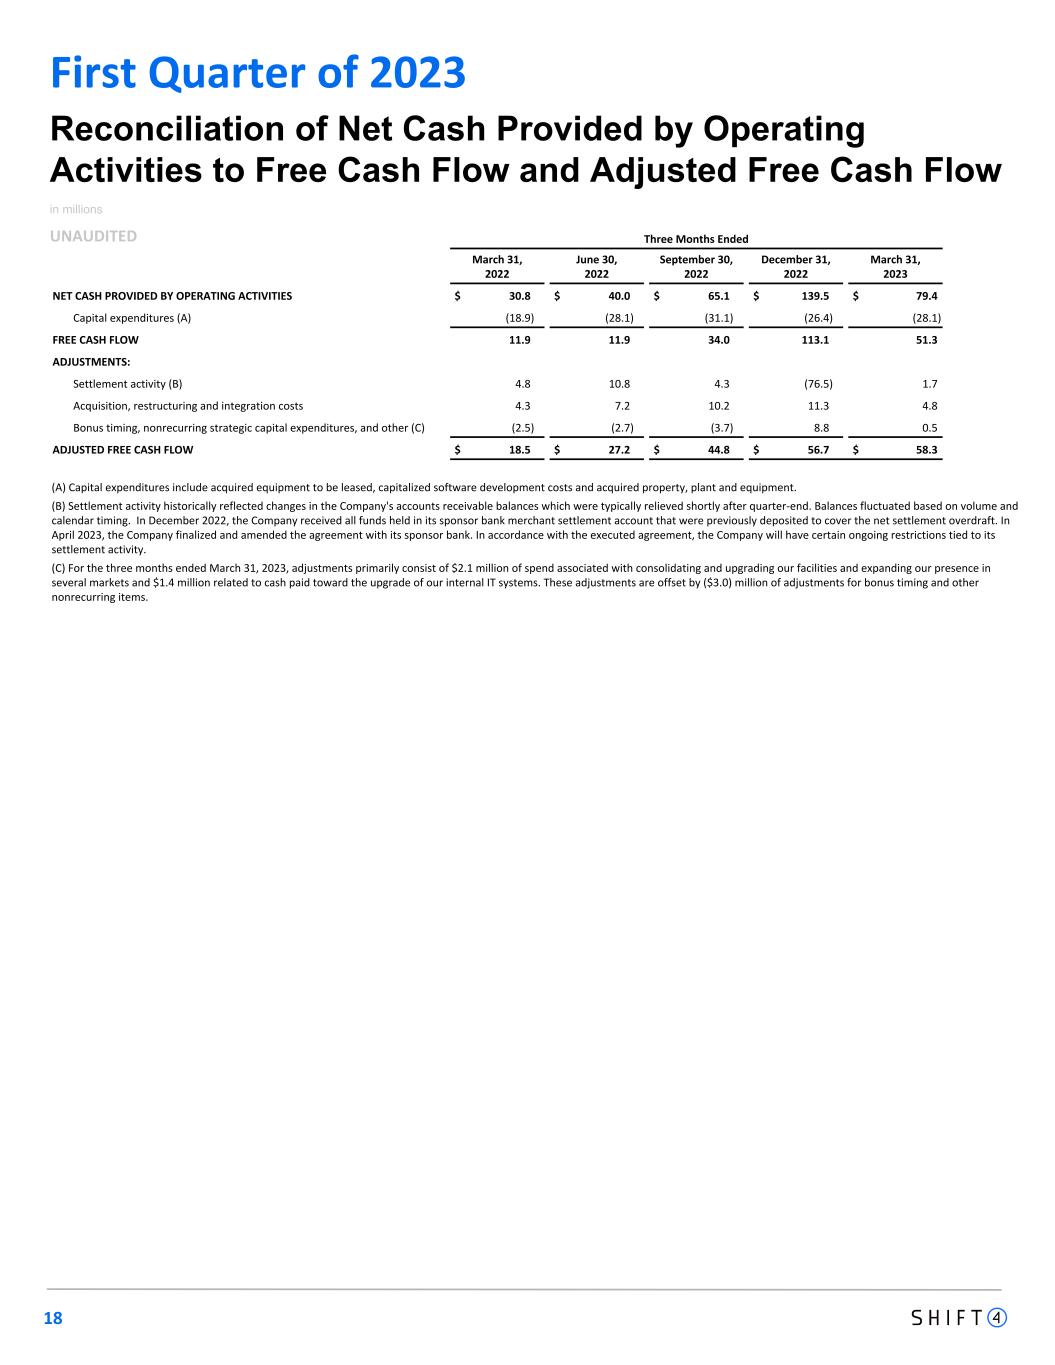
Three Months Ended March 31, 2022 June 30, 2022 September 30, 2022 December 31, 2022 March 31, 2023 NET CASH PROVIDED BY OPERATING ACTIVITIES $ 30.8 $ 40.0 $ 65.1 $ 139.5 $ 79.4 Capital expenditures (A) (18.9) (28.1) (31.1) (26.4) (28.1) FREE CASH FLOW 11.9 11.9 34.0 113.1 51.3 ADJUSTMENTS: Settlement activity (B) 4.8 10.8 4.3 (76.5) 1.7 Acquisition, restructuring and integration costs 4.3 7.2 10.2 11.3 4.8 Bonus timing, nonrecurring strategic capital expenditures, and other (C) (2.5) (2.7) (3.7) 8.8 0.5 ADJUSTED FREE CASH FLOW $ 18.5 $ 27.2 $ 44.8 $ 56.7 $ 58.3 Reconciliation of Net Cash Provided by Operating Activities to Free Cash Flow and Adjusted Free Cash Flow in millions UNAUDITED 18 First Quarter of 2023 (A) Capital expenditures include acquired equipment to be leased, capitalized software development costs and acquired property, plant and equipment. (B) Settlement activity historically reflected changes in the Company's accounts receivable balances which were typically relieved shortly after quarter-end. Balances fluctuated based on volume and calendar timing. In December 2022, the Company received all funds held in its sponsor bank merchant settlement account that were previously deposited to cover the net settlement overdraft. In April 2023, the Company finalized and amended the agreement with its sponsor bank. In accordance with the executed agreement, the Company will have certain ongoing restrictions tied to its settlement activity. (C) For the three months ended March 31, 2023, adjustments primarily consist of $2.1 million of spend associated with consolidating and upgrading our facilities and expanding our presence in several markets and $1.4 million related to cash paid toward the upgrade of our internal IT systems. These adjustments are offset by ($3.0) million of adjustments for bonus timing and other nonrecurring items.
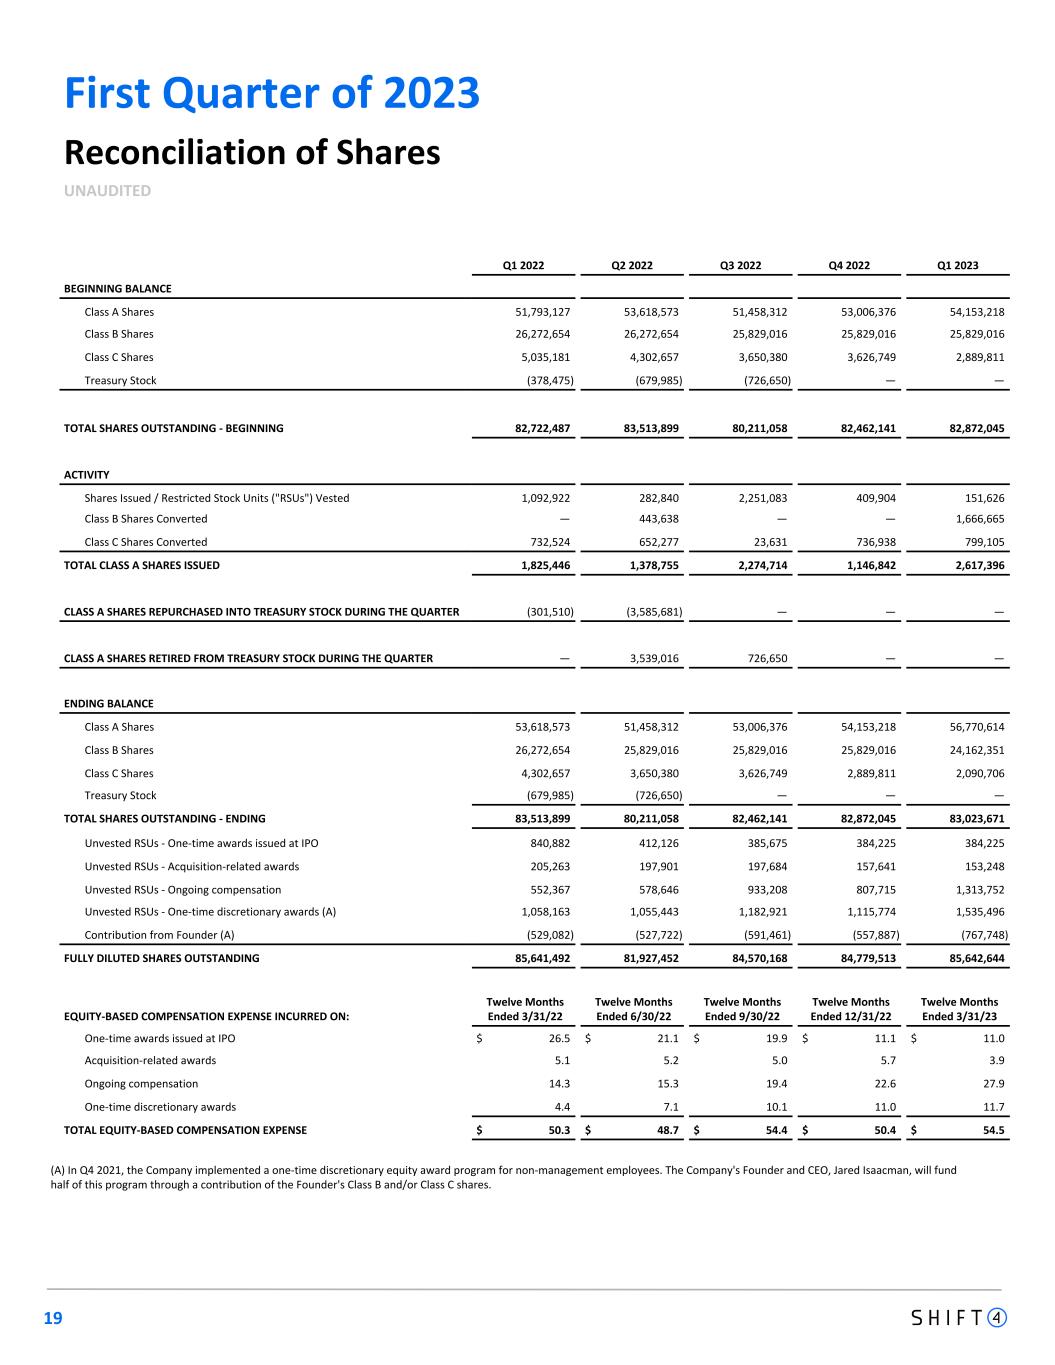
First Quarter of 2023 19 Reconciliation of Shares UNAUDITED Q1 2022 Q2 2022 Q3 2022 Q4 2022 Q1 2023 BEGINNING BALANCE Class A Shares 51,793,127 53,618,573 51,458,312 53,006,376 54,153,218 Class B Shares 26,272,654 26,272,654 25,829,016 25,829,016 25,829,016 Class C Shares 5,035,181 4,302,657 3,650,380 3,626,749 2,889,811 Treasury Stock (378,475) (679,985) (726,650) — — TOTAL SHARES OUTSTANDING - BEGINNING 82,722,487 83,513,899 80,211,058 82,462,141 82,872,045 ACTIVITY Shares Issued / Restricted Stock Units ("RSUs") Vested 1,092,922 282,840 2,251,083 409,904 151,626 Class B Shares Converted — 443,638 — — 1,666,665 Class C Shares Converted 732,524 652,277 23,631 736,938 799,105 TOTAL CLASS A SHARES ISSUED 1,825,446 1,378,755 2,274,714 1,146,842 2,617,396 CLASS A SHARES REPURCHASED INTO TREASURY STOCK DURING THE QUARTER (301,510) (3,585,681) — — — CLASS A SHARES RETIRED FROM TREASURY STOCK DURING THE QUARTER — 3,539,016 726,650 — — ENDING BALANCE Class A Shares 53,618,573 51,458,312 53,006,376 54,153,218 56,770,614 Class B Shares 26,272,654 25,829,016 25,829,016 25,829,016 24,162,351 Class C Shares 4,302,657 3,650,380 3,626,749 2,889,811 2,090,706 Treasury Stock (679,985) (726,650) — — — TOTAL SHARES OUTSTANDING - ENDING 83,513,899 80,211,058 82,462,141 82,872,045 83,023,671 Unvested RSUs - One-time awards issued at IPO 840,882 412,126 385,675 384,225 384,225 Unvested RSUs - Acquisition-related awards 205,263 197,901 197,684 157,641 153,248 Unvested RSUs - Ongoing compensation 552,367 578,646 933,208 807,715 1,313,752 Unvested RSUs - One-time discretionary awards (A) 1,058,163 1,055,443 1,182,921 1,115,774 1,535,496 Contribution from Founder (A) (529,082) (527,722) (591,461) (557,887) (767,748) FULLY DILUTED SHARES OUTSTANDING 85,641,492 81,927,452 84,570,168 84,779,513 85,642,644 EQUITY-BASED COMPENSATION EXPENSE INCURRED ON: Twelve Months Ended 3/31/22 Twelve Months Ended 6/30/22 Twelve Months Ended 9/30/22 Twelve Months Ended 12/31/22 Twelve Months Ended 3/31/23 One-time awards issued at IPO $ 26.5 $ 21.1 $ 19.9 $ 11.1 $ 11.0 Acquisition-related awards 5.1 5.2 5.0 5.7 3.9 Ongoing compensation 14.3 15.3 19.4 22.6 27.9 One-time discretionary awards 4.4 7.1 10.1 11.0 11.7 TOTAL EQUITY-BASED COMPENSATION EXPENSE $ 50.3 $ 48.7 $ 54.4 $ 50.4 $ 54.5 (A) In Q4 2021, the Company implemented a one-time discretionary equity award program for non-management employees. The Company's Founder and CEO, Jared Isaacman, will fund half of this program through a contribution of the Founder's Class B and/or Class C shares.