
Q2 2023 SHAREHOLDER LETTER INVESTORS.SHIFT4.COM Exhibit 99.1
Non-GAAP Financial Measures and Key Performance Indicators Forward-Looking Statements We use supplemental measures of our performance which are derived from our consolidated financial information but which are not presented in our consolidated financial statements prepared in accordance with U.S. generally accepted accounting principles ("GAAP"). These non-GAAP financial measures include: gross revenue less network fees; adjusted net income; adjusted net income per share; free cash flow; adjusted free cash flow; earnings before interest, income taxes, depreciation, and amortization (“EBITDA”); Adjusted EBITDA, Adjusted EBITDA conversion rate; and Adjusted EBITDA margin. Gross revenue less network fees represents a key performance metric that management uses to measure changes in the mix and value derived from our customer base as we continue to execute our strategy to expand our reach to serve larger, complex merchants. Adjusted net income represents net income (loss) adjusted for certain non-cash and other nonrecurring items that management believes are not indicative of ongoing operations, such as acquisition, restructuring and integration costs, revaluation of contingent liabilities, unrealized gain on investments in securities, change in TRA liability, equity-based compensation expense, and other nonrecurring items. Adjusted EBITDA is the primary financial performance measure used by management to evaluate its business and monitor results of operations. Adjusted EBITDA represents EBITDA further adjusted for certain non- cash and other nonrecurring items that management believes are not indicative of ongoing operations. These adjustments include acquisition, restructuring and integration costs, revaluation of contingent liabilities, unrealized gain on investments in securities, change in TRA liability, equity-based compensation expense, and other nonrecurring items. Free cash flow represents net cash provided by operating activities adjusted for non-discretionary capital expenditures. This letter contains forward-looking statements within the meaning of the Private Securities Litigation Reform Act of 1995. All statements contained in this letter that do not relate to matters of historical fact should be considered forward-looking statements, including statements regarding Shift4 Payments, Inc.’s (“our”, the “Company” or "Shift4”) expectations regarding new customers; acquisitions and other transactions, including of our sales partners and their residual streams, and our ability to close said transactions on the timeline we expect or at all; our plans and agreements regarding future payment processing commitments; our expectations with respect to economic recovery; our stock price; and anticipated financial performance, including our financial outlook for fiscal year 2023 and future periods. These statements are neither promises nor guarantees, but involve known and unknown risks, uncertainties and other important factors that may cause our actual results, performance or achievements to be materially different from any future results, performance or achievements expressed or implied by the forward- looking statements, including, but not limited to, the following: our ability to differentiate ourselves from our competitors and compete effectively; our ability to anticipate and respond to changing industry trends and merchant and consumer needs; our ability to continue making acquisitions of businesses or assets; our Adjusted EBITDA Margin represents Adjusted EBITDA divided by gross revenue less network fees. Adjusted Free Cash Flow represents free cash flow further adjusted for certain transactions that are not indicative of future operating cash flows, including settlement activity, which represents the change in our settlement obligation, which fluctuated based on volumes and calendar timing, acquisition, restructuring and integration costs, the impact of timing of annual performance bonuses, other nonrecurring expenses, and nonrecurring strategic capital expenditures that are not indicative of ongoing activities. We believe Adjusted Free Cash Flow is useful to measure the funds generated in a given period that are available to invest in the business, to repurchase stock and to make strategic decisions. The Adjusted EBITDA conversion rate is calculated as Adjusted Free Cash Flow divided by Adjusted EBITDA. We use non-GAAP financial measures to supplement financial information presented on a GAAP basis. We believe that excluding certain items from our GAAP results allows management to better understand our consolidated financial performance from period to period and better project our future consolidated financial performance as forecasts are developed at a level of detail different from that used to prepare GAAP-based financial measures. Moreover, we believe these non-GAAP financial measures provide our stakeholders with useful information to help them evaluate our operating results by facilitating an enhanced understanding of our operating performance and enabling them to make more meaningful period to period comparisons. There are limitations to the use of the non-GAAP financial measures presented in this letter. Our non-GAAP financial measures may not be comparable to similarly titled measures of other companies. Other companies, including companies in our industry, may calculate non-GAAP financial measures differently than we do, limiting the usefulness ability to continue to expand our market share or expand into new markets; our reliance on third-party vendors to provide products and services; our ability to integrate our services and products with operating systems, devices, software and web browsers; our ability to maintain merchant and software partner relationships and strategic partnerships; the effects of global economic, political and other conditions, including inflationary pressure and rising interest rates, on consumer, business and government spending; our compliance with governmental regulation and other legal obligations, particularly related to privacy, data protection and information security, and consumer protection laws; our ability to establish, maintain and enforce effective risk management policies and procedures; our ability to protect our systems and data from continually evolving cybersecurity risks, security breaches and other technological risks; potential harm caused by software defects, computer viruses and development delays; the effect of degradation of the quality of the products and services we offer; potential harm caused by increased customer attrition; potential harm caused by fraud by merchants or others; potential harm caused by damage to our reputation or brands; our ability to recruit, retain and develop qualified personnel; our reliance on a single or limited number of suppliers; the effects of seasonality and volatility on our operating results; the effect of various legal of those measures for comparative purposes. The non- GAAP financial measures are not meant to be considered as indicators of performance in isolation from or as a substitute for net income (loss) prepared in accordance with GAAP, and should be read only in conjunction with financial information presented on a GAAP basis. Reconciliations each of EBITDA and Adjusted EBITDA, gross revenue less network fees, adjusted net income, adjusted net income per share, free cash flow and Adjusted Free Cash Flow to, in each case, its most directly comparable GAAP financial measure are presented in Appendix - Financial Information. We are unable to provide a reconciliation of Adjusted Free Cash Flow for 2023 to net cash provided by operating activities, the nearest comparable GAAP measure, without unreasonable efforts. We encourage you to review the reconciliations in conjunction with the presentation of the non-GAAP financial measures for each of the periods presented. In future fiscal periods, we may exclude such items and may incur income and expenses similar to these excluded items. In addition, key performance indicators include end-to-end payment volume, spread and margin. End-to-end payment volume is defined as the total dollar amount of payments that we deliver for settlement on behalf of our merchants. Included in end-to-end volume are dollars routed via our international payments platform and alternative payment methods, including cryptocurrency and stock donations, plus volume we route to one or more third party merchant acquirers on behalf of strategic enterprise merchant relationships, translated to U.S. dollars. This volume does not include volume processed through our legacy gateway-only offering. Blended Spread represents the average yield Shift4 earns on the average end-to-end payment volume processed for a given period after network fees. Blended Spread is calculated as payments-based revenue less gateway revenue and network fees for a given period divided by the end-to-end payment volume processed for the same period. proceedings; our ability to raise additional capital to fund our operations; our ability to protect, enforce and defend our intellectual property rights; our ability to establish and maintain effective internal control over financial reporting and disclosure controls and procedures; our compliance with laws, regulations and enforcement activities that affect our industry; our dependence on distributions from Shift4 Payments, LLC to pay our taxes and expenses, including payments under the Tax Receivable Agreement; the significant influence Rook has over us, including control over decisions that require the approval of stockholders; and the potential impact of any future material weaknesses in our internal control over financial reporting. These and other important factors are described in “Cautionary Note Regarding Forward-Looking Statements” and “Risk Factors” in Part I, Item 1A. in our Annual Report on Form 10-K for the year ended December 31, 2022, and could cause actual results to differ materially from those indicated by the forward-looking statements made in this presentation. Any such forward-looking statements represent management’s estimates as of the date of this presentation. While we may elect to update such forward-looking statements at some point in the future, we disclaim any obligation to do so, even if subsequent events cause our views to change. 2
We have been busy but we finished up another reasonably strong quarter. We delivered record results across the board, landed many notable enterprise merchants, installed thousands of new SkyTab customers, made considerable progress within our new verticals, especially non-profits, and took several steps in the right direction with our international expansion endeavors...and we are raising full-year guidance. As to our performance, we grew our end-to-end volume, gross revenue, gross profit, and gross revenue less network fees 59%, 26%, 61% and 25%, respectively, versus the comparable period a year ago. The majority of our growth still derives from restaurants, hotels and strategic enterprise relationships, but sports & entertainment and non-profits continue to gain momentum. With respect to restaurants, our SkyTab POS product is seeing impressive results. In fact, we are very appreciative of the fee increase chaos that was recently announced and rescinded by some of our competitors. The associated trust issue has boosted SkyTab demand. Overall, I am especially proud of the lineup of signature logos we are able to feature for this quarter. These are some of the most respected brands in the world and they chose Shift4, not for price, but for the commerce experience we are uniquely able to provide. We continue to remain very disciplined with expenses as we fight to maintain flat headcount, upgrade talent and implement automation, AI and other tools to improve the efficiency of the business. We also are just naturally becoming more efficient as we further streamline and monetize our gateway offering, sunset legacy POS brands and generally keep moving up market to higher volume/lower overhead customers. As a result, we delivered $36.8 million of net income and $110.0 million of Adjusted EBITDA for the quarter, while continuing to expand margins and deliver robust free cash flow. We expect the margin and free cash flow profile of the business to continue to expand especially in 2024 as we further rollout our Project Phoenix AI & internal system initiatives. I am also pleased that we are on a path to complete a major milestone in our international expansion endeavors: we anticipate closing Finaro by the end of the quarter. Our full year 2023 guidance has been updated to include a contribution from Finaro in the fourth quarter, in addition to the outperformance we delivered this quarter. Said differently, irrespective of the anticipated closing of Finaro, we still would have raised our full year 2023 guidance. It took a lot of work to get to this point, but we have winning products for restaurants, hotels, stadiums and our investments in non-profits, gaming, travel, ecommerce and international expansion are all coming together at the right time. We are stronger than most, in that we can continue to take share of a large addressable market and grow exceptionally quickly from the customers we already have. Looking ahead, all of our advantages remain but we can now begin to realize economic benefit from several new geographic areas. Dear Shareholders, We have been busy but we finished up another reasonably strong quarter. We delivered record results across the board, landed many notable enterprise merchants, installed thousands of new SkyTab customers, made considerable progress within our new verticals, especially non-profits, and took several steps in the right direction with our international expansion endeavors...and we are raising full-year guidance. As to our performance, we grew our end-to-end volume, gross revenue, gross profit, and gross revenue less network fees 59%, 26%, 61% and 25%, respectively, versus the comparable period a year ago. The majority of our growth still derives from restaurants, hotels and strategic enterprise relationships, but sports & entertainment and non-profits continue to gain momentum. With respect to restaurants, our SkyTab POS product is seeing impressive results. In fact, we are very appreciative of the fee increase chaos that was recently announced and rescinded by some of our competitors. The associated trust issue has boosted SkyTab demand. Overall, I am especially proud of the lineup of signature logos we are able to feature for this quarter. These are some of the most respected brands in the world and they chose Shift4, not for price, but for the commerce experience we are uniquely able to provide. We continue to remain very disciplined with expenses as we fight to maintain flat headcount, upgrade talent and implement automation, AI and other tools to improve the efficiency of the business. We also are just naturally becoming more efficient as we further streamline and monetize our gateway offering, sunset legacy POS brands and generally keep moving up market to higher volume/lower overhead customers. As a result, we delivered $36.8 million of net income and $110.0 million of Adjusted EBITDA for the quarter, while continuing to expand margins and deliver robust free cash flow. We expect the margin and free cash flow profile of the business to continue to expand especially in 2024 as we further rollout our Project Phoenix AI & internal system initiatives. I am also pleased that we are on a path to complete a major milestone in our international expansion endeavors. Our guidance has been updated to reflect this milestone in addition to the organic acceleration we are seeing in the business including visibility into enterprise and international opportunities. It took a lot of work to get to this point, but we have winning products for restaurants, hotels, stadiums and our investments in non-profits, gaming, travel, ecommerce and international expansion are all coming together at the right time. We are stronger than most, in that we can continue to take share of a large addressable market and grow exceptionally quickly from the customers we already have. Looking ahead, all of our advantages remain but we can now begin to realize economic benefit from several new geographic areas. 3 3 e have been busy but e finished up another reasonably strong quarter. e delivered record results across the board, landed any notable enterprise erchants, installed thousands of new SkyTab customers, made considerable progress within our new verticals, especially non-profits, and took several steps in the right direction with our international expansion endeavors...and we are raising full-year guidance. As to our performance, we grew our end-to-end volume, gross revenue, gross profit, and gross revenue less network fees 59%, 26%, 61% and 25%, respectively, versus the comparable period a year ago. The majority of our growth still derives from restaurants, hotels and strategic enterprise relationships, but sports & entertainment and non-profits continue to gain momentum. With respect to restaurants, our SkyTab POS product is seeing impressive results. In fact, we ar very ppreciative of the fee increase chaos that was recently announced and rescinded by som of our competitors. Th associ ted trust issue has boosted SkyTab demand. Overall, I am especially proud of the lineup of signature logos we are able to feature for this quarter. These are some of the most respected brands in the world and they chose Shift4, not for price, but for the commerce experience we are uniquely able to provide. We continue to remain very disciplined with expenses as we fight to maintain flat headcount, upgrade talent and implement automation, AI and other tools to improve the efficiency of the business. We also are just naturally becoming more efficient as we further streamline and monetize our gateway offering, sunset legacy POS brands and generally keep moving up market to higher volume/lower overhead customers. As a result, we delivered $36.8 million of net income and $110.0 million of Adjusted EBITDA for the quarter, while continuing to expand margins and deliver robust free cash flow. We expect the margin and free cash flow profile of the business to continue to expand especi lly i 2024 as we further rollout our Project Ph en x AI & internal system initiatives. I am also pleased that we are on a path to complete a major milestone in our international expansion endeavors: we anticipate closing Finaro by the end of the quarter. Our full year 2023 guidance has been updated to include a contribution from Finaro in the fourth quarter, in addition to the outperformance we delivered this quarter. Said differently, irrespective of the anticipated closing of Finaro, we still would have raised our full year 2023 guidance. It took a lot of work to get to this point, but we have winning products for restaurants, hotels, stadiums and our investments in non-profits, gaming, travel, ecommerce and international expansion are all coming together at the right time. We are stronger than most, in that we can continue to take share of a large addressable market and grow exceptionally quickly from the customers we already have. Looking ahead, all of our advantages remain but we can now begin to realize economic benefit from several new geographic areas.
It is not easy to deliver these kind of results. It takes a lot of hard work and sacrifice from thousands of Shift4 team members and well over two hundred thousand customers that put their trust in our service. I am very thankful. As always, I welcome all your feedback, including business opportunities, areas of improvement and general suggestions. Please don’t hesitate to contact me directly and as they might say at one of our signature customers – Have a Magical Day. Boldly Forward, Jared Isaacman CEO jared@shift4.com 4 4
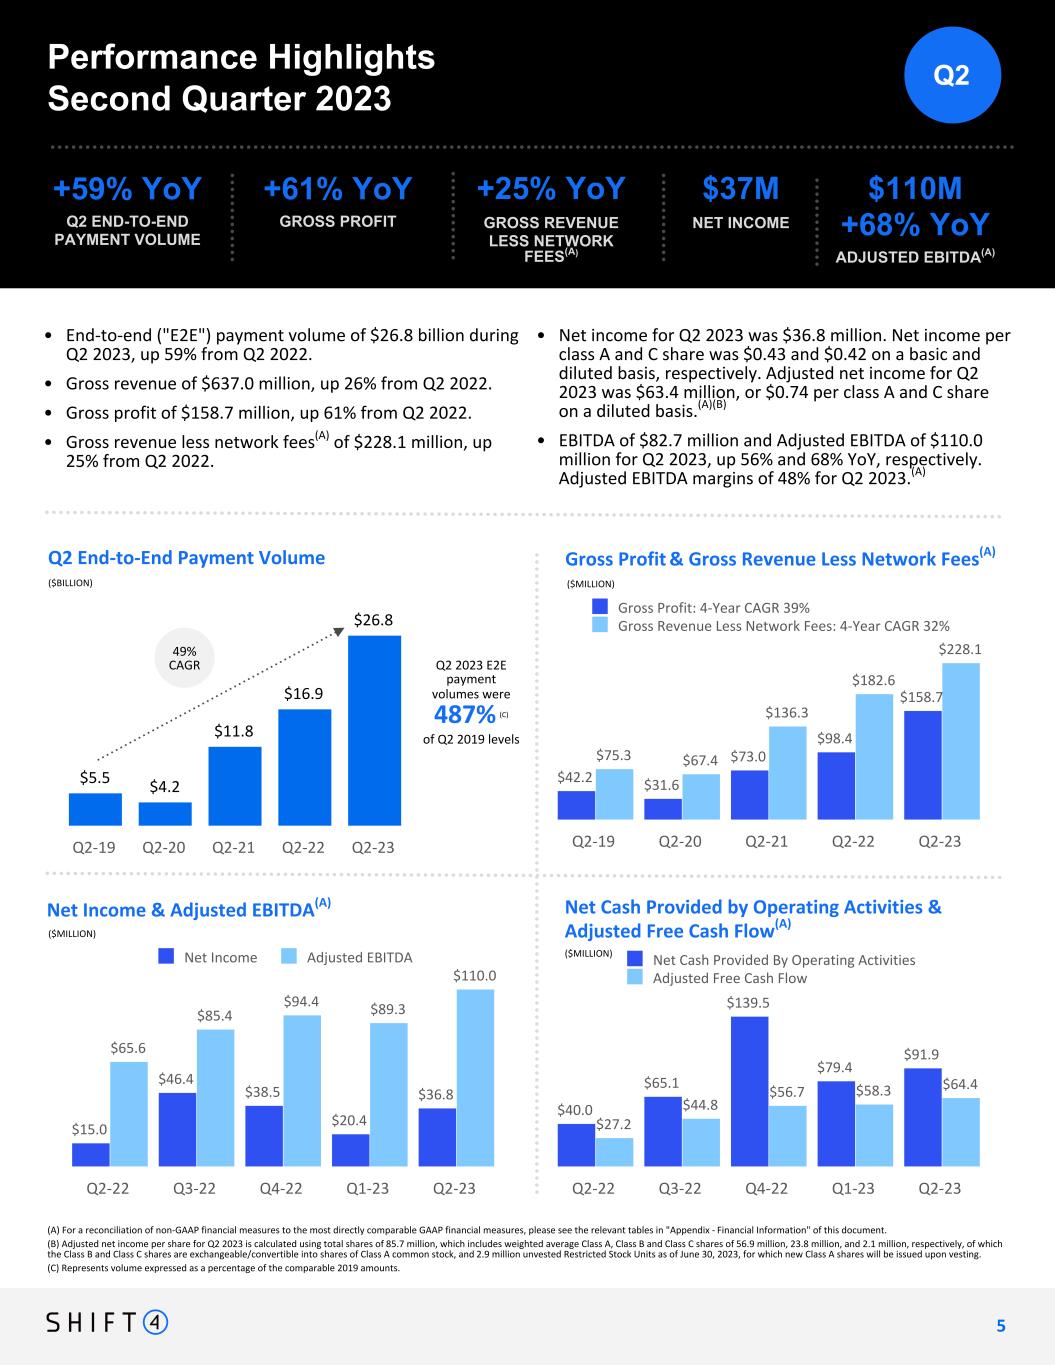
Q2 2023 E2E payment volumes were 487% (C) of Q2 2019 levels $5.5 $4.2 $11.8 $16.9 $26.8 Q2-19 Q2-20 Q2-21 Q2-22 Q2-23 (A) For a reconciliation of non-GAAP financial measures to the most directly comparable GAAP financial measures, please see the relevant tables in "Appendix - Financial Information" of this document. (B) Adjusted net income per share for Q2 2023 is calculated using total shares of 85.7 million, which includes weighted average Class A, Class B and Class C shares of 56.9 million, 23.8 million, and 2.1 million, respectively, of which the Class B and Class C shares are exchangeable/convertible into shares of Class A common stock, and 2.9 million unvested Restricted Stock Units as of June 30, 2023, for which new Class A shares will be issued upon vesting. (C) Represents volume expressed as a percentage of the comparable 2019 amounts. 5 Q2 End-to-End Payment Volume Gross Profit & Gross Revenue Less Network Fees(A) ($BILLION) Performance Highlights Second Quarter 2023 +59% YoY Q2 END-TO-END PAYMENT VOLUME 49% CAGR Net Income & Adjusted EBITDA(A) Net Cash Provided by Operating Activities & Adjusted Free Cash Flow(A) ($MILLION) ($MILLION) ($MILLION) +61% YoY GROSS PROFIT $37M NET INCOME • $110M +68% YoY ADJUSTED EBITDA(A) +25% YoY GROSS REVENUE LESS NETWORK FEES(A) • End-to-end ("E2E") payment volume of $26.8 billion during Q2 2023, up 59% from Q2 2022. • Gross revenue of $637.0 million, up 26% from Q2 2022. • Gross profit of $158.7 million, up 61% from Q2 2022. • Gross revenue less network fees(A) of $228.1 million, up 25% from Q2 2022. • Net income for Q2 2023 was $36.8 million. Net income per class A and C share was $0.43 and $0.42 on a basic and diluted basis, respectively. Adjusted net income for Q2 2023 was $63.4 million, or $0.74 per class A and C share on a diluted basis.(A)(B) • EBITDA of $82.7 million and Adjusted EBITDA of $110.0 million for Q2 2023, up 56% and 68% YoY, respectively. Adjusted EBITDA margins of 48% for Q2 2023.(A) Q2 5 $15.0 $46.4 $38.5 $20.4 $36.8 $65.6 $85.4 $94.4 $89.3 $110.0 Net Income Adjusted EBITDA Q2-22 Q3-22 Q4-22 Q1-23 Q2-23 $42.2 $31.6 $73.0 $98.4 $158.7 $75.3 $67.4 $136.3 $182.6 $228.1 Gross Profit: 4-Year CAGR 39% Gross Revenue Less Network Fees: 4-Year CAGR 32% Q2-19 Q2-20 Q2-21 Q2-22 Q2-23 $40.0 $65.1 $139.5 $79.4 $91.9 $27.2 $44.8 $56.7 $58.3 $64.4 Net Cash Provided By Operating Activities Adjusted Free Cash Flow Q2-22 Q3-22 Q4-22 Q1-23 Q2-23
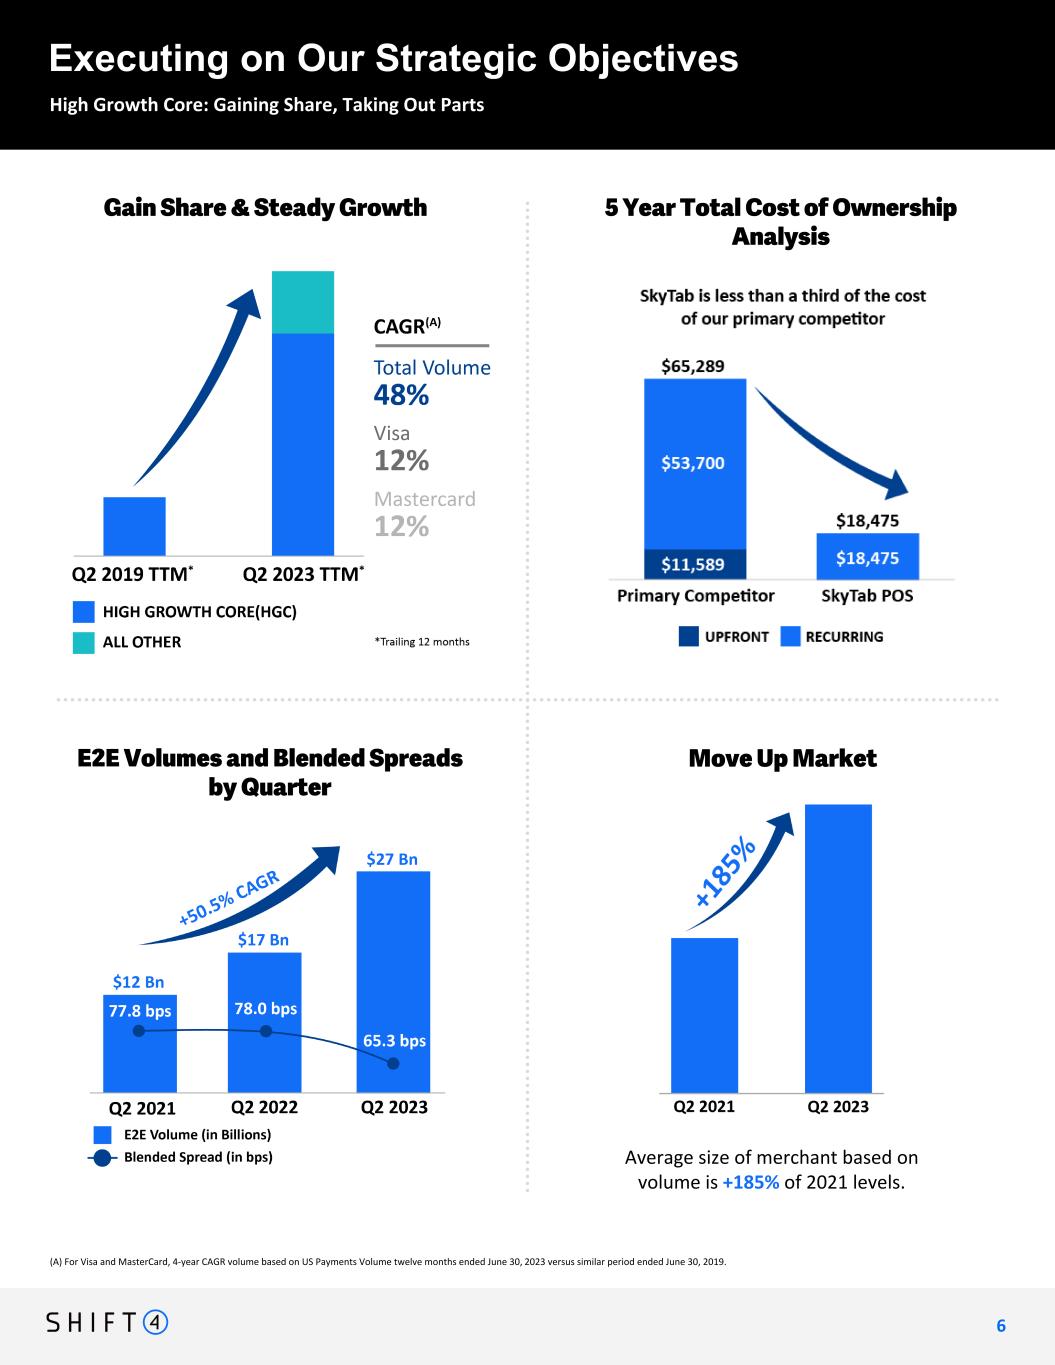
E2E Volumes and Blended Spreads by Quarter Gain Share & Steady Growth 5 Year Total Cost of Ownership Analysis High Growth Core: Gaining Share, Taking Out Parts Executing on Our Strategic Objectives (A) For Visa and MasterCard, 4-year CAGR volume based on US Payments Volume twelve months ended June 30, 2023 versus similar period ended June 30, 2019. Average size of merchant based on volume is +185% of 2021 levels. Move Up Market 6 6
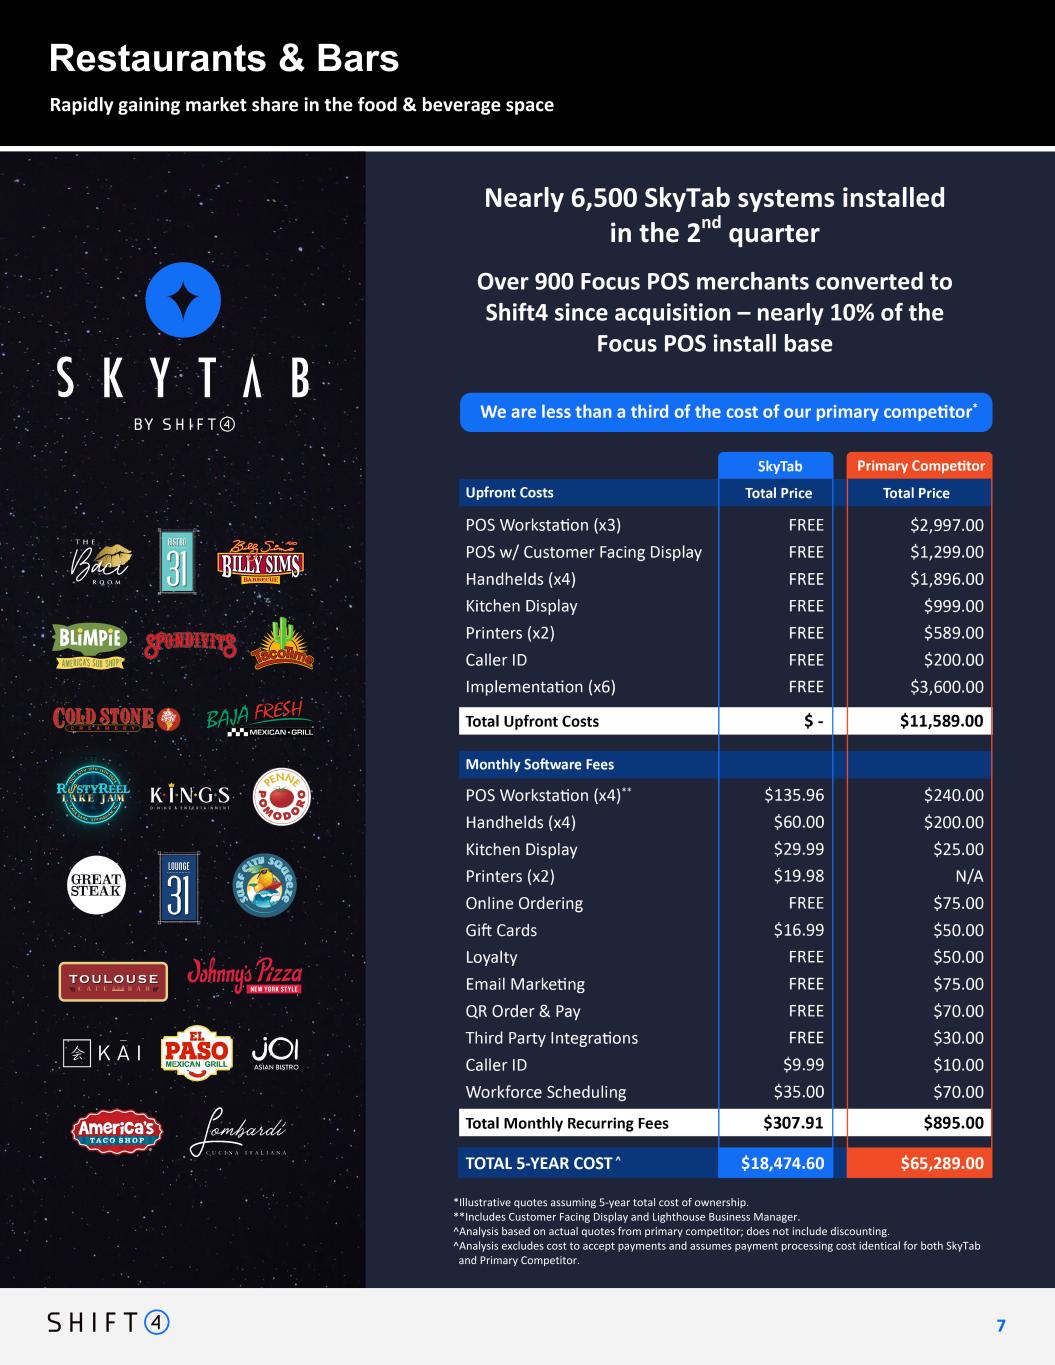
Restaurants & Bars Rapidly gaining market share in the food & beverage space Over 900 Focus POS merchants converted to Shift4 since acquisition – nearly 10% of the Focus POS install base Nearly 6,500 SkyTab systems installed in the 2nd quarter 7 *Illustrative quotes assuming 5-year total cost of ownership. **Includes Customer Facing Display and Lighthouse Business Manager. ^Analysis based on actual quotes from primary competitor; does not include discounting. ^Analysis excludes cost to accept payments and assumes payment processing cost identical for both SkyTab and Primary Competitor.
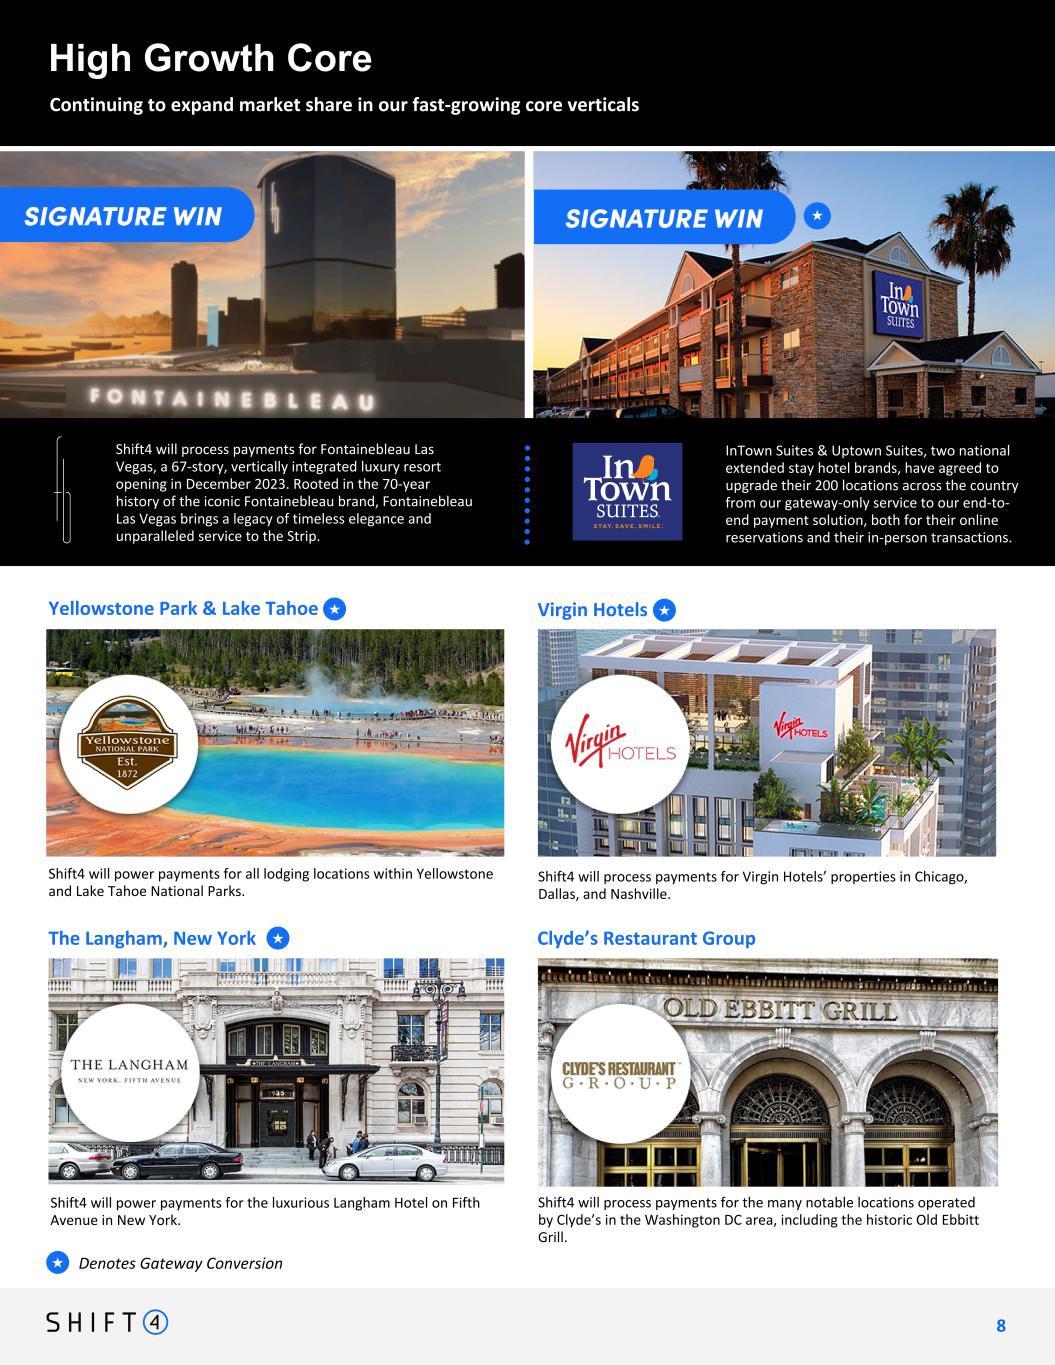
High Growth Core Continuing to expand market share in our fast-growing core verticals Denotes Gateway Conversion★ Shift4 will process payments for Virgin Hotels’ properties in Chicago, Dallas, and Nashville. Virgin Hotels Shift4 will power payments for the luxurious Langham Hotel on Fifth Avenue in New York. The Langham, New York Shift4 will process payments for the many notable locations operated by Clyde’s in the Washington DC area, including the historic Old Ebbitt Grill. Clyde’s Restaurant Group Shift4 will power payments for all lodging locations within Yellowstone and Lake Tahoe National Parks. Yellowstone Park & Lake Tahoe InTown Suites & Uptown Suites, two national extended stay hotel brands, have agreed to upgrade their 200 locations across the country from our gateway-only service to our end-to- end payment solution, both for their online reservations and their in-person transactions. Shift4 will process payments for Fontainebleau Las Vegas, a 67-story, vertically integrated luxury resort opening in December 2023. Rooted in the 70-year history of the iconic Fontainebleau brand, Fontainebleau Las Vegas brings a legacy of timeless elegance and unparalleled service to the Strip. ★ ★ ★ ★ 8 8
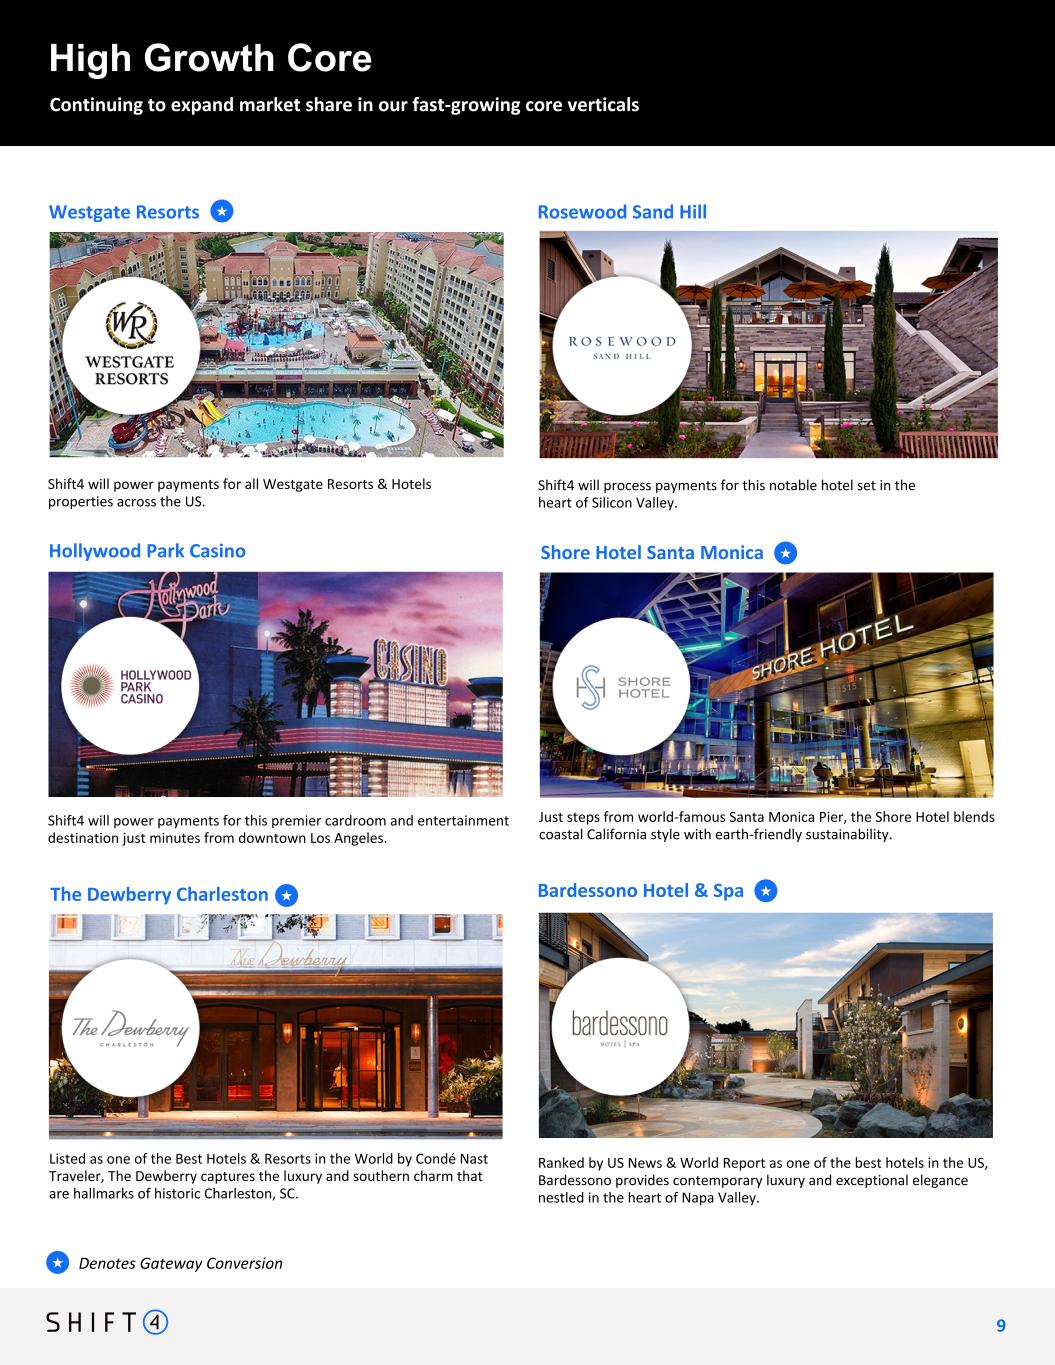
High Growth Core Continuing to expand market share in our fast-growing core verticals Denotes Gateway Conversion★ 9 9 Shift4 will power payments for all Westgate Resorts & Hotels properties across the US. Westgate Resorts Shift4 will process payments for this notable hotel set in the heart of Silicon Valley. Rosewood Sand Hill★ Shift4 will power payments for this premier cardroom and entertainment destination just minutes from downtown Los Angeles. Hollywood Park Casino Ranked by US News & World Report as one of the best hotels in the US, Bardessono provides contemporary luxury and exceptional elegance nestled in the heart of Napa Valley. Bardessono Hotel & SpaThe Dewberry Charleston Shore Hotel Santa Monica Listed as one of the Best Hotels & Resorts in the World by Condé Nast Traveler, The Dewberry captures the luxury and southern charm that are hallmarks of historic Charleston, SC. Just steps from world-famous Santa Monica Pier, the Shore Hotel blends coastal California style with earth-friendly sustainability. ★ ★ ★
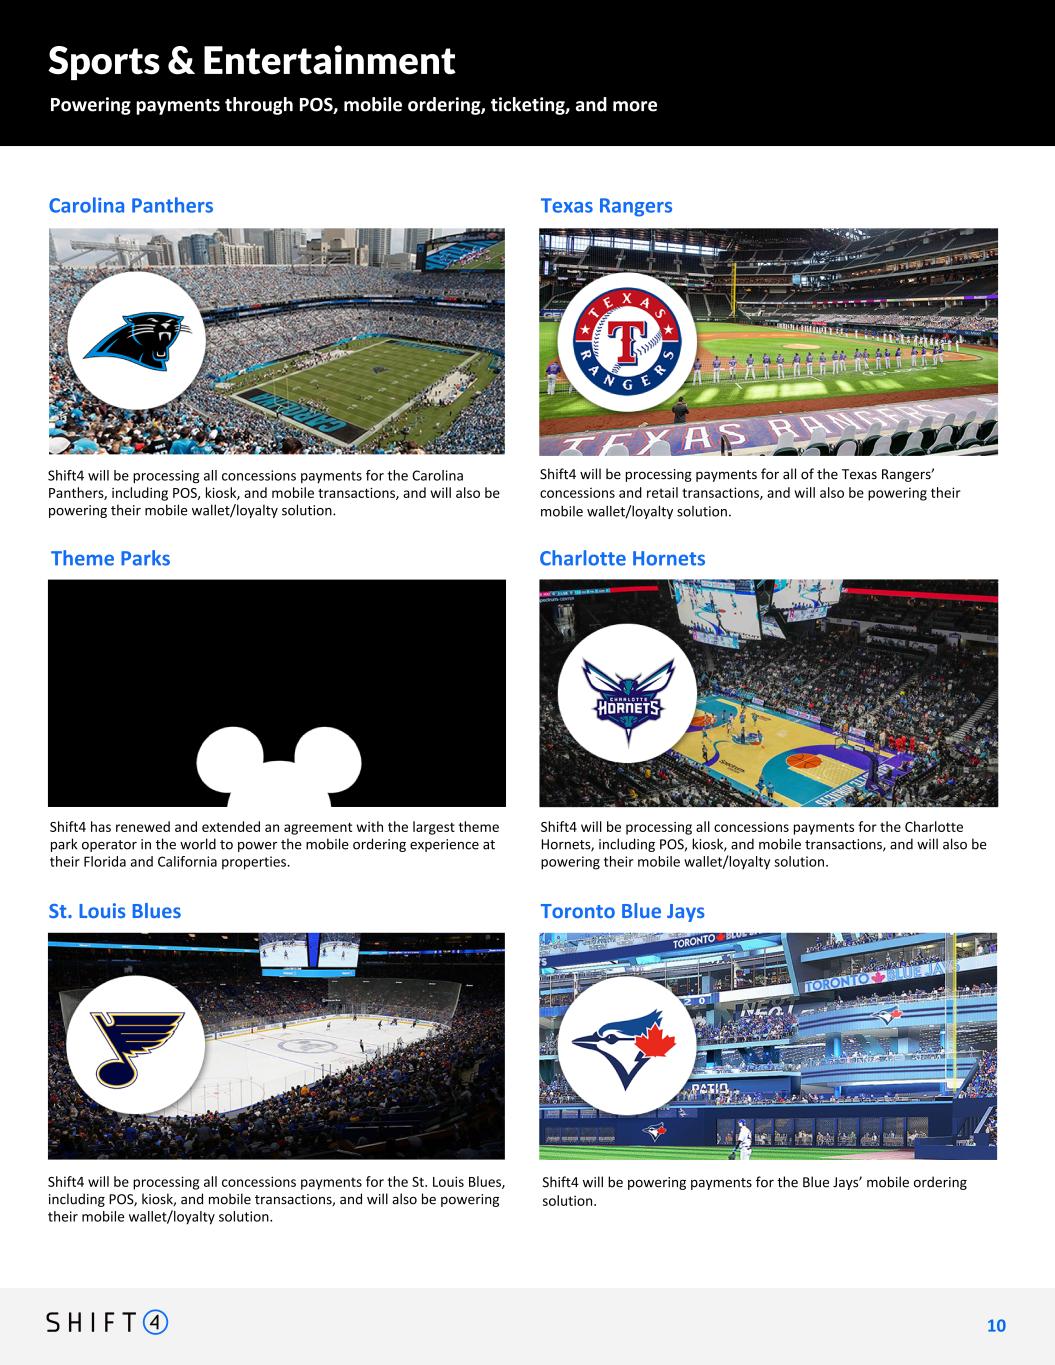
Sports & Entertainment Powering payments through POS, mobile ordering, ticketing, and more Theme Parks Shift4 will be processing all concessions payments for the St. Louis Blues, including POS, kiosk, and mobile transactions, and will also be powering their mobile wallet/loyalty solution. St. Louis Blues Charlotte Hornets Shift4 will be processing all concessions payments for the Charlotte Hornets, including POS, kiosk, and mobile transactions, and will also be powering their mobile wallet/loyalty solution. Shift4 will be processing all concessions payments for the Carolina Panthers, including POS, kiosk, and mobile transactions, and will also be powering their mobile wallet/loyalty solution. Carolina Panthers Texas Rangers Toronto Blue Jays Shift4 will be processing payments for all of the Texas Rangers’ concessions and retail transactions, and will also be powering their mobile wallet/loyalty solution. Shift4 will be powering payments for the Blue Jays’ mobile ordering solution. Shift4 has renewed and extended an agreement with the largest theme park operator in the world to power the mobile ordering experience at their Florida and California properties. 1 0 10
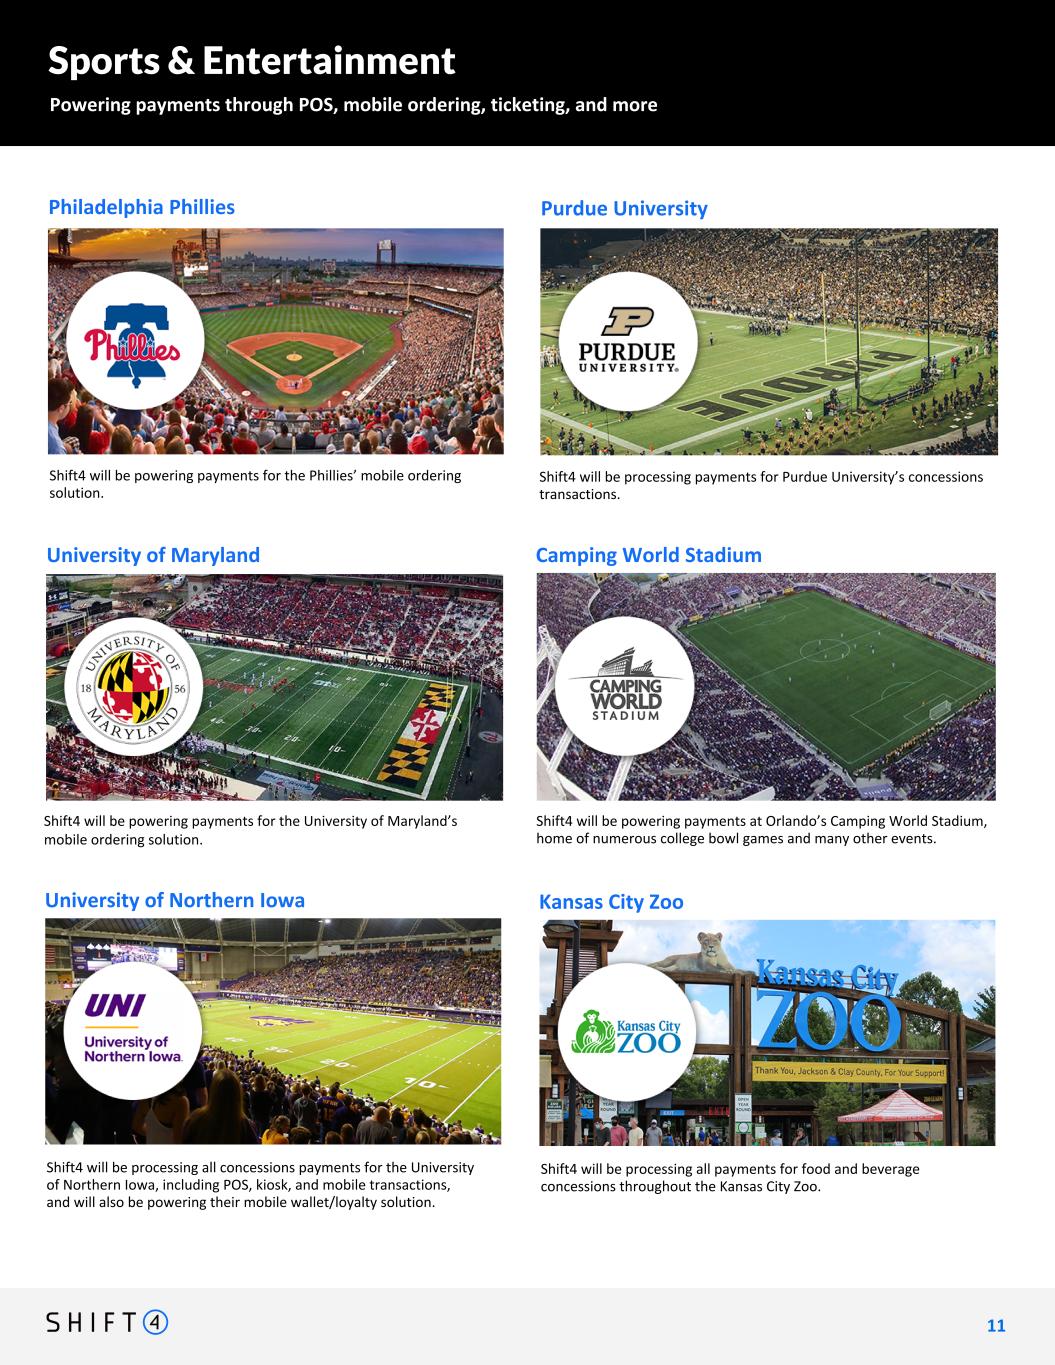
Sports & Entertainment Powering payments through POS, mobile ordering, ticketing, and more Shift4 will be processing payments for Purdue University’s concessions transactions. Purdue UniversityPhiladelphia Phillies Shift4 will be powering payments for the Phillies’ mobile ordering solution. University of Maryland Shift4 will be powering payments for the University of Maryland’s mobile ordering solution. 1 1 11 Camping World Stadium Shift4 will be powering payments at Orlando’s Camping World Stadium, home of numerous college bowl games and many other events. University of Northern Iowa Shift4 will be processing all concessions payments for the University of Northern Iowa, including POS, kiosk, and mobile transactions, and will also be powering their mobile wallet/loyalty solution. Kansas City Zoo Shift4 will be processing all payments for food and beverage concessions throughout the Kansas City Zoo.
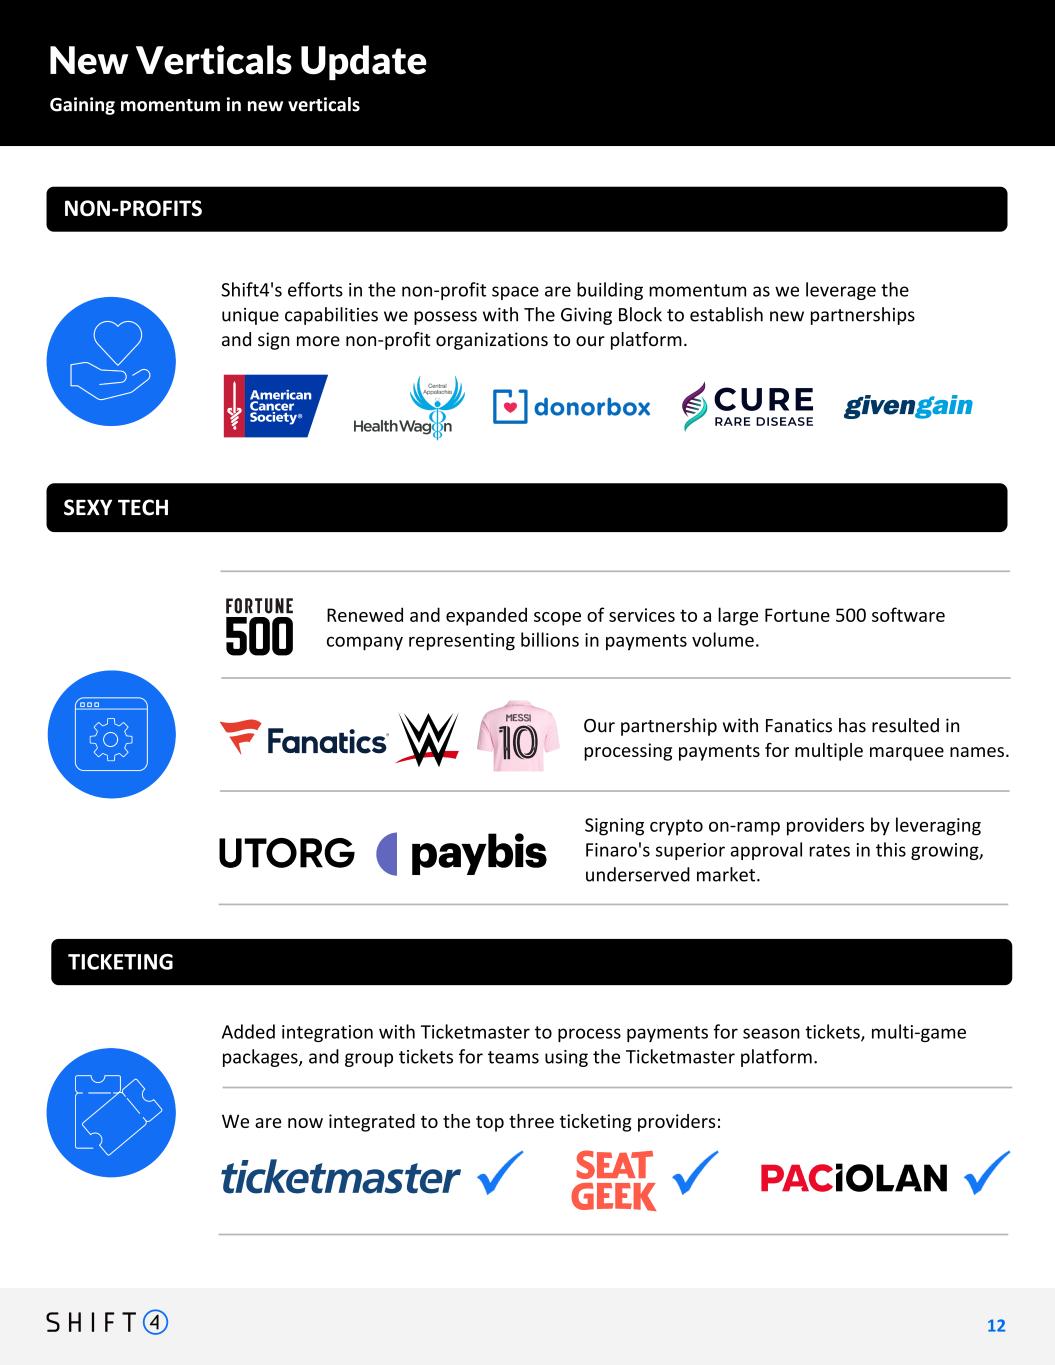
New Verticals Update Gaining momentum in new verticals 1 2 12 NON-PROFITS Added integration with Ticketmaster to process payments for season tickets, multi-game packages, and group tickets for teams using the Ticketmaster platform. Shift4's efforts in the non-profit space are building momentum as we leverage the unique capabilities we possess with The Giving Block to establish new partnerships and sign more non-profit organizations to our platform. Signing crypto on-ramp providers by leveraging Finaro's superior approval rates in this growing, underserved market. Renewed and expanded scope of services to a large Fortune 500 software company representing billions in payments volume. SEXY TECH TICKETING Our partnership with Fanatics has resulted in processing payments for multiple marquee names. We are now integrated to the top three ticketing providers:
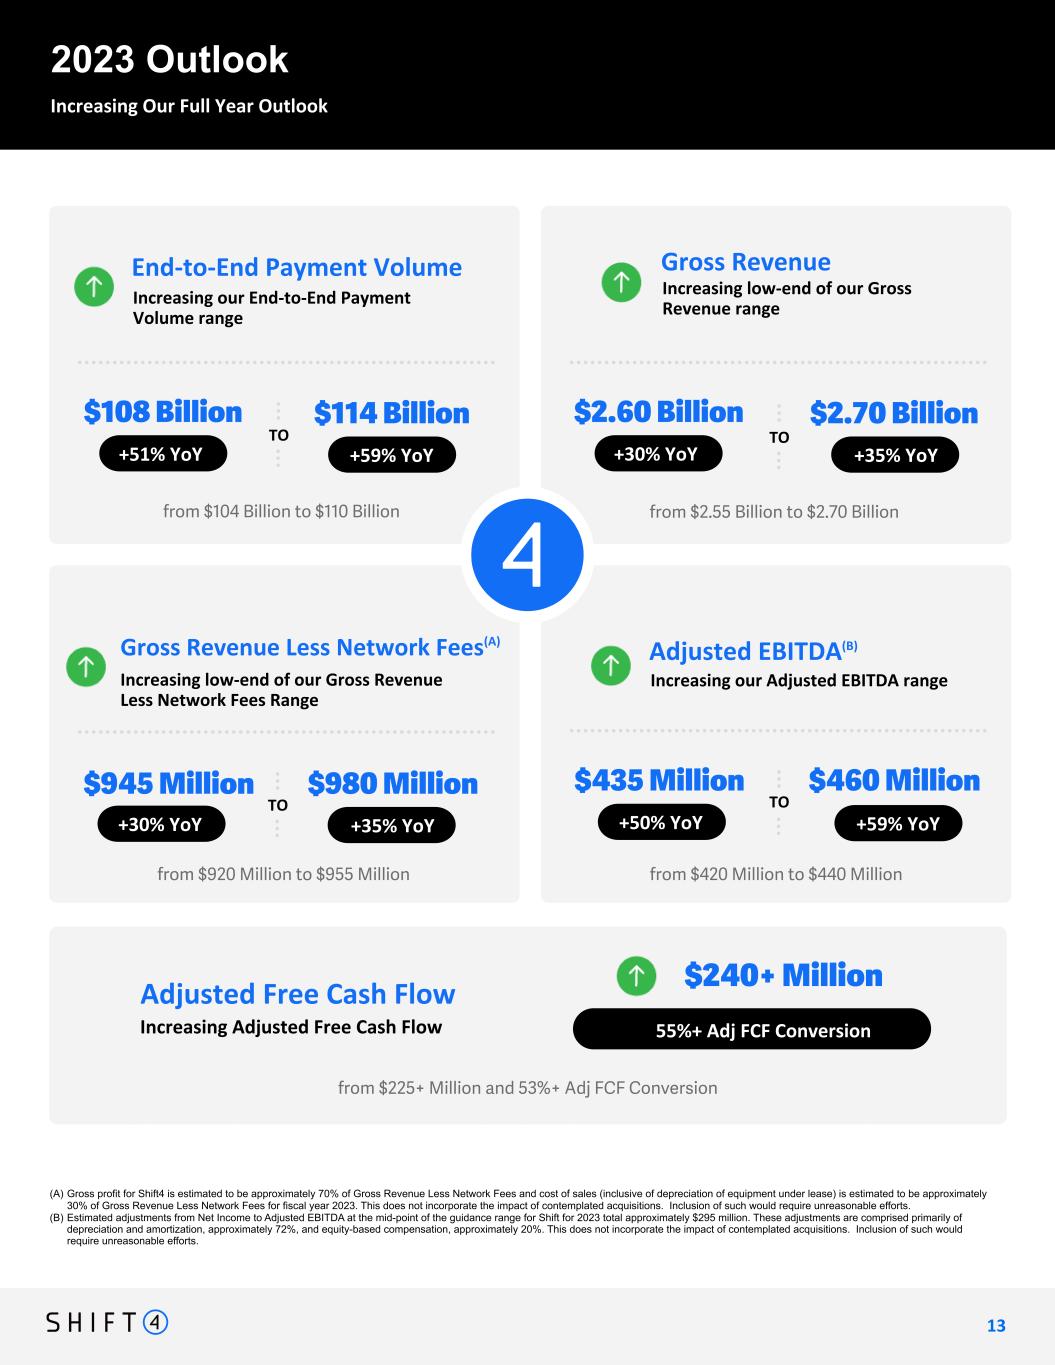
(A) Gross profit for Shift4 is estimated to be approximately 70% of Gross Revenue Less Network Fees and cost of sales (inclusive of depreciation of equipment under lease) is estimated to be approximately 30% of Gross Revenue Less Network Fees for fiscal year 2023. This does not incorporate the impact of contemplated acquisitions. Inclusion of such would require unreasonable efforts. (B) Estimated adjustments from Net Income to Adjusted EBITDA at the mid-point of the guidance range for Shift for 2023 total approximately $295 million. These adjustments are comprised primarily of depreciation and amortization, approximately 72%, and equity-based compensation, approximately 20%. This does not incorporate the impact of contemplated acquisitions. Inclusion of such would require unreasonable efforts. 2023 Outlook Increasing Our Full Year Outlook $108 Billion +51% YoY +59% YoY $114 Billion $2.60 Billion +30% YoY +35% YoY $2.70 Billion TO TO 55%+ Adj FCF Conversion $240+ Million Increasing our End-to-End Payment Volume range End-to-End Payment Volume Increasing low-end of our Gross Revenue range Gross Revenue Increasing low-end of our Gross Revenue Less Network Fees Range Gross Revenue Less Network Fees(A) TO $945 Million +30% YoY +35% YoY $980 Million Increasing our Adjusted EBITDA range Adjusted EBITDA(B) $435 Million +50% YoY +59% YoY $460 Million TO Increasing Adjusted Free Cash Flow Adjusted Free Cash Flow from $104 Billion to $110 Billion from $2.55 Billion to $2.70 Billion from $920 Million to $955 Million from $420 Million to $440 Million 1 3 13 from $225+ Million and 53%+ Adj FCF Conversion
Appendix - Financial Information 14
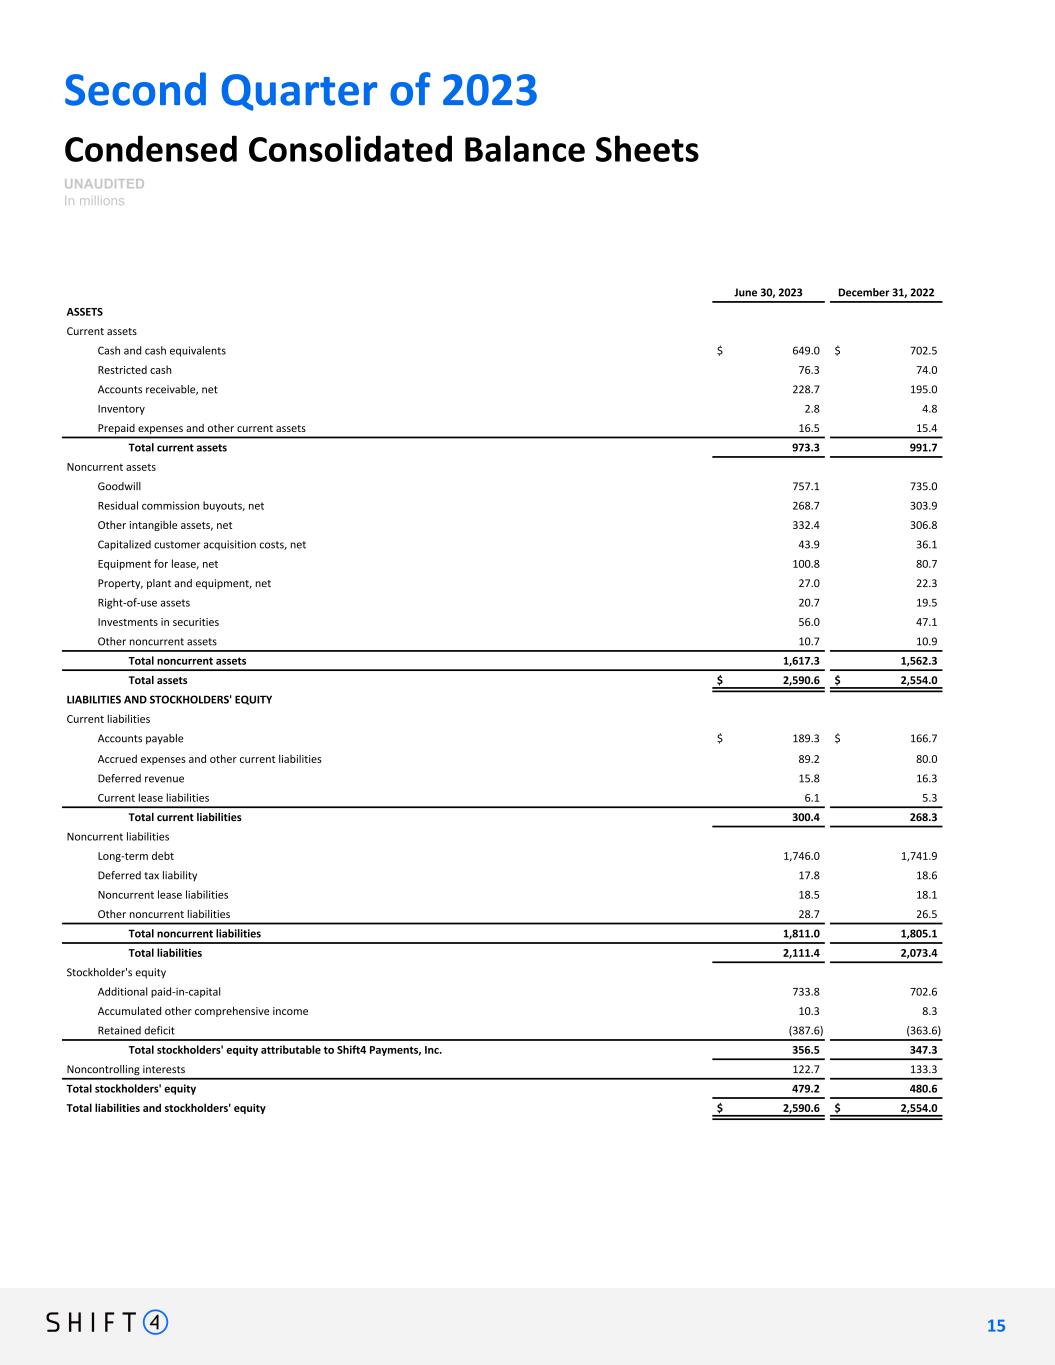
Second Quarter of 2023 Condensed Consolidated Balance Sheets UNAUDITED In millions June 30, 2023 December 31, 2022 ASSETS Current assets Cash and cash equivalents $ 649.0 $ 702.5 Restricted cash 76.3 74.0 Accounts receivable, net 228.7 195.0 Inventory 2.8 4.8 Prepaid expenses and other current assets 16.5 15.4 Total current assets 973.3 991.7 Noncurrent assets Goodwill 757.1 735.0 Residual commission buyouts, net 268.7 303.9 Other intangible assets, net 332.4 306.8 Capitalized customer acquisition costs, net 43.9 36.1 Equipment for lease, net 100.8 80.7 Property, plant and equipment, net 27.0 22.3 Right-of-use assets 20.7 19.5 Investments in securities 56.0 47.1 Other noncurrent assets 10.7 10.9 Total noncurrent assets 1,617.3 1,562.3 Total assets $ 2,590.6 $ 2,554.0 LIABILITIES AND STOCKHOLDERS' EQUITY Current liabilities Accounts payable $ 189.3 $ 166.7 Accrued expenses and other current liabilities 89.2 80.0 Deferred revenue 15.8 16.3 Current lease liabilities 6.1 5.3 Total current liabilities 300.4 268.3 Noncurrent liabilities Long-term debt 1,746.0 1,741.9 Deferred tax liability 17.8 18.6 Noncurrent lease liabilities 18.5 18.1 Other noncurrent liabilities 28.7 26.5 Total noncurrent liabilities 1,811.0 1,805.1 Total liabilities 2,111.4 2,073.4 Stockholder's equity Additional paid-in-capital 733.8 702.6 Accumulated other comprehensive income 10.3 8.3 Retained deficit (387.6) (363.6) Total stockholders' equity attributable to Shift4 Payments, Inc. 356.5 347.3 Noncontrolling interests 122.7 133.3 Total stockholders' equity 479.2 480.6 Total liabilities and stockholders' equity $ 2,590.6 $ 2,554.0 1 5 15
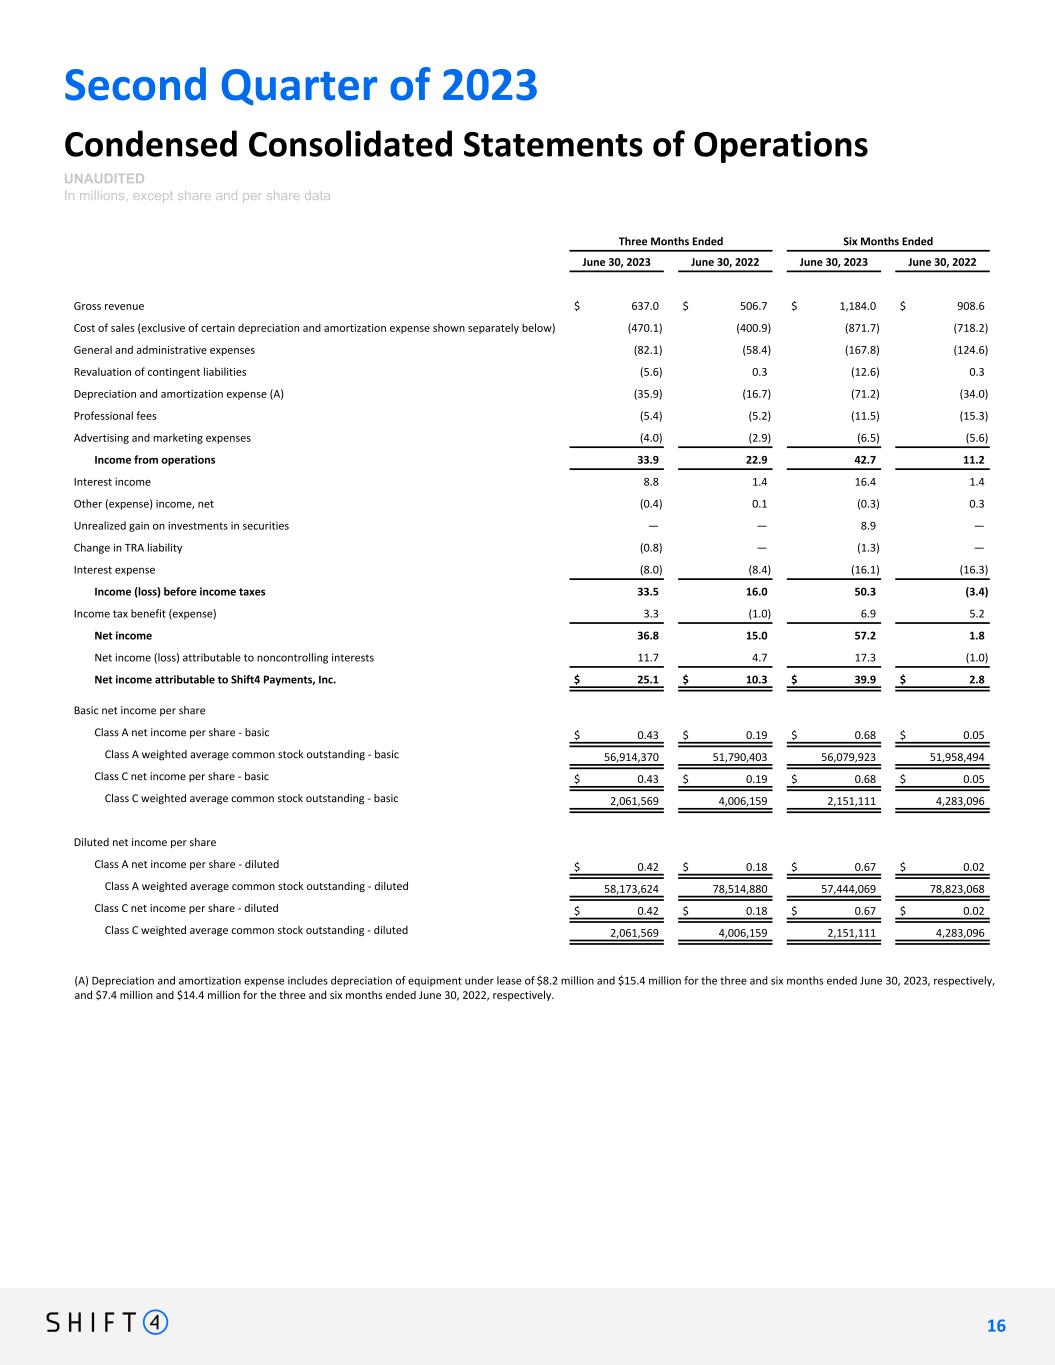
Second Quarter of 2023 Condensed Consolidated Statements of Operations UNAUDITED In millions, except share and per share data Three Months Ended Six Months Ended June 30, 2023 June 30, 2022 June 30, 2023 June 30, 2022 Gross revenue $ 637.0 $ 506.7 $ 1,184.0 $ 908.6 Cost of sales (exclusive of certain depreciation and amortization expense shown separately below) (470.1) (400.9) (871.7) (718.2) General and administrative expenses (82.1) (58.4) (167.8) (124.6) Revaluation of contingent liabilities (5.6) 0.3 (12.6) 0.3 Depreciation and amortization expense (A) (35.9) (16.7) (71.2) (34.0) Professional fees (5.4) (5.2) (11.5) (15.3) Advertising and marketing expenses (4.0) (2.9) (6.5) (5.6) Income from operations 33.9 22.9 42.7 11.2 Interest income 8.8 1.4 16.4 1.4 Other (expense) income, net (0.4) 0.1 (0.3) 0.3 Unrealized gain on investments in securities — — 8.9 — Change in TRA liability (0.8) — (1.3) — Interest expense (8.0) (8.4) (16.1) (16.3) Income (loss) before income taxes 33.5 16.0 50.3 (3.4) Income tax benefit (expense) 3.3 (1.0) 6.9 5.2 Net income 36.8 15.0 57.2 1.8 Net income (loss) attributable to noncontrolling interests 11.7 4.7 17.3 (1.0) Net income attributable to Shift4 Payments, Inc. $ 25.1 $ 10.3 $ 39.9 $ 2.8 Basic net income per share Class A net income per share - basic $ 0.43 $ 0.19 $ 0.68 $ 0.05 Class A weighted average common stock outstanding - basic 56,914,370 51,790,403 56,079,923 51,958,494 Class C net income per share - basic $ 0.43 $ 0.19 $ 0.68 $ 0.05 Class C weighted average common stock outstanding - basic 2,061,569 4,006,159 2,151,111 4,283,096 Diluted net income per share Class A net income per share - diluted $ 0.42 $ 0.18 $ 0.67 $ 0.02 Class A weighted average common stock outstanding - diluted 58,173,624 78,514,880 57,444,069 78,823,068 Class C net income per share - diluted $ 0.42 $ 0.18 $ 0.67 $ 0.02 Class C weighted average common stock outstanding - diluted 2,061,569 4,006,159 2,151,111 4,283,096 (A) Depreciation and amortization expense includes depreciation of equipment under lease of $8.2 million and $15.4 million for the three and six months ended June 30, 2023, respectively, and $7.4 million and $14.4 million for the three and six months ended June 30, 2022, respectively. 1 6 16
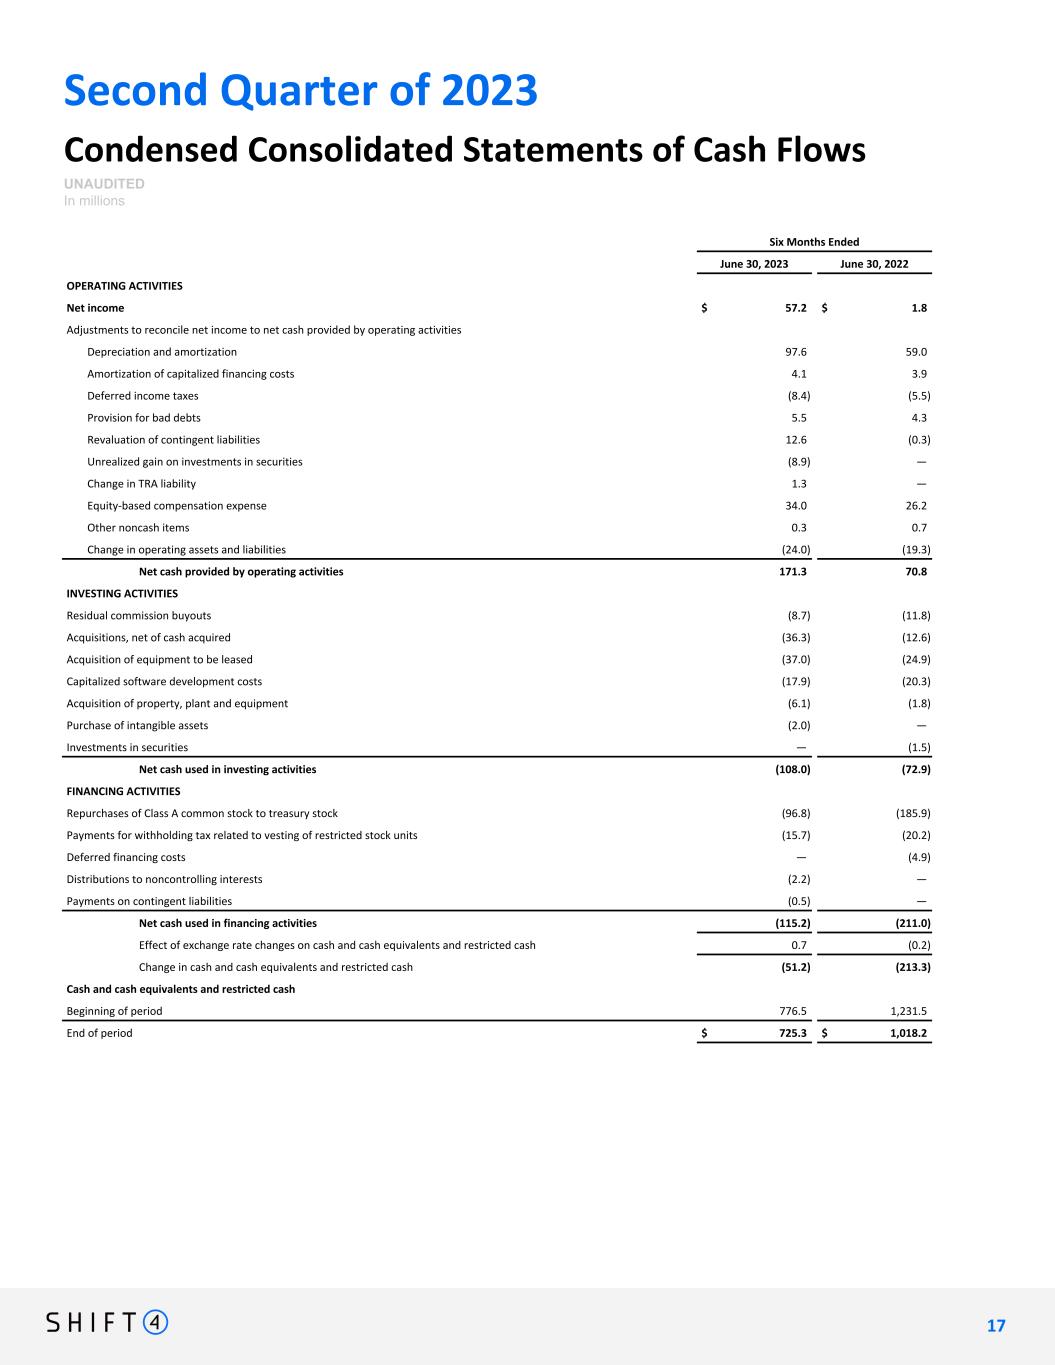
Second Quarter of 2023 Condensed Consolidated Statements of Cash Flows UNAUDITED In millions Six Months Ended June 30, 2023 June 30, 2022 OPERATING ACTIVITIES Net income $ 57.2 $ 1.8 Adjustments to reconcile net income to net cash provided by operating activities Depreciation and amortization 97.6 59.0 Amortization of capitalized financing costs 4.1 3.9 Deferred income taxes (8.4) (5.5) Provision for bad debts 5.5 4.3 Revaluation of contingent liabilities 12.6 (0.3) Unrealized gain on investments in securities (8.9) — Change in TRA liability 1.3 — Equity-based compensation expense 34.0 26.2 Other noncash items 0.3 0.7 Change in operating assets and liabilities (24.0) (19.3) Net cash provided by operating activities 171.3 70.8 INVESTING ACTIVITIES Residual commission buyouts (8.7) (11.8) Acquisitions, net of cash acquired (36.3) (12.6) Acquisition of equipment to be leased (37.0) (24.9) Capitalized software development costs (17.9) (20.3) Acquisition of property, plant and equipment (6.1) (1.8) Purchase of intangible assets (2.0) — Investments in securities — (1.5) Net cash used in investing activities (108.0) (72.9) FINANCING ACTIVITIES Repurchases of Class A common stock to treasury stock (96.8) (185.9) Payments for withholding tax related to vesting of restricted stock units (15.7) (20.2) Deferred financing costs — (4.9) Distributions to noncontrolling interests (2.2) — Payments on contingent liabilities (0.5) — Net cash used in financing activities (115.2) (211.0) Effect of exchange rate changes on cash and cash equivalents and restricted cash 0.7 (0.2) Change in cash and cash equivalents and restricted cash (51.2) (213.3) Cash and cash equivalents and restricted cash Beginning of period 776.5 1,231.5 End of period $ 725.3 $ 1,018.2 1 7 17
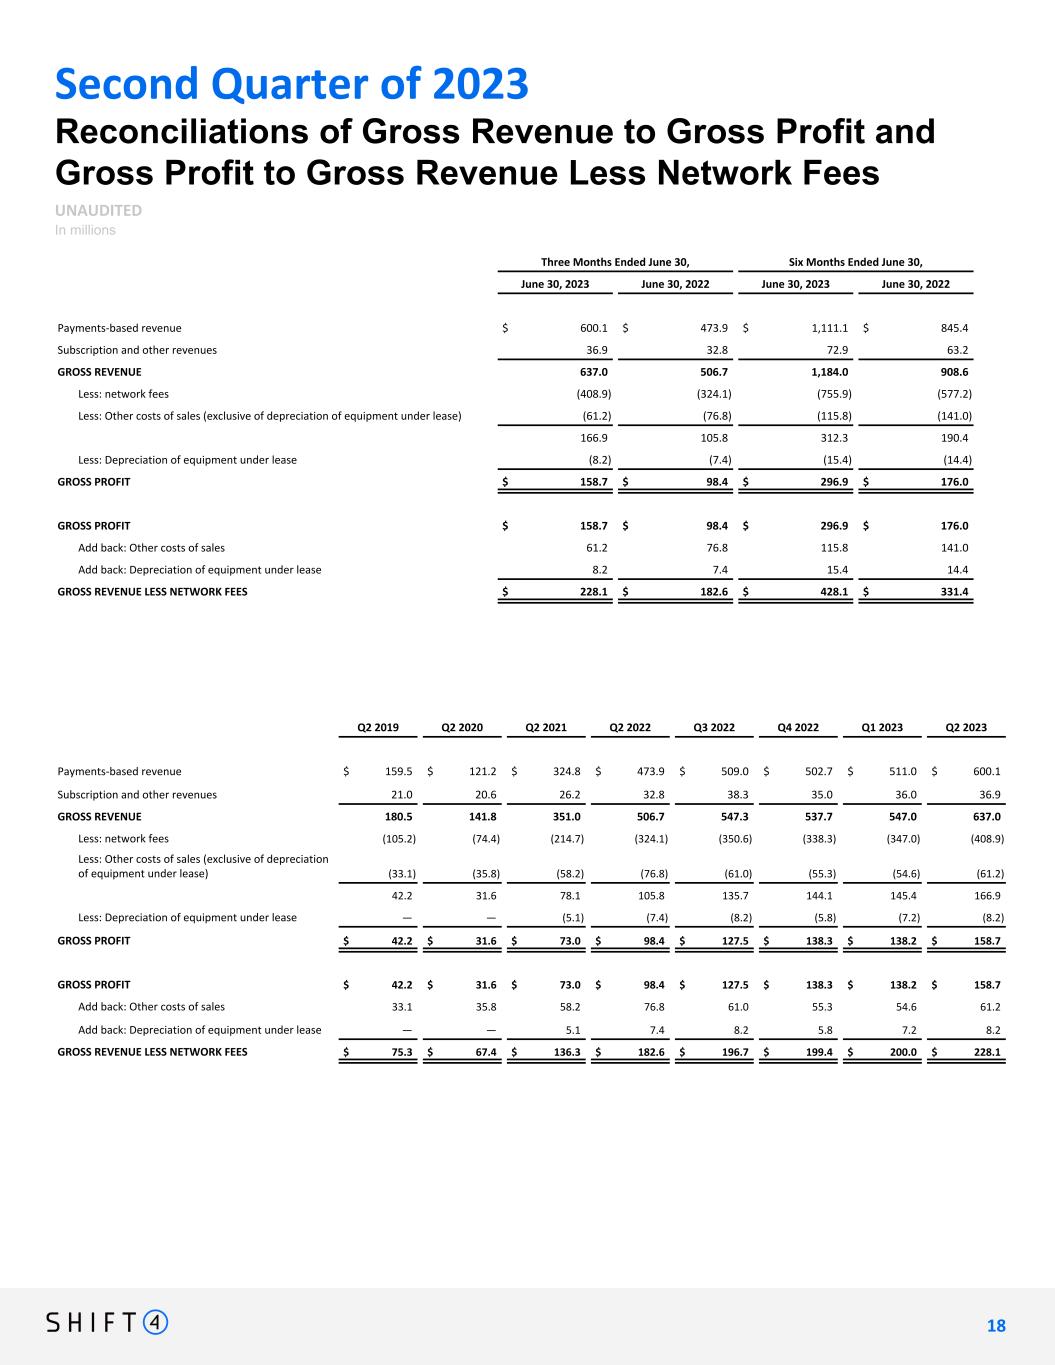
Second Quarter of 2023 Reconciliations of Gross Revenue to Gross Profit and Gross Profit to Gross Revenue Less Network Fees UNAUDITED In millions Three Months Ended June 30, Six Months Ended June 30, June 30, 2023 June 30, 2022 June 30, 2023 June 30, 2022 Payments-based revenue $ 600.1 $ 473.9 $ 1,111.1 $ 845.4 Subscription and other revenues 36.9 32.8 72.9 63.2 GROSS REVENUE 637.0 506.7 1,184.0 908.6 Less: network fees (408.9) (324.1) (755.9) (577.2) Less: Other costs of sales (exclusive of depreciation of equipment under lease) (61.2) (76.8) (115.8) (141.0) 166.9 105.8 312.3 190.4 Less: Depreciation of equipment under lease (8.2) (7.4) (15.4) (14.4) GROSS PROFIT $ 158.7 $ 98.4 $ 296.9 $ 176.0 GROSS PROFIT $ 158.7 $ 98.4 $ 296.9 $ 176.0 Add back: Other costs of sales 61.2 76.8 115.8 141.0 Add back: Depreciation of equipment under lease 8.2 7.4 15.4 14.4 GROSS REVENUE LESS NETWORK FEES $ 228.1 $ 182.6 $ 428.1 $ 331.4 Q2 2019 Q2 2020 Q2 2021 Q2 2022 Q3 2022 Q4 2022 Q1 2023 Q2 2023 Payments-based revenue $ 159.5 $ 121.2 $ 324.8 $ 473.9 $ 509.0 $ 502.7 $ 511.0 $ 600.1 Subscription and other revenues 21.0 20.6 26.2 32.8 38.3 35.0 36.0 36.9 GROSS REVENUE 180.5 141.8 351.0 506.7 547.3 537.7 547.0 637.0 Less: network fees (105.2) (74.4) (214.7) (324.1) (350.6) (338.3) (347.0) (408.9) Less: Other costs of sales (exclusive of depreciation of equipment under lease) (33.1) (35.8) (58.2) (76.8) (61.0) (55.3) (54.6) (61.2) 42.2 31.6 78.1 105.8 135.7 144.1 145.4 166.9 Less: Depreciation of equipment under lease — — (5.1) (7.4) (8.2) (5.8) (7.2) (8.2) GROSS PROFIT $ 42.2 $ 31.6 $ 73.0 $ 98.4 $ 127.5 $ 138.3 $ 138.2 $ 158.7 GROSS PROFIT $ 42.2 $ 31.6 $ 73.0 $ 98.4 $ 127.5 $ 138.3 $ 138.2 $ 158.7 Add back: Other costs of sales 33.1 35.8 58.2 76.8 61.0 55.3 54.6 61.2 Add back: Depreciation of equipment under lease — — 5.1 7.4 8.2 5.8 7.2 8.2 GROSS REVENUE LESS NETWORK FEES $ 75.3 $ 67.4 $ 136.3 $ 182.6 $ 196.7 $ 199.4 $ 200.0 $ 228.1 1 8 18
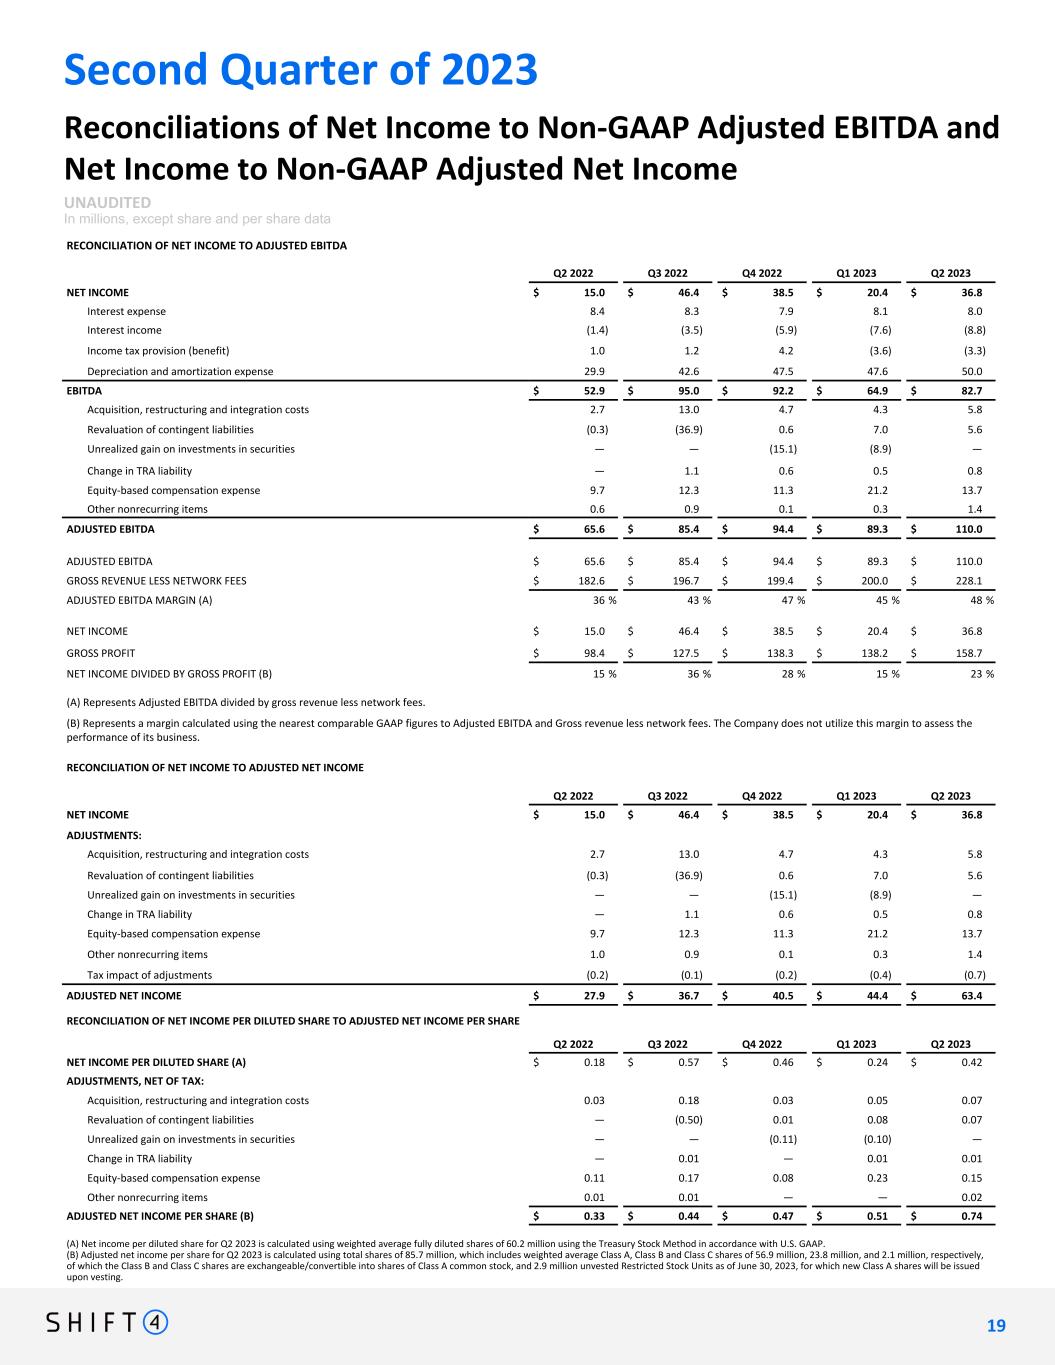
Second Quarter of 2023 Reconciliations of Net Income to Non-GAAP Adjusted EBITDA and Net Income to Non-GAAP Adjusted Net Income UNAUDITED In millions, except share and per share data RECONCILIATION OF NET INCOME TO ADJUSTED EBITDA Q2 2022 Q3 2022 Q4 2022 Q1 2023 Q2 2023 NET INCOME $ 15.0 $ 46.4 $ 38.5 $ 20.4 $ 36.8 Interest expense 8.4 8.3 7.9 8.1 8.0 Interest income (1.4) (3.5) (5.9) (7.6) (8.8) Income tax provision (benefit) 1.0 1.2 4.2 (3.6) (3.3) Depreciation and amortization expense 29.9 42.6 47.5 47.6 50.0 EBITDA $ 52.9 $ 95.0 $ 92.2 $ 64.9 $ 82.7 Acquisition, restructuring and integration costs 2.7 13.0 4.7 4.3 5.8 Revaluation of contingent liabilities (0.3) (36.9) 0.6 7.0 5.6 Unrealized gain on investments in securities — — (15.1) (8.9) — Change in TRA liability — 1.1 0.6 0.5 0.8 Equity-based compensation expense 9.7 12.3 11.3 21.2 13.7 Other nonrecurring items 0.6 0.9 0.1 0.3 1.4 ADJUSTED EBITDA $ 65.6 $ 85.4 $ 94.4 $ 89.3 $ 110.0 ADJUSTED EBITDA $ 65.6 $ 85.4 $ 94.4 $ 89.3 $ 110.0 GROSS REVENUE LESS NETWORK FEES $ 182.6 $ 196.7 $ 199.4 $ 200.0 $ 228.1 ADJUSTED EBITDA MARGIN (A) 36 % 43 % 47 % 45 % 48 % NET INCOME $ 15.0 $ 46.4 $ 38.5 $ 20.4 $ 36.8 GROSS PROFIT $ 98.4 $ 127.5 $ 138.3 $ 138.2 $ 158.7 NET INCOME DIVIDED BY GROSS PROFIT (B) 15 % 36 % 28 % 15 % 23 % (A) Represents Adjusted EBITDA divided by gross revenue less network fees. (B) Represents a margin calculated using the nearest comparable GAAP figures to Adjusted EBITDA and Gross revenue less network fees. The Company does not utilize this margin to assess the performance of its business. RECONCILIATION OF NET INCOME TO ADJUSTED NET INCOME Q2 2022 Q3 2022 Q4 2022 Q1 2023 Q2 2023 NET INCOME $ 15.0 $ 46.4 $ 38.5 $ 20.4 $ 36.8 ADJUSTMENTS: Acquisition, restructuring and integration costs 2.7 13.0 4.7 4.3 5.8 Revaluation of contingent liabilities (0.3) (36.9) 0.6 7.0 5.6 Unrealized gain on investments in securities — — (15.1) (8.9) — Change in TRA liability — 1.1 0.6 0.5 0.8 Equity-based compensation expense 9.7 12.3 11.3 21.2 13.7 Other nonrecurring items 1.0 0.9 0.1 0.3 1.4 Tax impact of adjustments (0.2) (0.1) (0.2) (0.4) (0.7) ADJUSTED NET INCOME $ 27.9 $ 36.7 $ 40.5 $ 44.4 $ 63.4 RECONCILIATION OF NET INCOME PER DILUTED SHARE TO ADJUSTED NET INCOME PER SHARE Q2 2022 Q3 2022 Q4 2022 Q1 2023 Q2 2023 NET INCOME PER DILUTED SHARE (A) $ 0.18 $ 0.57 $ 0.46 $ 0.24 $ 0.42 ADJUSTMENTS, NET OF TAX: Acquisition, restructuring and integration costs 0.03 0.18 0.03 0.05 0.07 Revaluation of contingent liabilities — (0.50) 0.01 0.08 0.07 Unrealized gain on investments in securities — — (0.11) (0.10) — Change in TRA liability — 0.01 — 0.01 0.01 Equity-based compensation expense 0.11 0.17 0.08 0.23 0.15 Other nonrecurring items 0.01 0.01 — — 0.02 ADJUSTED NET INCOME PER SHARE (B) $ 0.33 $ 0.44 $ 0.47 $ 0.51 $ 0.74 (A) Net income per diluted share for Q2 2023 is calculated using weighted average fully diluted shares of 60.2 million using the Treasury Stock Method in accordance with U.S. GAAP. (B) Adjusted net income per share for Q2 2023 is calculated using total shares of 85.7 million, which includes weighted average Class A, Class B and Class C shares of 56.9 million, 23.8 million, and 2.1 million, respectively, of which the Class B and Class C shares are exchangeable/convertible into shares of Class A common stock, and 2.9 million unvested Restricted Stock Units as of June 30, 2023, for which new Class A shares will be issued upon vesting. 1 9 19
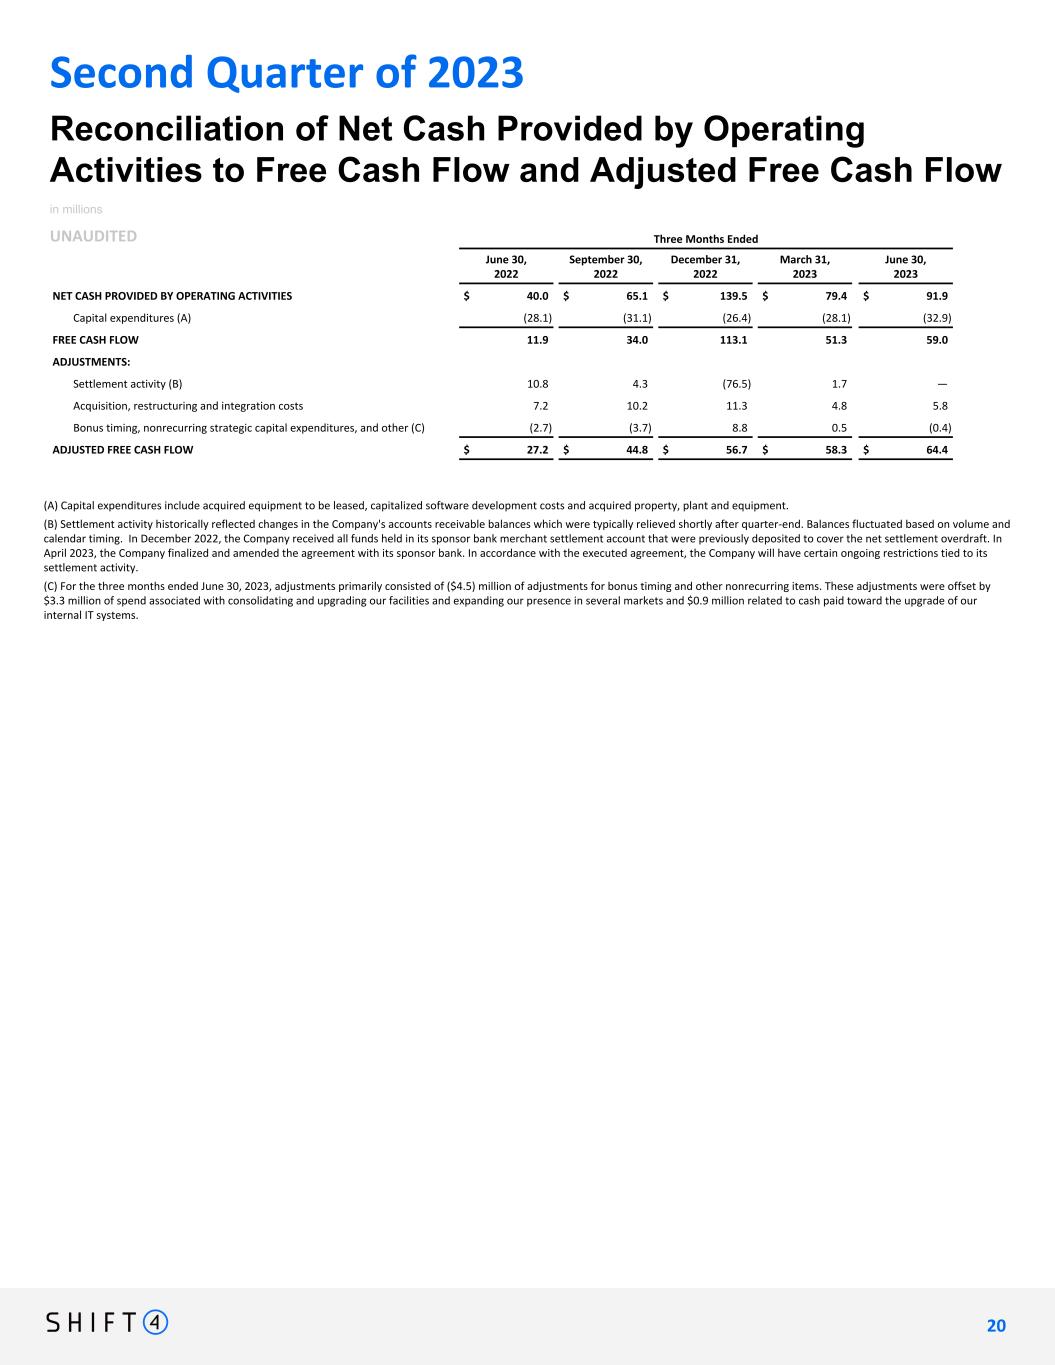
Three Months Ended June 30, 2022 September 30, 2022 December 31, 2022 March 31, 2023 June 30, 2023 NET CASH PROVIDED BY OPERATING ACTIVITIES $ 40.0 $ 65.1 $ 139.5 $ 79.4 $ 91.9 Capital expenditures (A) (28.1) (31.1) (26.4) (28.1) (32.9) FREE CASH FLOW 11.9 34.0 113.1 51.3 59.0 ADJUSTMENTS: Settlement activity (B) 10.8 4.3 (76.5) 1.7 — Acquisition, restructuring and integration costs 7.2 10.2 11.3 4.8 5.8 Bonus timing, nonrecurring strategic capital expenditures, and other (C) (2.7) (3.7) 8.8 0.5 (0.4) ADJUSTED FREE CASH FLOW $ 27.2 $ 44.8 $ 56.7 $ 58.3 $ 64.4 Reconciliation of Net Cash Provided by Operating Activities to Free Cash Flow and Adjusted Free Cash Flow in millions UNAUDITED Second Quarter of 2023 (A) Capital expenditures include acquired equipment to be leased, capitalized software development costs and acquired property, plant and equipment. (B) Settlement activity historically reflected changes in the Company's accounts receivable balances which were typically relieved shortly after quarter-end. Balances fluctuated based on volume and calendar timing. In December 2022, the Company received all funds held in its sponsor bank merchant settlement account that were previously deposited to cover the net settlement overdraft. In April 2023, the Company finalized and amended the agreement with its sponsor bank. In accordance with the executed agreement, the Company will have certain ongoing restrictions tied to its settlement activity. (C) For the three months ended June 30, 2023, adjustments primarily consisted of ($4.5) million of adjustments for bonus timing and other nonrecurring items. These adjustments were offset by $3.3 million of spend associated with consolidating and upgrading our facilities and expanding our presence in several markets and $0.9 million related to cash paid toward the upgrade of our internal IT systems. 2 0 20
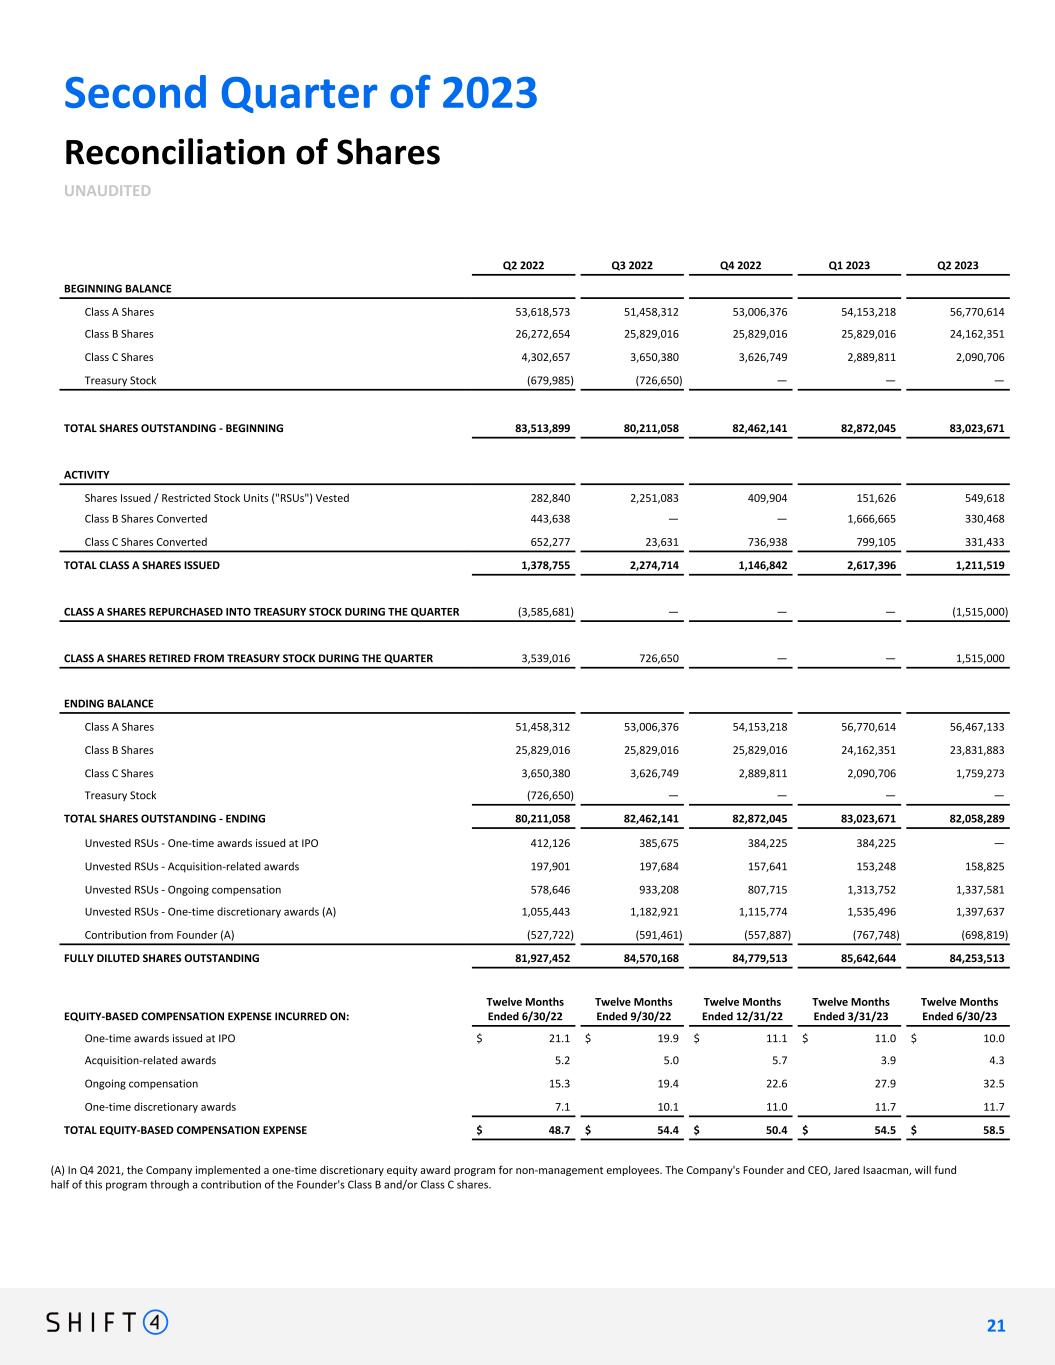
Second Quarter of 2023 Reconciliation of Shares UNAUDITED Q2 2022 Q3 2022 Q4 2022 Q1 2023 Q2 2023 BEGINNING BALANCE Class A Shares 53,618,573 51,458,312 53,006,376 54,153,218 56,770,614 Class B Shares 26,272,654 25,829,016 25,829,016 25,829,016 24,162,351 Class C Shares 4,302,657 3,650,380 3,626,749 2,889,811 2,090,706 Treasury Stock (679,985) (726,650) — — — TOTAL SHARES OUTSTANDING - BEGINNING 83,513,899 80,211,058 82,462,141 82,872,045 83,023,671 ACTIVITY Shares Issued / Restricted Stock Units ("RSUs") Vested 282,840 2,251,083 409,904 151,626 549,618 Class B Shares Converted 443,638 — — 1,666,665 330,468 Class C Shares Converted 652,277 23,631 736,938 799,105 331,433 TOTAL CLASS A SHARES ISSUED 1,378,755 2,274,714 1,146,842 2,617,396 1,211,519 CLASS A SHARES REPURCHASED INTO TREASURY STOCK DURING THE QUARTER (3,585,681) — — — (1,515,000) CLASS A SHARES RETIRED FROM TREASURY STOCK DURING THE QUARTER 3,539,016 726,650 — — 1,515,000 ENDING BALANCE Class A Shares 51,458,312 53,006,376 54,153,218 56,770,614 56,467,133 Class B Shares 25,829,016 25,829,016 25,829,016 24,162,351 23,831,883 Class C Shares 3,650,380 3,626,749 2,889,811 2,090,706 1,759,273 Treasury Stock (726,650) — — — — TOTAL SHARES OUTSTANDING - ENDING 80,211,058 82,462,141 82,872,045 83,023,671 82,058,289 Unvested RSUs - One-time awards issued at IPO 412,126 385,675 384,225 384,225 — Unvested RSUs - Acquisition-related awards 197,901 197,684 157,641 153,248 158,825 Unvested RSUs - Ongoing compensation 578,646 933,208 807,715 1,313,752 1,337,581 Unvested RSUs - One-time discretionary awards (A) 1,055,443 1,182,921 1,115,774 1,535,496 1,397,637 Contribution from Founder (A) (527,722) (591,461) (557,887) (767,748) (698,819) FULLY DILUTED SHARES OUTSTANDING 81,927,452 84,570,168 84,779,513 85,642,644 84,253,513 EQUITY-BASED COMPENSATION EXPENSE INCURRED ON: Twelve Months Ended 6/30/22 Twelve Months Ended 9/30/22 Twelve Months Ended 12/31/22 Twelve Months Ended 3/31/23 Twelve Months Ended 6/30/23 One-time awards issued at IPO $ 21.1 $ 19.9 $ 11.1 $ 11.0 $ 10.0 Acquisition-related awards 5.2 5.0 5.7 3.9 4.3 Ongoing compensation 15.3 19.4 22.6 27.9 32.5 One-time discretionary awards 7.1 10.1 11.0 11.7 11.7 TOTAL EQUITY-BASED COMPENSATION EXPENSE $ 48.7 $ 54.4 $ 50.4 $ 54.5 $ 58.5 (A) In Q4 2021, the Company implemented a one-time discretionary equity award program for non-management employees. The Company's Founder and CEO, Jared Isaacman, will fund half of this program through a contribution of the Founder's Class B and/or Class C shares. 2 1 21