
Q3 2024 SHAREHOLDER LETTER INVESTORS.SHIFT4.COM 'Tis the Season for Enterprise Wins Exhibit 99.1
Non-GAAP Financial Measures and Key Performance Indicators Forward-Looking Statements We use supplemental measures of our performance which are derived from our consolidated financial information but which are not presented in our consolidated financial statements prepared in accordance with U.S. generally accepted accounting principles ("GAAP"). These non-GAAP financial measures include: gross revenue less network fees, which includes interchange and adjustment fees; adjusted net income; adjusted net income per share; free cash flow; Adjusted Free Cash Flow; earnings before interest expense, interest income, income taxes, depreciation, and amortization (“EBITDA”); Adjusted EBITDA; Adjusted EBITDA conversion rate; and Adjusted EBITDA margin. Gross revenue less network fees represents a key performance metric that management uses to measure changes in the mix and value derived from our customer base as we continue to execute our strategy to expand our reach to serve larger, complex merchants. Adjusted net income represents net income adjusted for certain non-cash and other nonrecurring items that management believes are not indicative of ongoing operations, such as acquisition, restructuring and integration costs, revaluation of contingent liabilities, impairment of intangible assets, unrealized gain (loss) on investments in securities, change in TRA liability, equity-based compensation expense, and foreign exchange and other nonrecurring items. Adjusted EBITDA is the primary financial performance measure used by management to evaluate its business and monitor results of operations. Adjusted EBITDA represents EBITDA further adjusted for certain non- cash and other nonrecurring items that management believes are not indicative of ongoing operations. These adjustments include acquisition, restructuring and integration costs, revaluation of contingent liabilities, impairment of intangible assets, unrealized gain (loss) on investments in securities, changes in TRA liability, equity-based compensation expense, and foreign exchange and other nonrecurring items. Free cash flow represents net cash provided by operating activities adjusted for non-discretionary capital expenditures. Adjusted EBITDA Margin represents Adjusted EBITDA divided by gross revenue less network fees. Free cash flow represents net cash provided by operating activities adjusted for certain capital expenditures. Adjusted Free Cash Flow represents free cash flow further adjusted for certain transactions that are not indicative of future operating cash flows, including settlement activity (which represents the change in our settlement assets and liabilities), acquisition, restructuring and integration costs, the impact of timing of annual performance bonuses, other nonrecurring expenses, and nonrecurring strategic capital expenditures that are not indicative of ongoing activities. We believe Adjusted Free Cash Flow is useful to measure the funds generated in a given period that are available to invest in the business, to repurchase stock and to make strategic decisions. The Adjusted EBITDA conversion rate is calculated as Adjusted Free Cash Flow divided by Adjusted EBITDA. We use non-GAAP financial measures to supplement financial information presented on a GAAP basis. We believe that excluding certain items from our GAAP results allows management to better understand our consolidated financial performance and, in the case of Adjusted Free Cash Flow, our liquidity, from period to period and better project our future consolidated financial performance as forecasts are developed at a level of detail different from that used to prepare GAAP-based financial measures. Moreover, we believe these non-GAAP financial measures provide our stakeholders with useful information to help them evaluate our operating results by facilitating an enhanced understanding of our operating performance and, in the case of Adjusted Free Cash Flow, our liquidity, and enabling them to make more meaningful period to period comparisons. There are limitations to the use of the non-GAAP financial measures presented in this letter. Our non-GAAP financial measures may not be comparable to similarly titled measures of other companies. Other companies, including companies in our industry, may calculate non-GAAP financial measures differently than we do, limiting the usefulness of those measures for comparative purposes. We have based these forward-looking statements largely on our current expectations and projections about future events and financial trends that we believe may affect our business, financial condition and results of operations. These forward-looking statements speak only as of the date of this letter. These statements are neither promises nor guarantees, but involve known and unknown risks, uncertainties and other important factors that may cause our actual results, performance or achievements to be materially different from any future results, performance or achievements expressed or implied by the forward-looking statements, including, but not limited to, the following: the substantial and increasingly intense competition worldwide in the financial services, payments and payment technology industries; potential changes in the competitive landscape, including disintermediation from other participants in the payments chain; the effect of global economic, political and other conditions on trends in consumer, business and government spending; fluctuations in inflation; our ability to anticipate and respond to changing industry trends and the needs and preferences of our merchants and consumers; our reliance on third-party vendors to provide products and services; risks associated with acquisitions; our inability to protect our IT systems and confidential information, as well as the IT systems of third parties we rely on, from continually evolving cybersecurity risks, security breaches and/or other technological risks; compliance with governmental regulation and other legal obligations, particularly related to privacy, data protection The non-GAAP financial measures are not meant to be considered as indicators of performance, or in the case of Adjusted Free Cash Flow, as an indicator of liquidity, in isolation from or as a substitute for financial information prepared in accordance with GAAP, and should be read only in conjunction with financial information presented on a GAAP basis. Reconciliations each of EBITDA and Adjusted EBITDA, gross revenue less network fees, adjusted net income, adjusted net income per share, free cash flow and Adjusted Free Cash Flow to, in each case, its most directly comparable GAAP financial measure are presented in Appendix - Financial Information. For 2024, we are unable to provide a reconciliation of Gross revenue less network fees, Adjusted EBITDA, and Adjusted Free Cash Flow to Gross Profit, Net Income, and net cash provided by operating activities, respectively, the nearest comparable GAAP measures, without unreasonable efforts. We encourage you to review the reconciliations in conjunction with the presentation of the non-GAAP financial measures for each of the periods presented. In future fiscal periods, we may exclude such items and may incur income and expenses similar to these excluded items. In addition, key performance indicators include end-to-end payment volume, Blended Spread and margin. End-to- end payment volume is defined as the total dollar amount of payments that we deliver for settlement on behalf of our merchants. Included in end-to-end volume are dollars routed via our international payments platform and alternative payment methods, including cryptocurrency and stock donations, plus volume we route to one or more third party merchant acquirers on behalf of strategic enterprise merchant relationships. This volume does not include volume processed through our legacy gateway-only offering. Blended Spread represents the average yield Shift4 earns on the average end-to-end payment volume processed for a given period after network fees. Blended Spread is calculated as payments-based revenue less gateway revenue and network fees for a given period divided by the end-to-end payment volume processed for the same period. and information security, marketing, cryptocurrency, and consumer protection laws across different markets where we conduct our business; our ability to continue to expand our share of the existing payment processing markets or expand into new markets; additional risks associated with our expansion into international operations, including compliance with and changes in foreign governmental policies, as well as exposure to foreign exchange rates; our ability to integrate and interoperate our services and products with a variety of operating systems, software, devices, and web browsers; our dependence, in part, on our merchant and software partner relationships and strategic partnerships with various institutions to operate and grow our business; and the significant influence Jared Isaacman, our CEO and founder, has over us, including control over decisions that require the approval of stockholders. These and other important factors discussed under the caption “Risk Factors” in Part I, Item 1A. in our Annual Report on Form 10-K for the fiscal year ended December 31, 2023, and our other filings with the Securities and Exchange Commission could cause actual results to differ materially from those indicated by the forward-looking statements made in this letter. Any such forward-looking statements represent management’s estimates as of the date of this letter. While we may elect to update such forward-looking statements at some point in the future, we disclaim any obligation to do so, even if subsequent events cause our views to change. 2 This letter contains forward-looking statements within the meaning of the Private Securities Litigation Reform Act of 1995. Shift4 Payments, Inc. (“we,” “our,” the “Company,” or “Shift4”) intends such forward-looking statements to be covered by the safe harbor provisions for forward-looking statements contained in Section 27A of the Securities Act of 1933, as amended and Section 21E of the Securities Exchange Act of 1934, as amended. All statements contained in this letter, other than statements of historical fact, including, without limitation, statements relating to our position as a leader within our industry; the impact of changes in TRA liability; the anticipated benefits of and costs associated with recent acquisitions; our expectations regarding new customers, acquisitions and other transactions, including of our sales partners and their residual streams, and our ability to close said transactions on the timeline we expect or at all; our market growth and international expansion; our plans and agreements regarding future payment processing commitments; our expectations with respect to the economy; our stock price; and our anticipated financial performance, including our financing activities and our financial outlook and guidance for the remainder of 2024 and future periods, are forward- looking statements. In some cases, you can identify forward-looking statements by terms such as “may,” “will,” “should,” “expect,” “plan,” “anticipate,” “could,” “intend,” “target,” “project,” “contemplate,” “believe,” “estimate,” “predict,” “potential,” or “continue” or the negative of these terms or other similar expressions, though not all forward-looking statements can be identified by such terms or expressions.
We wrapped up another reasonably strong quarter, executing well on our strategy – growing rapidly and profitably, generating free cash flow, improving our products, unlocking efficiencies, enhancing our capital structure and, most importantly, topping off what has become an impressive customer conversion funnel. To be concise, I want to break down what we accomplished this quarter and highlight what we still have going for us as we aim for even greater performance on the road ahead. Q3 Accomplishments • Despite accelerating some of the revenue model rebuild in our recent acquisitions and facing some softening consumer spending, we delivered record Volume of 43.5 Billion, $365 million of GRLNF, $187 million of EBITDA, $111 million of FCF, while maintaining spreads of 60bps. • Adjusted net leverage was____ and we rebuilt our capital structure with new ____ providing substantial firepower for organic and inorganic investments as well as opportunistic buybacks. • Expanded margins to 54% excluding recent M&A drag. • Achieved major hospitality wins, including securing deals with [Wynn Resorts and] KSL Resorts, which encompasses 40 iconic properties like Blue Mountain, Camelback, Deer Valley, and all the Hawaiian Outrigger brands. [We further won Alterra ___ ] • The sports, entertainment, and ticketing wins keep piling up including _______ stadiums. • Grew Skytab system installations quarter-over-quarter _______, including ramping production in the UK and Ireland. • Followed our strategic customers into ____ new countries with many more lined up for the balance of the year. • Pulled forward the Revel and Vectron integration plan and began executing on the Vectron 65,000 merchant conversion opportunity across central Europe, with our first installs already taking place. • Announced the acquisition of Givex, expected to close in Q4, adding over 120,000 new gift and loyalty customers, representing what we believe to be over $300 billion in payment volume cross-sell opportunity. This acquisition also brings product enhancements through a best-in-class gift and loyalty platform. • Increased contracted volume backlog to $30B. • We remain on track to close the year with organic GRLNF exceeding 25% and easily surpassing all mid-term outlook goals set more than three years ago. Dear Shareholders, 3 3 Jared Isaacman CEO jared@shift4.com Dear Shareholders, We wrapped up another reasonably strong quarter, executing well on our strategy – growing rapidly and profitably, generating free cash flow, improving our products, unlocking efficiencies, enhancing our capital structure and, most importantly, topping off what has become an impressive customer conversion funnel. To be concise, I want to break down what we accomplished this quarter and highlight what we still have going for us as we aim for even greater performance on the road ahead. Q3 Accomplishments • Despite accelerating some of the revenue model rebuild in our recent acquisitions and facing some softening co sumer spending, we elivered record end-to-en v l e of $43.5 billion, $253.2 illion of gross profit, $365.1 million of gross revenue less network fees (“GRLNF”), $72.2 million of net income, $187.4 million of Adjusted EBITDA, $182.1 million of net cash provided by operating activities, and $110.6 million of Adjusted FCF, while maintaining spreads of 60 bps. • Expanded Adjusted EBITDA margin to 54%, excluding the drag from recent M&A. • Achieved major hospitality wins, including securing a deal with KSL Resorts, which encompasses some of the most notable ski resorts across the U.S., among other incredible locations. We further won an undisclosed, premier Las Vegas operator of luxury hotel and casino pr perties with locations around the world. • The sports, entertainment, and ticketing wins keep piling up including over ten stadiums this quarter. • Continued our impressive growth with SkyTab, with over 55,000 installs since coming out of beta, and on pace to exceed 35,000 installs in 2024 alone, including ramping production in the UK and Ireland. • Followed our strategic customers into several new countries this quarter, with many more lined up for the balance of the year and into 2025. • Pulled forward the Revel and Vectron integration plan and began executing on the Vectron 65,000 merchant conversion opportunity across central Europe, with our first installs already taking place. • Announced the acquisition of Givex, which closed on November 8th, adding over 130,000 new gift and loyalty customers, representing what we believe to be over $300 billion in payment volume cross-sell pp rtunity. This a quisi ion al o brings pro uct e hanceme ts through a best-in-class gift and loyalty platform. • We r lled $5 billio of contracted volume in t actuals and signed $13 billion of additional volume bringing the backlog to $33 billion.We rebuilt our capital structure with new $1.1 billion senior notes raised in August of this year, providing substantial firepower for organic and inorganic investments, opportunistic buybacks, and/or possible repayment of outstanding convertible bonds. • We remain on track to close the year with organic GRLNF growth exceeding 25% and easily surpassing all mid-term outlook goals set more than three years ago
4 4 With less than two months to go in the year, we have tightened our volume range and raised the mid-point of Q4 GRLNF and EBITDA guidance ranges. If you annualize the midpoint of our Q4 Adjusted EBITDA guidance, we are already at 2025 consensus Adjusted EBITDA. Moreover, on a trailing twelve-month basis, we have surpassed the 2024 medium term guidance objectives established at our inaugural analyst day back in the fall of 2021. This was despite an arguably more challenging operating environment due to higher interest rates, higher inflation, and overall consumer fatigue from spending significantly more eating out and staying at hotels. We're achieving these results as a "good" payments company – not an excellent one. There is still so much we can improve, opportunities to capture and major project endeavors to accomplish. Below are a few highlights, many of which are quantifiable and illustrate the journey ahead: • We have a deep moat around our hospitality business, which is why we keep winning signature hotel and resort accounts. Our 550+ software integrations are nearly impossible to replicate, and we're already expanding this capability into new geographies. • Our sports, entertainment and theme park software is the category leader, ensuring continued SaaS and payment volume growth, including ticketing. • We have one of the world’s best cloud-based restaurant POS platforms in SkyTab, with expanding distribution coverage and extensive cross-sell opportunities. We believe we install the second most table-service restaurant systems in the U.S, the proof points are posted on Twitter/X every day and we are gaining traction in international markets. We are also never content with being second best and our roadmap and playbook give us a real chance at becoming number one. • Our global ecommerce business is growing rapidly. This includes following our strategic customers into many new markets. We've been iterating quickly on our product, and we expect to keep expanding until we have the most impressive geographic coverage in the industry. When we do, we believe we will be able to win additional blue-chip customers. This is a real opportunity that many are overlooking in the Shift4 story. • When it comes to underwriting our long-term growth, remember how advantaged we are by really never needing to win a new customer. Through intelligent capital allocation, we have over 225,000 merchants using some form of our technology, including the soon-to- be Givex customer base, Vectron/Revel restaurant merchants, collectively representing nearly $350 billion in volume to cross-sell onto our payment platform. We run this playbook very well. • Over the last 25 years, we've accumulated some baggage – some going back to the internal software systems we built in our basement days and some through M&A. We have tens of thousands of legacy POS systems that we will eventually move to Skytab, many gateway connections to sunset and other inefficiencies to address. The "Shift4way" includes staying flat, being procedurally driven, embracing radical ownership and passionately deleting ‘parts’. We are still in the early days of this transformation, there are lots of ‘parts’ still to remove, internal systems to replace with Project Phoenix, operations to improve with Mission Control and automation to achieve with AI, but as we progress, you should expect us to become more efficient, improve the service quality, expand margins and become significantly more profitable.
If it wasn’t clear before, we have a lot going on, and I love that. We embrace the complexity because that’s how we differentiate and win. What we do is hard, but the results over our last 4.5 years as a public company speak for themselves and I don’t expect things to slow down anytime soon. I feel we owe it to our investors to spend a day showcasing our technology, breaking down our strategy by vertical and geography, highlighting our advantages and setting new expectations for the years ahead. As such, I expect we will host this investor day alongside our Q4 results in early 2025. I have told our team many times – we are the best company we’ve ever been in our 25-year history, yet there’s still so much more we need to improve and accomplish. We continue to win and support the best merchants imaginable and we have the right strategy, formula and philosophies for rapid execution. If we get it right, we can continue delivering wins worldwide and great results well in to the future. Boldly Forward, Jared Isaacman CEO jared@shift4.com 5 5
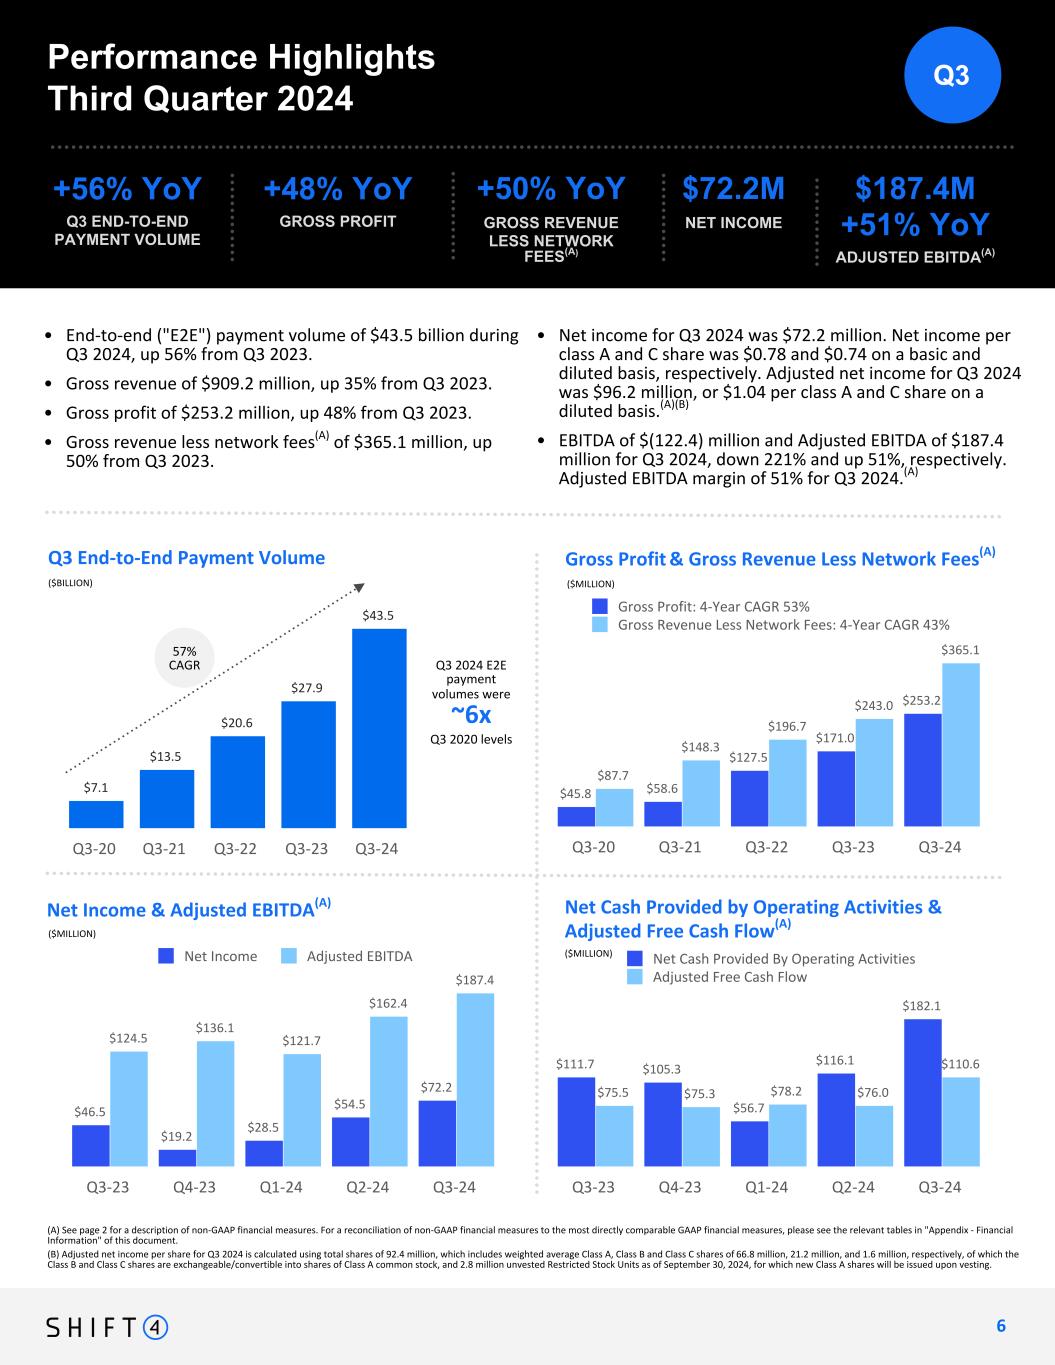
Q3 2024 E2E payment volumes were ~6x Q3 2020 levels $7.1 $13.5 $20.6 $27.9 $43.5 Q3-20 Q3-21 Q3-22 Q3-23 Q3-24 (A) See page 2 for a description of non-GAAP financial measures. For a reconciliation of non-GAAP financial measures to the most directly comparable GAAP financial measures, please see the relevant tables in "Appendix - Financial Information" of this document. (B) Adjusted net income per share for Q3 2024 is calculated using total shares of 92.4 million, which includes weighted average Class A, Class B and Class C shares of 66.8 million, 21.2 million, and 1.6 million, respectively, of which the Class B and Class C shares are exchangeable/convertible into shares of Class A common stock, and 2.8 million unvested Restricted Stock Units as of September 30, 2024, for which new Class A shares will be issued upon vesting. 6 Q3 End-to-End Payment Volume Gross Profit & Gross Revenue Less Network Fees(A) ($BILLION) Performance Highlights Third Quarter 2024 +56% YoY Q3 END-TO-END PAYMENT VOLUME 57% CAGR Net Income & Adjusted EBITDA(A) Net Cash Provided by Operating Activities & Adjusted Free Cash Flow(A) ($MILLION) ($MILLION) ($MILLION) +48% YoY GROSS PROFIT $72.2M NET INCOME • $187.4M +51% YoY ADJUSTED EBITDA(A) +50% YoY GROSS REVENUE LESS NETWORK FEES(A) • End-to-end ("E2E") payment volume of $43.5 billion during Q3 2024, up 56% from Q3 2023. • Gross revenue of $909.2 million, up 35% from Q3 2023. • Gross profit of $253.2 million, up 48% from Q3 2023. • Gross revenue less network fees(A) of $365.1 million, up 50% from Q3 2023. • Net income for Q3 2024 was $72.2 million. Net income per class A and C share was $0.78 and $0.74 on a basic and diluted basis, respectively. Adjusted net income for Q3 2024 was $96.2 million, or $1.04 per class A and C share on a diluted basis.(A)(B) • EBITDA of $(122.4) million and Adjusted EBITDA of $187.4 million for Q3 2024, down 221% and up 51%, respectively. Adjusted EBITDA margin of 51% for Q3 2024.(A) Q3 6 $46.5 $19.2 $28.5 $54.5 $72.2 $124.5 $136.1 $121.7 $162.4 $187.4 Net Income Adjusted EBITDA Q3-23 Q4-23 Q1-24 Q2-24 Q3-24 $45.8 $58.6 $127.5 $171.0 $253.2 $87.7 $148.3 $196.7 $243.0 $365.1 Gross Profit: 4-Year CAGR 53% Gross Revenue Less Network Fees: 4-Year CAGR 43% Q3-20 Q3-21 Q3-22 Q3-23 Q3-24 $111.7 $105.3 $56.7 $116.1 $182.1 $75.5 $75.3 $78.2 $76.0 $110.6 Net Cash Provided By Operating Activities Adjusted Free Cash Flow Q3-23 Q4-23 Q1-24 Q2-24 Q3-24
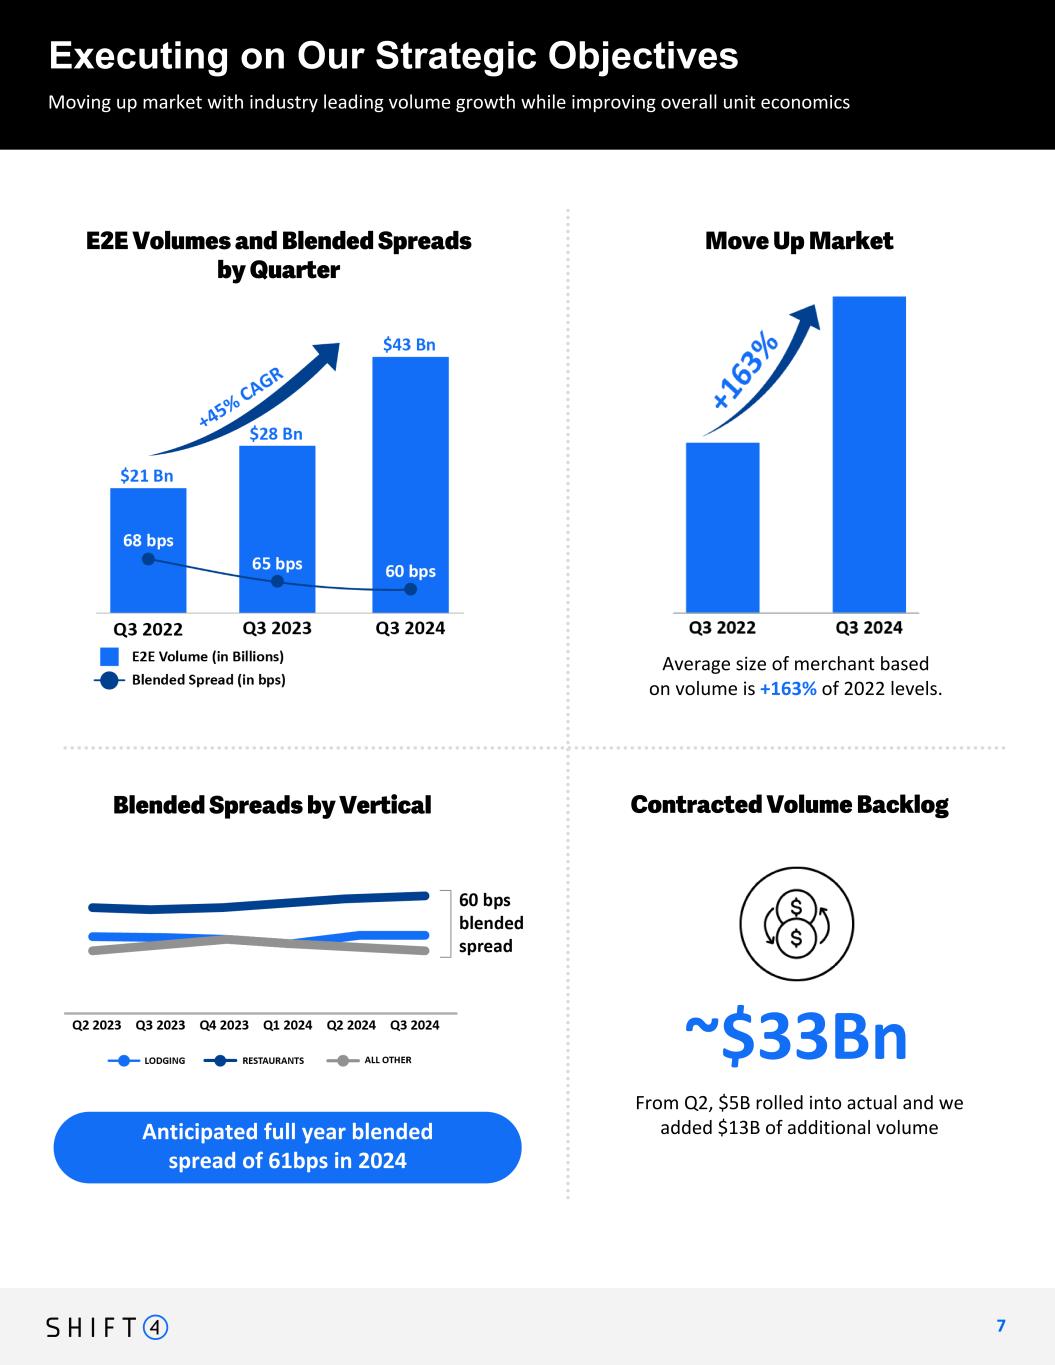
From Q2, $5B rolled into actual and we added $13B of additional volume Moving up market with industry leading volume growth while improving overall unit economics Executing on Our Strategic Objectives 7 7 E2E Volumes and Blended Spreads by Quarter Move Up Market Average size of merchant based on volume is +163% of 2022 levels. Contracted Volume BacklogBlended Spreads by Vertical ~$25Bn ~$33Bn Anticipated full year blended spread of 61bps in 2024 flag increase vs. 25 visually? how do we want to present this? +163% $21B - $28B - $43B 68bps - 65bps -60bps 45% CAGR new chart off to left - average is 60bps blended
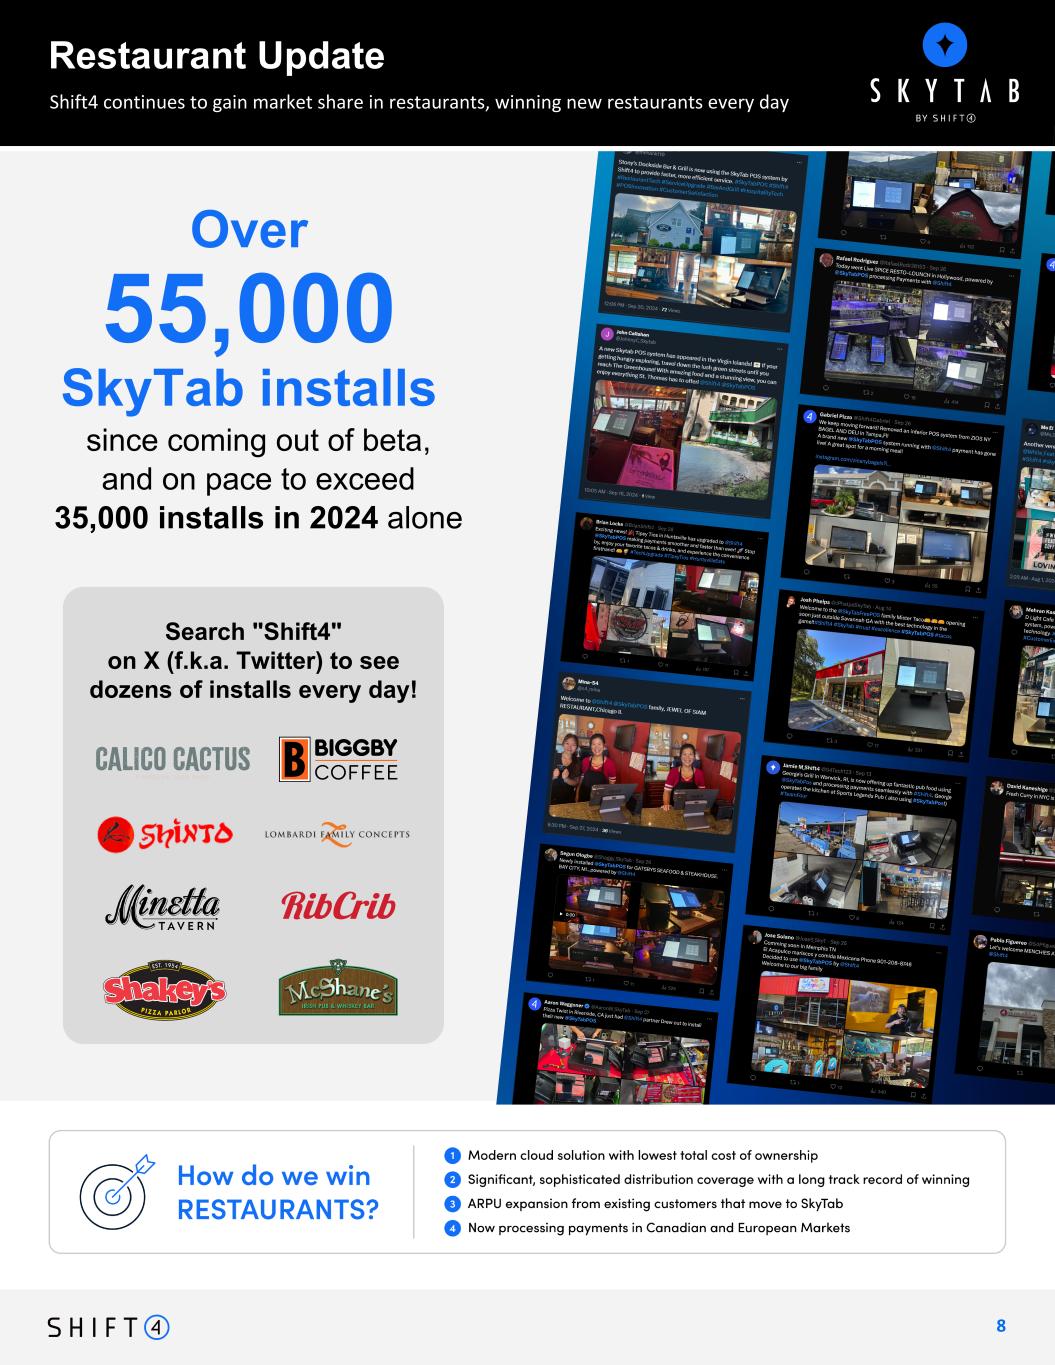
8 Over 55,000 Search "Shift4" on X (f.k.a. Twitter) to see dozens of installs every day! since coming out of beta, and on pace to exceed 35,000 installs in 2024 alone SkyTab installs Shift4 continues to gain market share in restaurants, winning new restaurants every day Restaurant Update
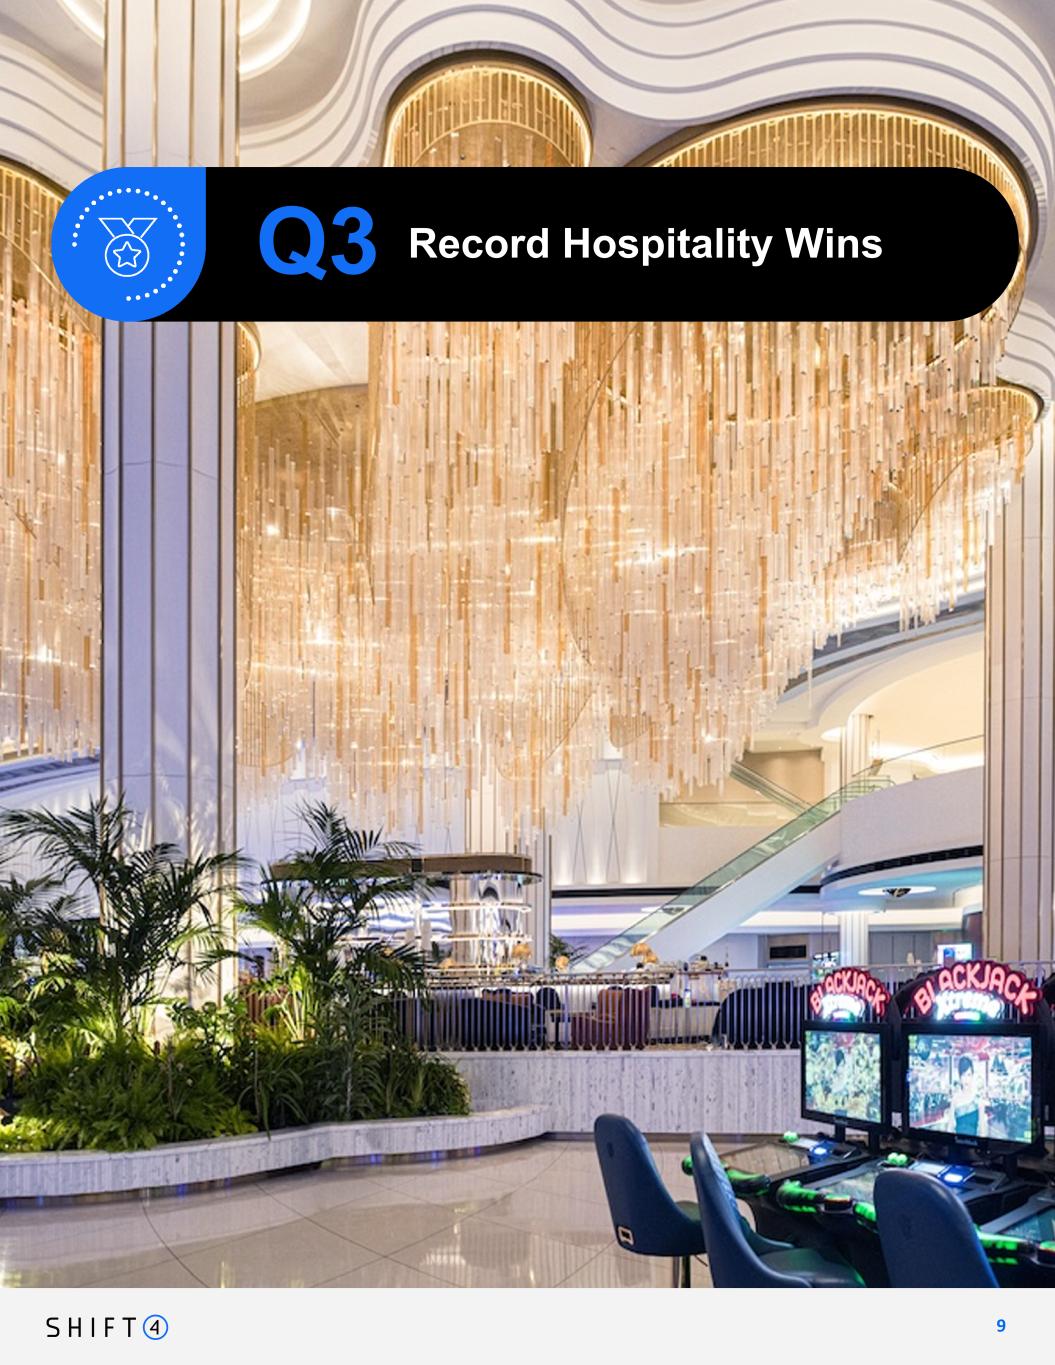
9 9 Q3 Record Hospitality Wins
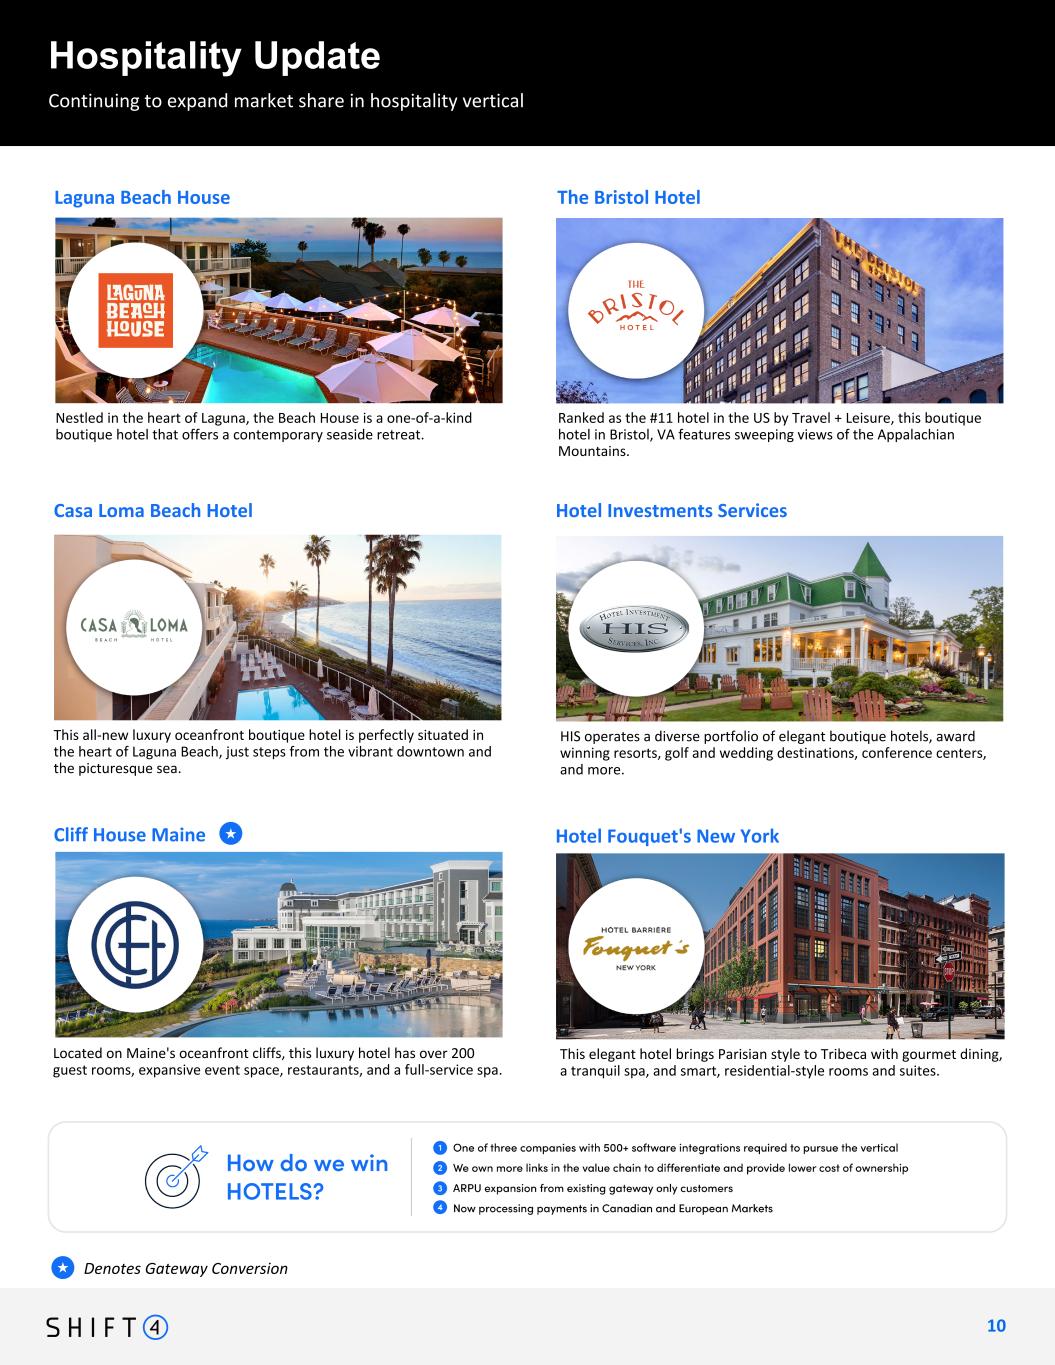
Continuing to expand market share in hospitality vertical Hospitality Update 1 0 10 Continuing to expand arket share in hospitality vertical Denotes Gateway Conversion★ HIS operates a diverse portfolio of elegant boutique hotels, award winning resorts, golf and wedding destinations, conference centers, and more. Cliff House Maine This elegant hotel brings Parisian style to Tribeca with gourmet dining, a tranquil spa, and smart, residential-style rooms and suites. Hotel Fouquet's New York This all-new luxury oceanfront boutique hotel is perfectly situated in the heart of Laguna Beach, just steps from the vibrant downtown and the picturesque sea. ★ Hotel Investments ServicesCasa Loma Beach Hotel Ranked as the #11 hotel in the US by Travel + Leisure, this boutique hotel in Bristol, VA features sweeping views of the Appalachian Mountains. Nestled in the heart of Laguna, the Beach House is a one-of-a-kind boutique hotel that offers a contemporary seaside retreat. The Bristol HotelLaguna Beach House Located on Maine's oceanfront cliffs, this luxury hotel has over 200 guest rooms, expansive event space, restaurants, and a full-service spa.
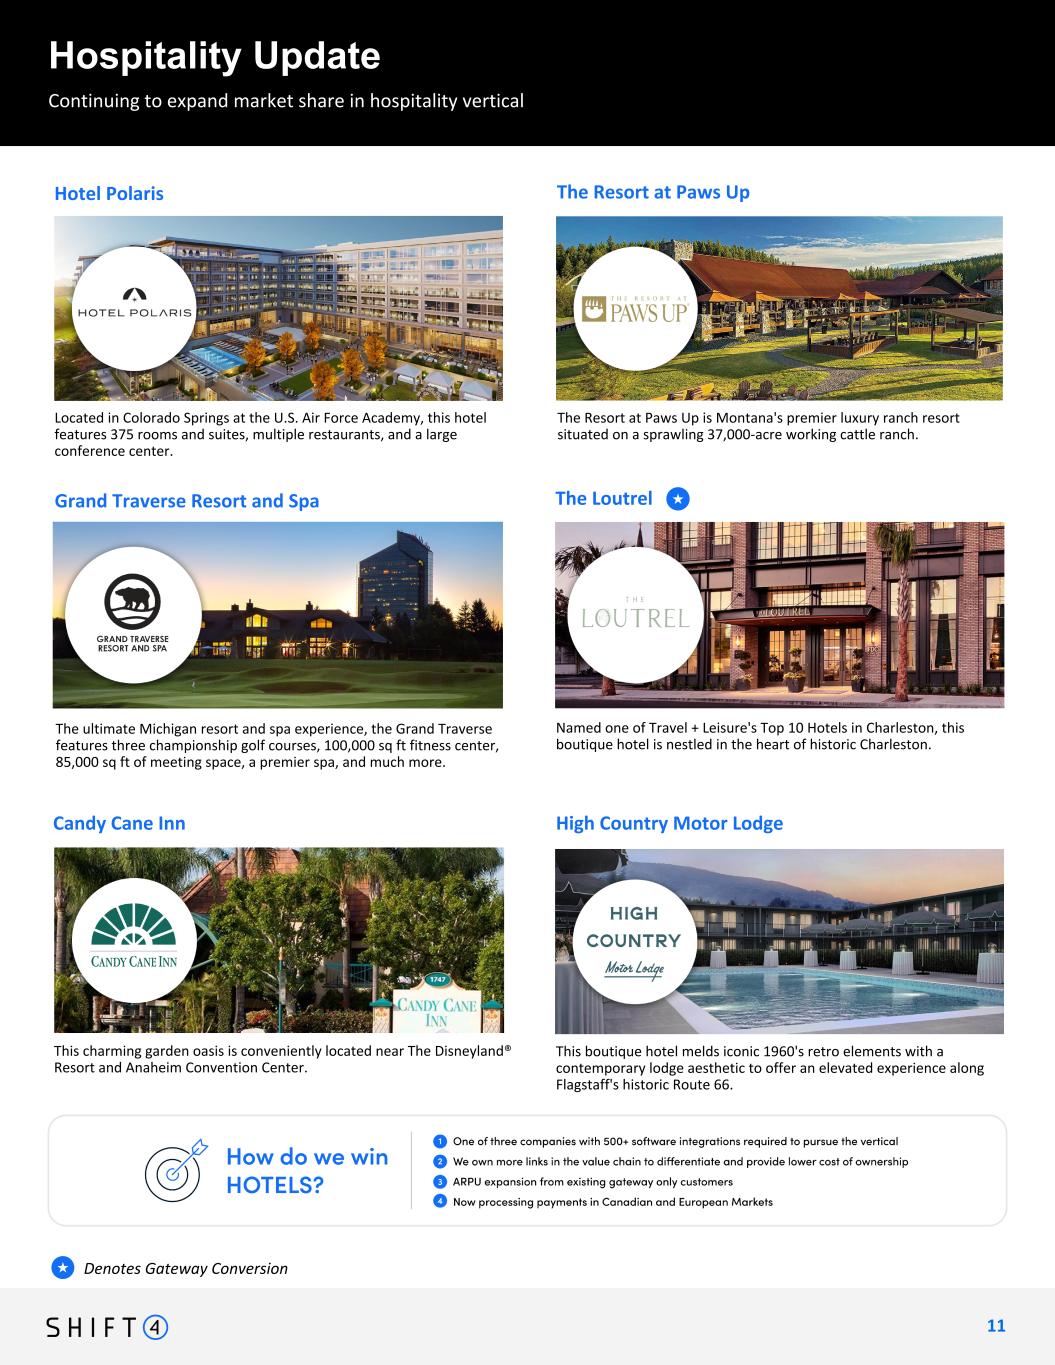
Hospitality Update Denotes Gateway Conversion★ Named one of Travel + Leisure's Top 10 Hotels in Charleston, this boutique hotel is nestled in the heart of historic Charleston. The Loutrel The ultimate Michigan resort and spa experience, the Grand Traverse features three championship golf courses, 100,000 sq ft fitness center, 85,000 sq ft of meeting space, a premier spa, and much more. Grand Traverse Resort and Spa Located in Colorado Springs at the U.S. Air Force Academy, this hotel features 375 rooms and suites, multiple restaurants, and a large conference center. Hotel Polaris 1 1 11 The Resort at Paws Up is Montana's premier luxury ranch resort situated on a sprawling 37,000-acre working cattle ranch. The Resort at Paws Up This boutique hotel melds iconic 1960's retro elements with a contemporary lodge aesthetic to offer an elevated experience along Flagstaff's historic Route 66. High Country Motor Lodge This charming garden oasis is conveniently located near The Disneyland® Resort and Anaheim Convention Center. Candy Cane Inn Continuing to expand market share in hospitality vertical ★
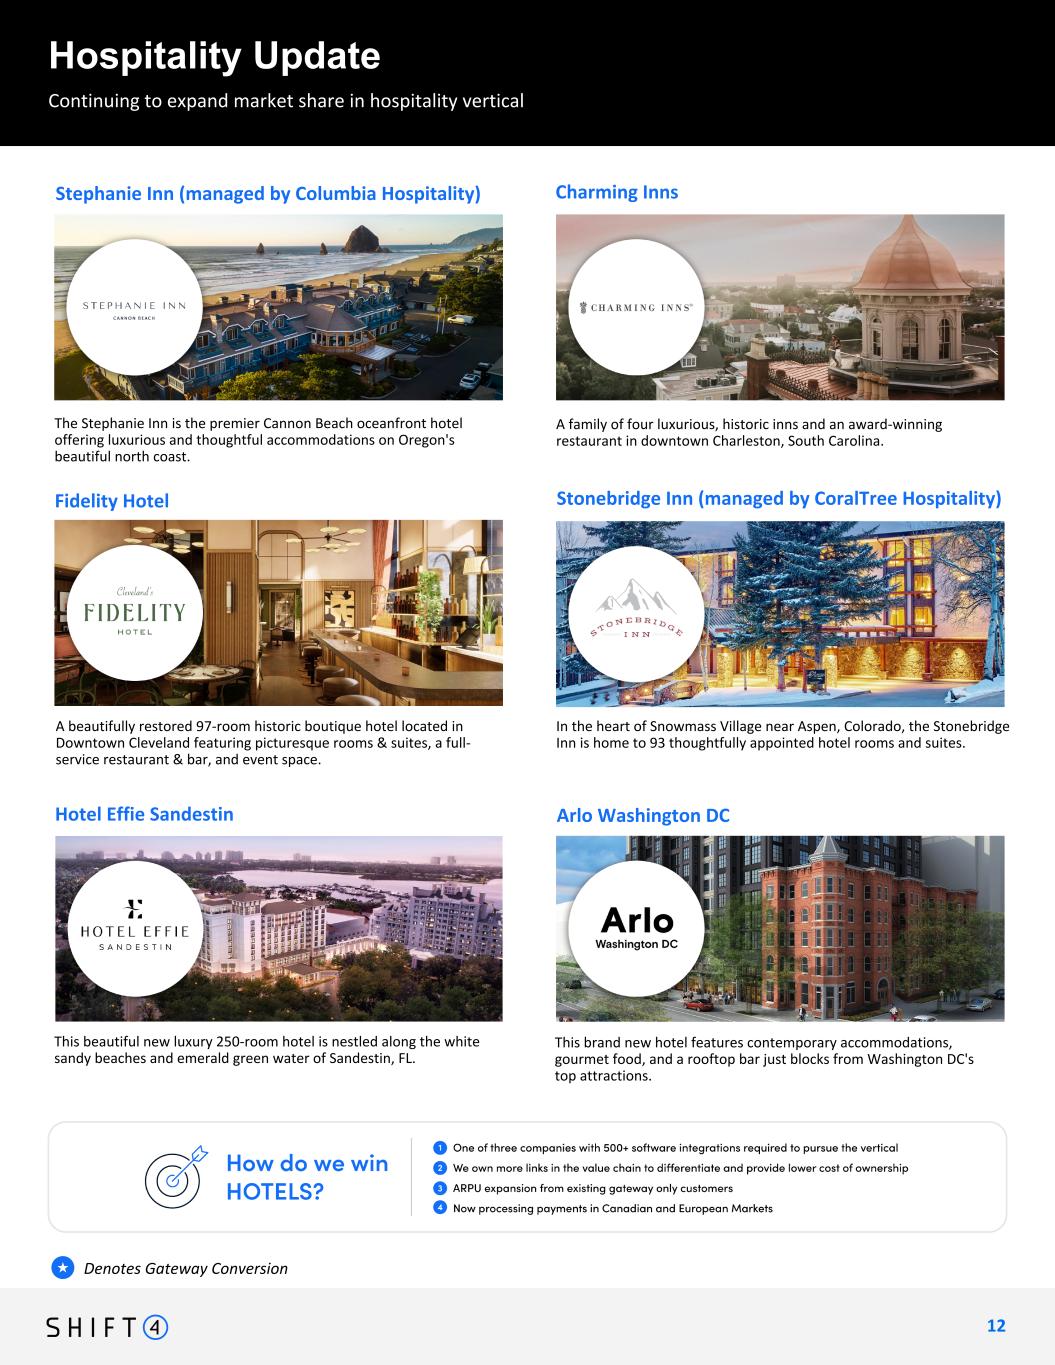
Continuing to expand market share in hospitality vertical Hospitality Update 1 2 12 Continuing to expand arket share in hospitality vertical Denotes Gateway Conversion★ Hotel Effie Sandestin This brand new hotel features contemporary accommodations, gourmet food, and a rooftop bar just blocks from Washington DC's top attractions. Arlo Washington DC This beautiful new luxury 250-room hotel is nestled along the white sandy beaches and emerald green water of Sandestin, FL. In the heart of Snowmass Village near Aspen, Colorado, the Stonebridge Inn is home to 93 thoughtfully appointed hotel rooms and suites. Stonebridge Inn (managed by CoralTree Hospitality) A beautifully restored 97-room historic boutique hotel located in Downtown Cleveland featuring picturesque rooms & suites, a full- service restaurant & bar, and event space. Fidelity Hotel The Stephanie Inn is the premier Cannon Beach oceanfront hotel offering luxurious and thoughtful accommodations on Oregon's beautiful north coast. Stephanie Inn (managed by Columbia Hospitality) A family of four luxurious, historic inns and an award-winning restaurant in downtown Charleston, South Carolina. Charming Inns
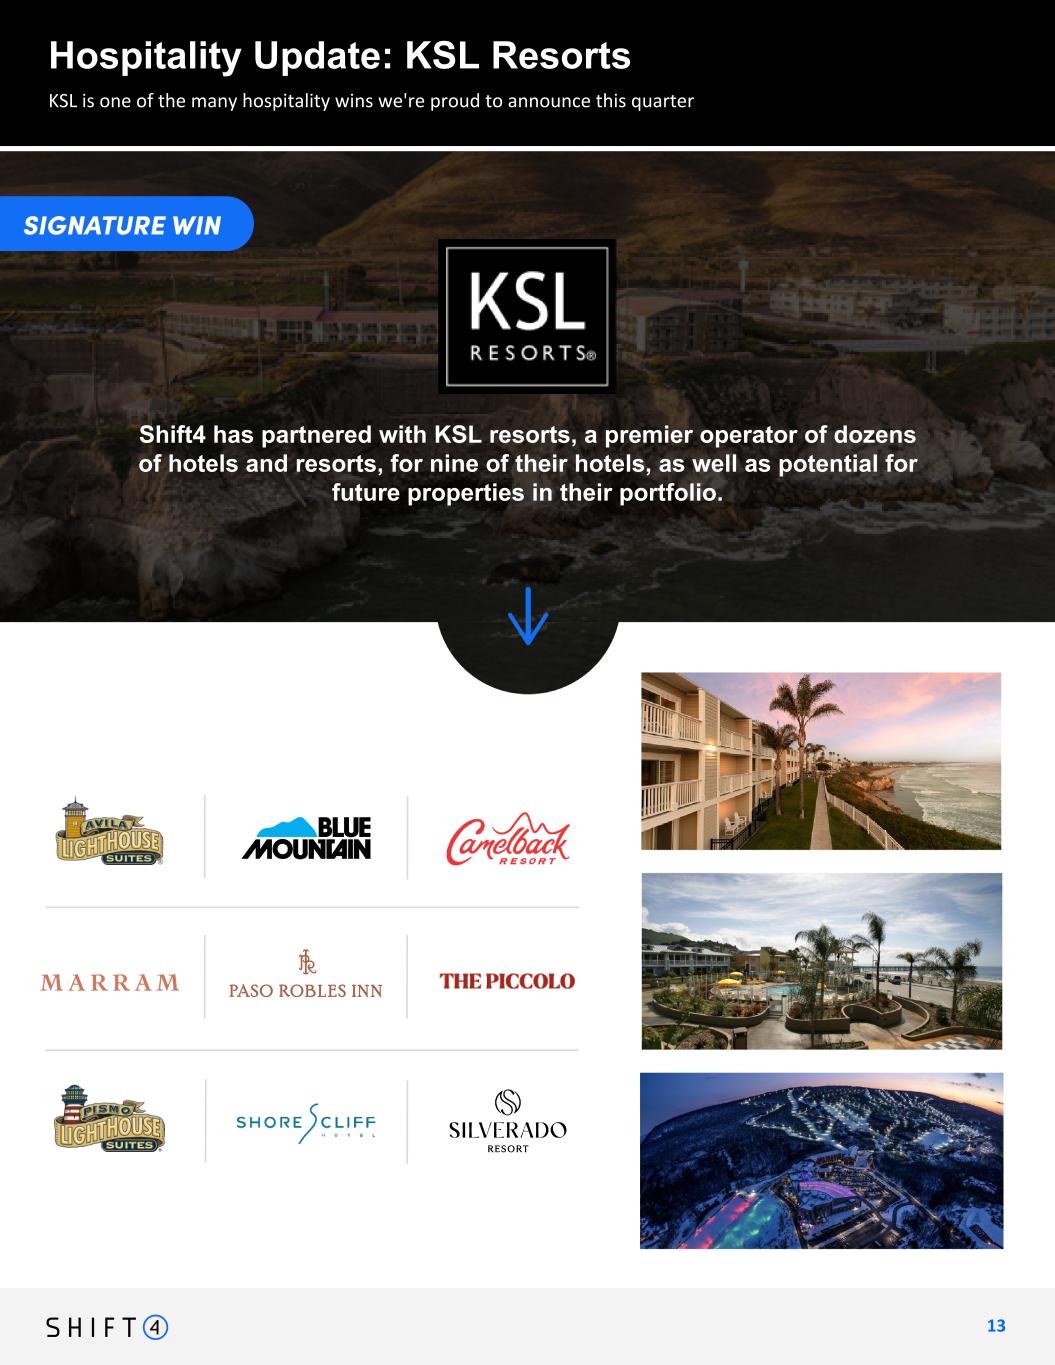
Continuing to expand market share in hospitality vertical Hospitality Update: KSL Resorts 1 3 13 KSL is one of the many hospitality wins we're proud to announce this quarter Shift4 has partnered with KSL resorts, a premier operator of dozens of hotels and resorts, for nine of their hotels, as well as potential for future properties in their portfolio.
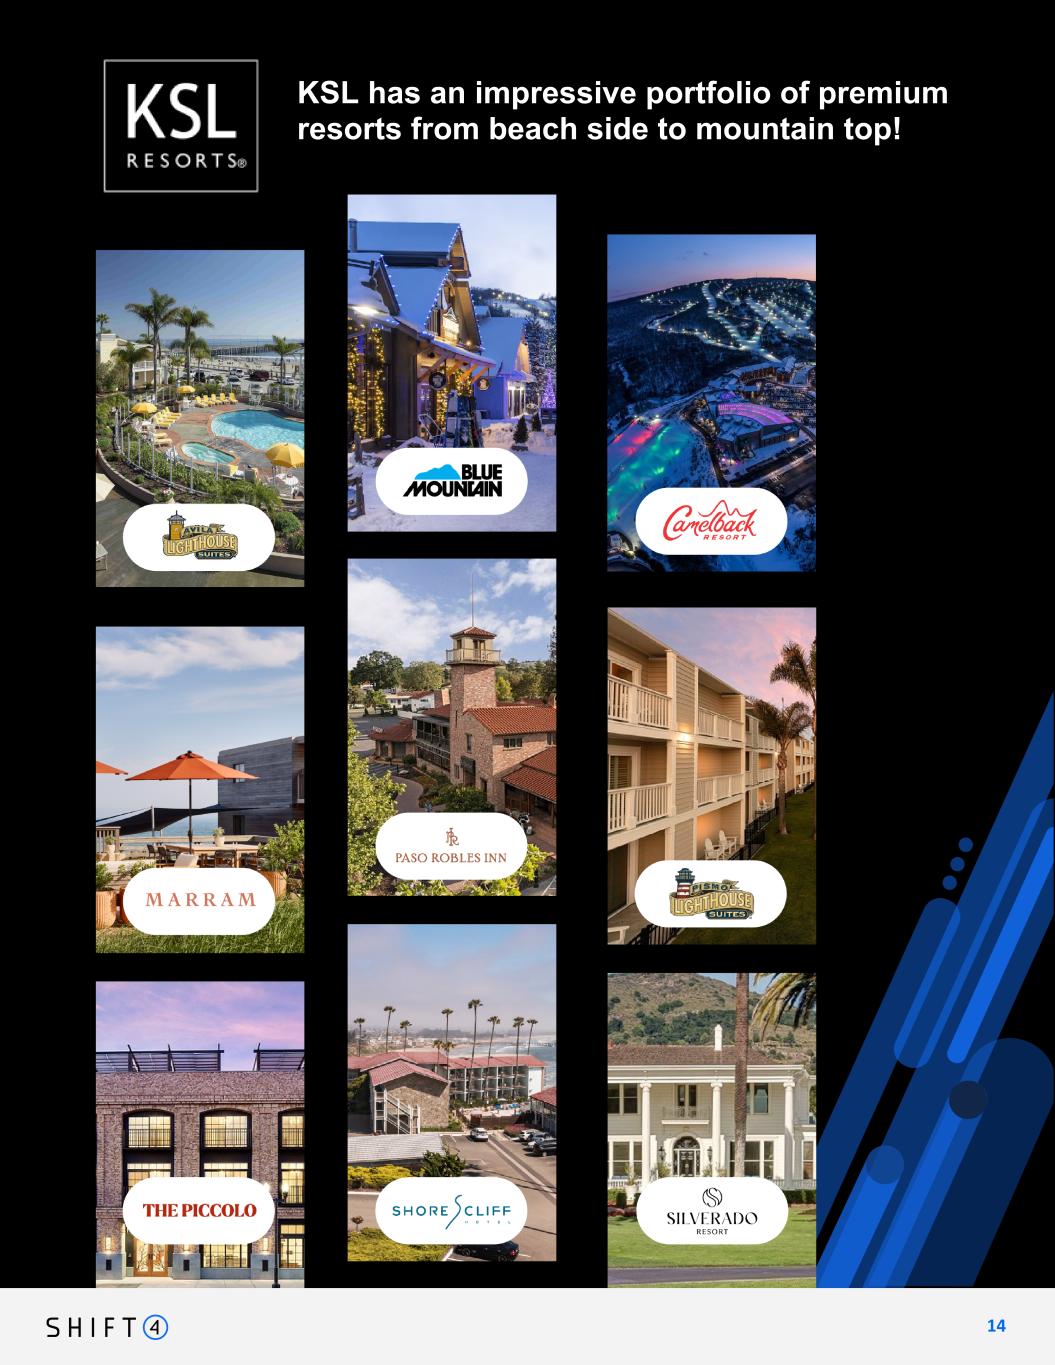
KSL has an impressive portfolio of premium resorts from beach side to mountain top! 1 4 14

1 5 15 undisclosed one more We are thrilled to announce that we have officially signed a premier operator of luxury hotel and casino properties around the world. And thing
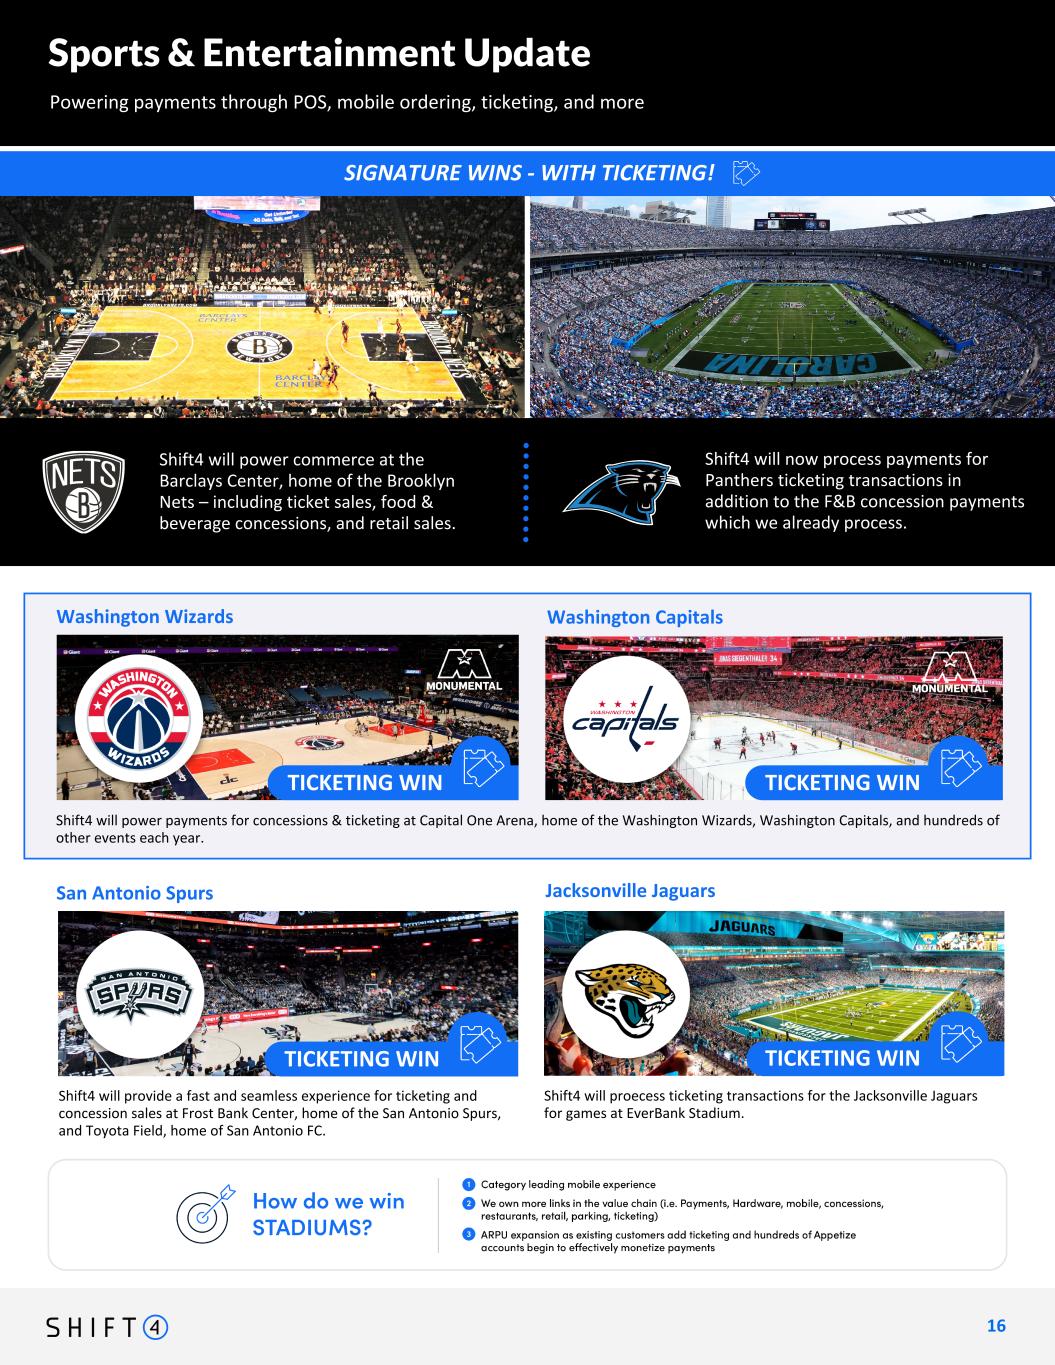
American Airlines Center Sports & Entertainment Update Powering payments through POS, mobile ordering, ticketing, and more 1 6 16 Jacksonville Jaguars Washington Capitals Shift4 will provide a fast and seamless experience for ticketing and concession sales at Frost Bank Center, home of the San Antonio Spurs, and Toyota Field, home of San Antonio FC. Chicago White Sox Shift4 will now process payments for Panthers ticketing transactions in addition to the F&B concession payments which we already process. Shift4 will power commerce at the Barclays Center, home of the Brooklyn Nets – including ticket sales, food & beverage concessions, and retail sales. Washington Wizards San Antonio Spurs SIGNATURE WINS - WITH TICKETING! Shift4 will proecess ticketing transactions for the Jacksonville Jaguars for games at EverBank Stadium. TICKETING WIN TICKETING WIN TICKETING WIN TICKETING WIN Shift4 will power payments for concessions & ticketing at Capital One Arena, home of the Washington Wizards, Washington Capitals, and hundreds of other events each year.
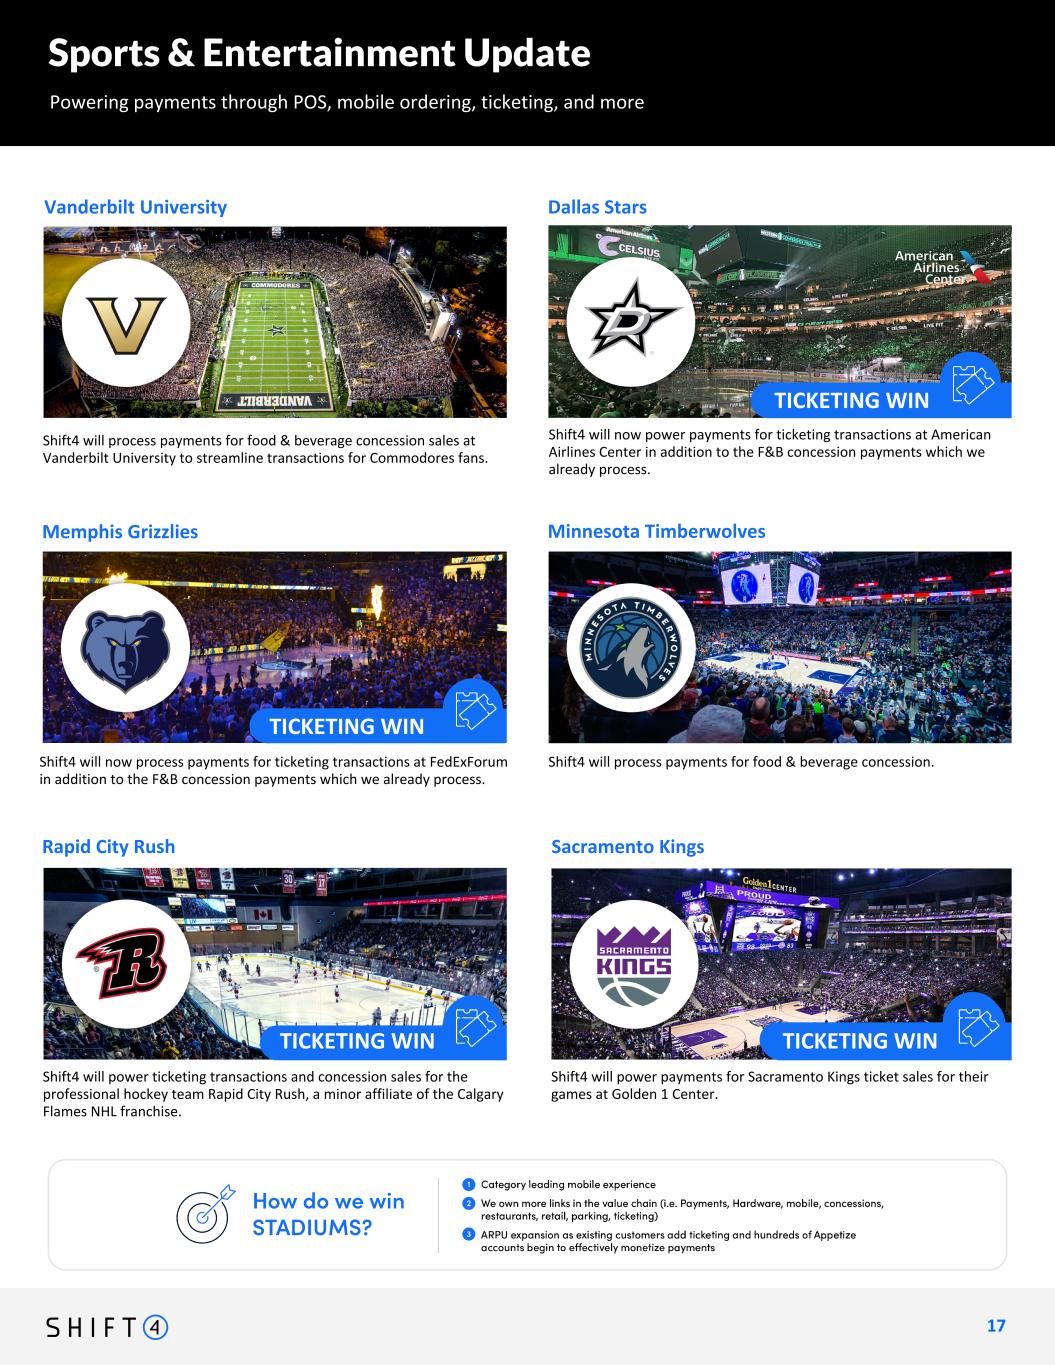
Memphis Grizzlies 1 7 17 Minnesota Timberwolves Sacramento Kings Shift4 will power ticketing transactions and concession sales for the professional hockey team Rapid City Rush, a minor affiliate of the Calgary Flames NHL franchise. Rapid City Rush Vanderbilt University Dallas Stars Shift4 will power payments for Sacramento Kings ticket sales for their games at Golden 1 Center. Shift4 will process payments for food & beverage concession. TICKETING WIN TICKETING WIN Sports & Entertainment Update Powering payments through POS, mobile ordering, ticketing, and more TICKETING WIN TICKETING WIN I I I Shift4 will now process payments for ticketing transactions at FedExForum in addition to the F&B concession payments which we already process. Shift4 will now power payments for ticketing transactions at American Airlines Center in addition to the F&B concession payments which we already process. Shift4 will process payments for food & beverage concession sales at Vanderbilt University to streamline transactions for Commodores fans.
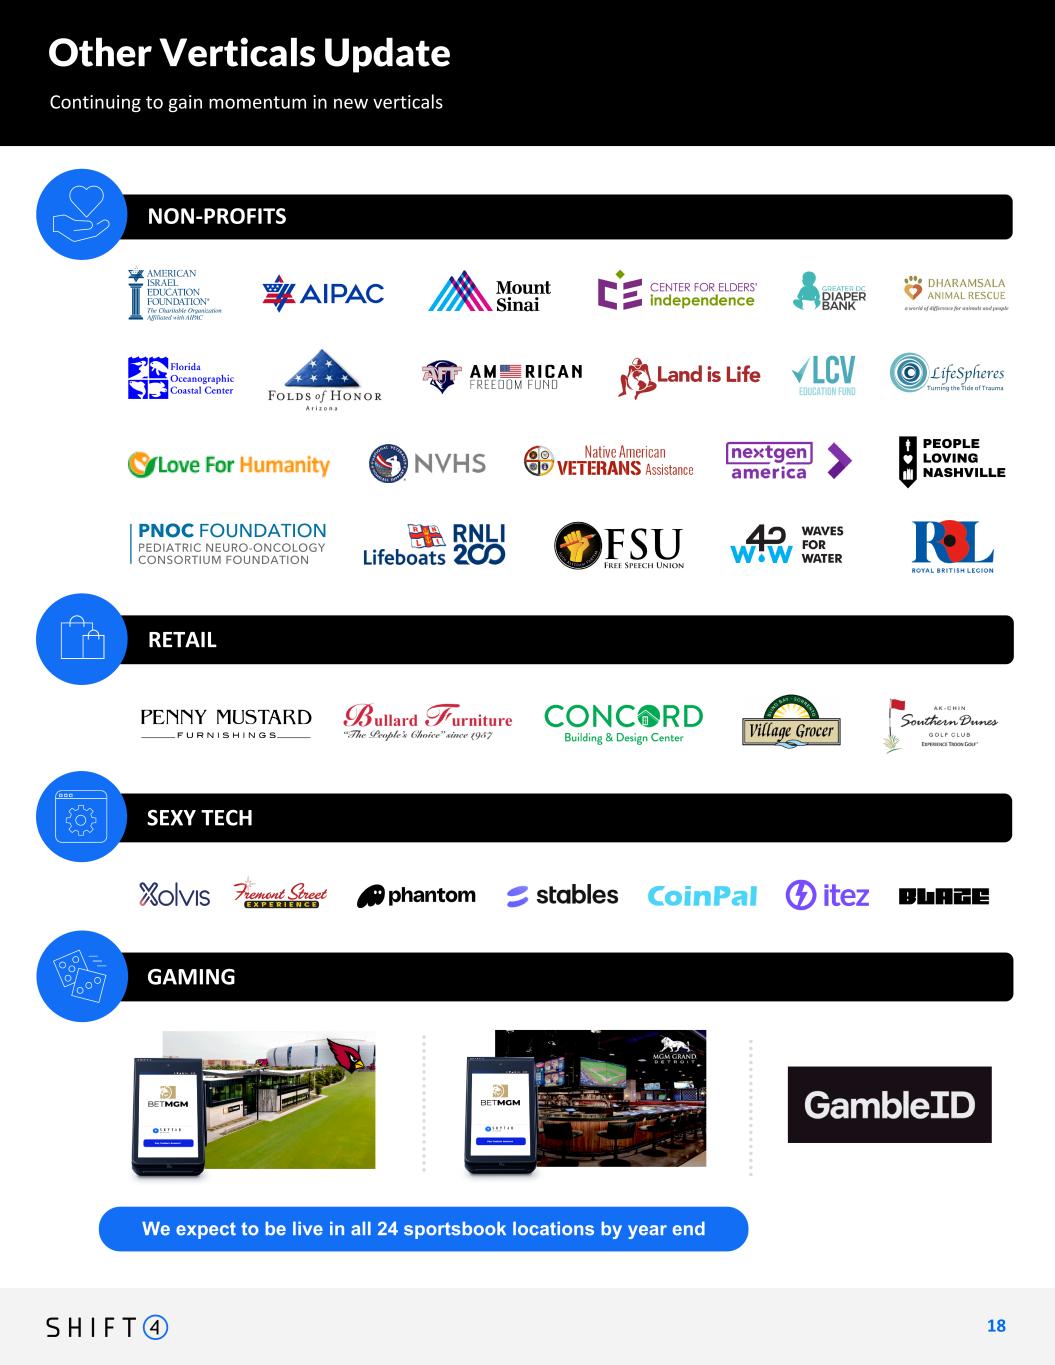
Other Verticals Update Continuing to gain momentum in new verticals 1 8 18 NON-PROFITS SEXY TECH GAMING In Europe, our relationship with online delivery platform Wolt is ramping extremely quickly. Wolt is a global leader in home delivery of essential items (food, convenience, etc.) Processing payments for Nayax, a European PSP focused on unattended retail-use-cases, including EV charging stations We entered into an agreement to process payments for Fortech, a PSP in Italy focused on fuel stations and EV charging stations throughout the country.we entered into an agreement to process payments for Fortech, a PSP in Italy focused on fuel stations and EV charging stations throughout the country. • in the process of rolling out SkyTab mobile devices through all of BetMGM's 24 sportsbooklocations across 9 states • SkyTab also being integrated with Passport Technology, a tech partner that enables cashless gaming experiences on the casino floor //// • Online gaming: ryvals.com (online gaming site targeting the interactive "competitive gamer" community); Prime Sports Betting (an online platform currently operating in Ohio & expanding); Jefebet (online betting platform customized exclusively for the underserved latino community); Rolling Riches (online gaming site blending social media with slot and casino-type games) RETAIL Shift4 is live with SkyTab mobile devices at the Great American Ballpark, home of the Cincinnati Reds. We are now live with SkyTab mobile at our first BetMGM Sportsbook location, Nationals Stadium in Washington D.C. SkyTab devices integrated with Passport Technologies for cashless gaming experiences at the Morongo Casino outside of Palm Springs Shift4 is thrilled to be powering the payments for the Boston Marathon, the world's oldest annual marathon, via GivenGain, to which we have fully moved all U.S. card volume. Nonprofits: Poppy Appeal, Royal National Lifeboat Institution, Firearms Policy Coalition,Charlotte Preparatory School, The Free Speech Union, GRACE Christian School, LifeSpheres, Folds of Honor Arizona Chapter, Center for Elders' Independence, Carmel Catholic High School, First Love Revolution Church, NextGen Climate Action, Jewish Vocational and Career Counseling Service, Alt News Foundation, UboraTZ, League of Conservation Voters Education Fund, People Loving Nashville, Florida Oceanographic Society, PNOC Foundation, American Israel Education Foundation, Land Is Life, Freedom for America Fund, Litecoin Foundation Inc., Greater DC Diaper Bank, Native American Veterans Assistance, Waves For Water, Love of Humanity, Inc, Ascent Church, National Veterans Homeless Support, Amnesty International, American Israel Public Affairs Committee, Huntington County Community Foundation, Dharamsala Animal Rescue, NexGen Climate Action >>>probably need to select the top ones from here Retail: Penny Mustard Furnishings, Bullard Furniture, Concord Lumber & Building Center Littleton, Blind Bay Village Grocer, Ak-Chin Southern Dunes Golf Club Gaming: BetMGM Arizona (live),BetMGM Michigan, GambleID, PlayLive Philadelphia Sexy Tech Xolvis, Fremont Street Experience, Switchere, Chain Valley, Coinflow, Phantom Wallet, Stables, CoinPal, Coin Sonic, Swapin, Excur, Itez, Blaze Payments Nonprofits: Poppy Appeal, Royal National Lifeboat Institution, , The Free Speech Union, LifeSpheres, Folds of Honor Arizona Chapter, Center for Elders' Independence, NextGen Climate Action, League of Conservation Voters Education Fund, People Loving Nashville, Florida Oceanographic Society, PNOC Foundation, American Israel Education Foundation, Land Is Life, Freedom for America Fund, DC Diaper Bank, Native American Veterans Assistance, Waves For Water, Love of Humanity, Inc, National Veterans Homeless Support, Amnesty International, American Israel Public Affairs Committee, Dharamsala Animal Rescue >>>probably need to select the top ones from here call out amnesty intl. We expect to be live in all 24 sportsbook locations by year end
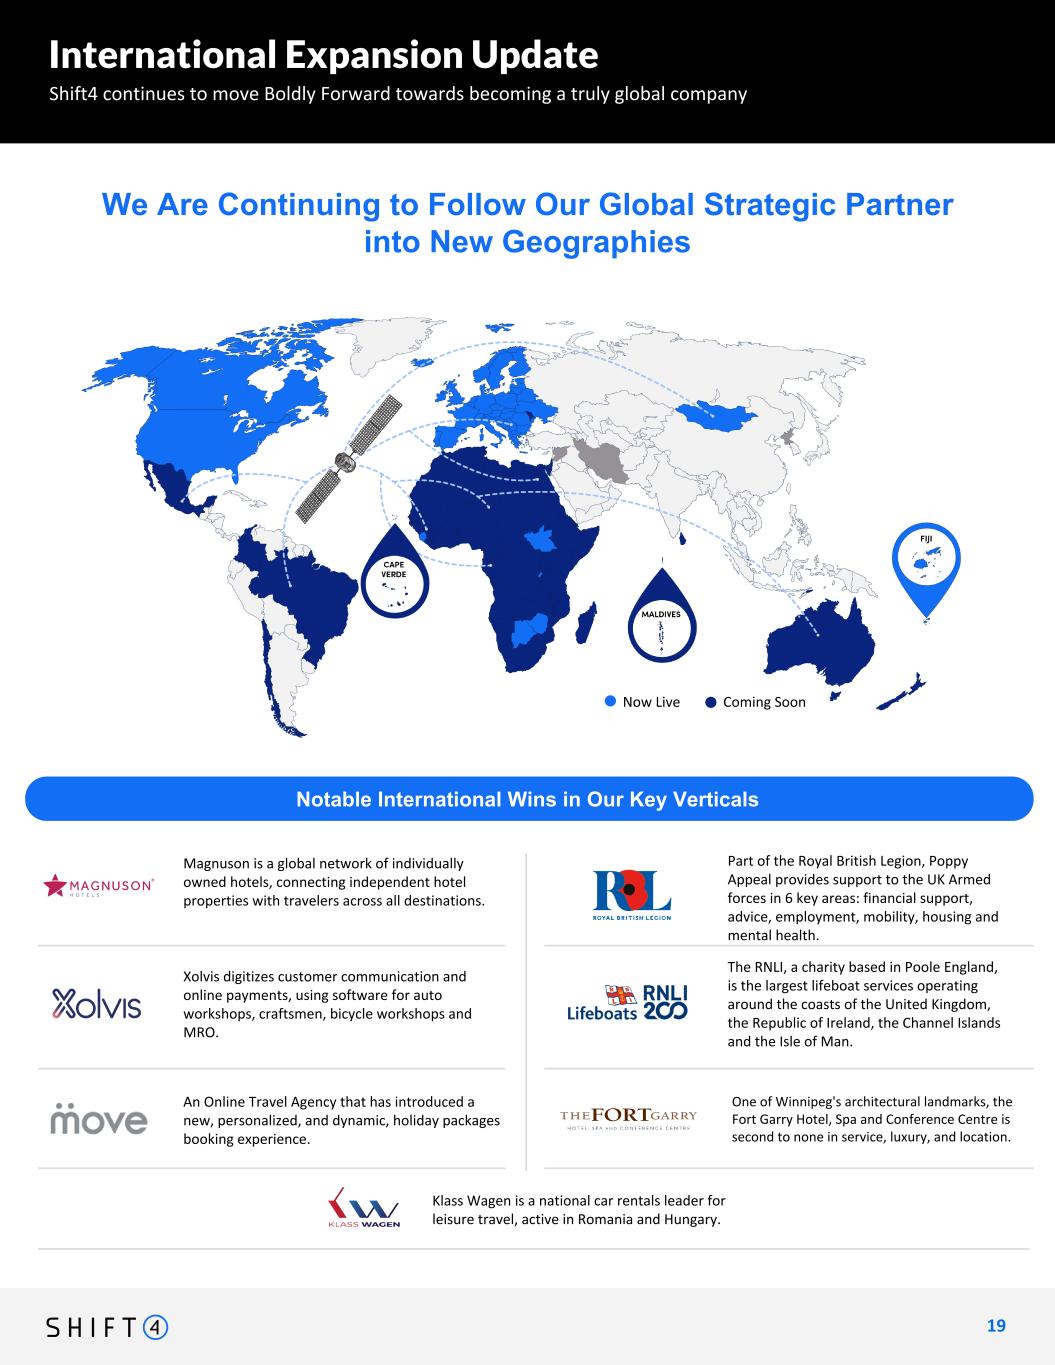
International Expansion Update Shift4 continues to move Boldly Forward towards becoming a truly global company 1 9 19 Magnuson is a global network of individually owned hotels, connecting independent hotel properties with travelers across all destinations. We Are Continuing to Follow Our Global Strategic Partner into New Geographies Now Live Now Processing in 2024 Notable International Wins in Our Key Verticals Xolvis digitizes customer communication and online payments, using software for auto workshops, craftsmen, bicycle workshops and MRO. Klass Wagen is a national car rentals leader for leisure travel, active in Romania and Hungary. Part of the Royal British Legion, Poppy Appeal provides support to the UK Armed forces in 6 key areas: financial support, advice, employment, mobility, housing and mental health. An Online Travel Agency that has introduced a new, personalized, and dynamic, holiday packages booking experience. The RNLI, a charity based in Poole England, is the largest lifeboat services operating around the coasts of the United Kingdom, the Republic of Ireland, the Channel Islands and the Isle of Man. Coming Soon One of Winnipeg's architectural landmarks, the Fort Garry Hotel, Spa and Conference Centre is second to none in service, luxury, and location.
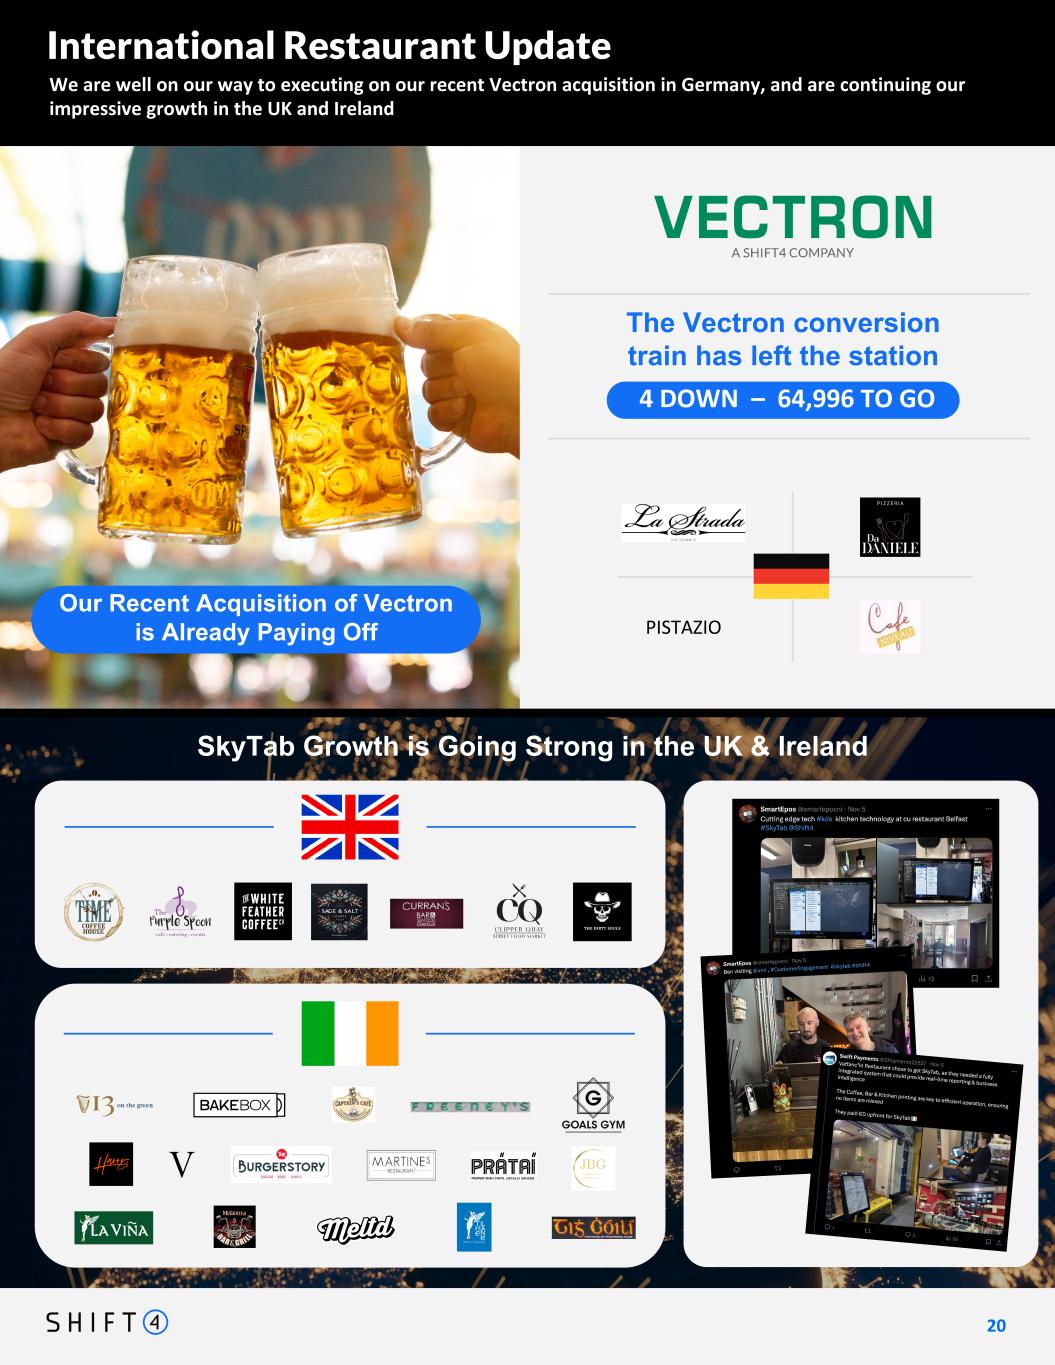
We are well on our way to executing on our recent Vectron acquisition in Germany, and are continuing our impressive growth in the UK and Ireland 2 0 20 International Restaurant Update The Vectron conversion train has left the station DRAFT IN PROGRESS - getting UK logos by Thursday (11/7) EODPISTAZIO Our Recent Acquisition of Vectron is Already Paying Off 4 DOWN – 64,996 TO GO SkyTab Growth is Going Strong in the UK & Ireland
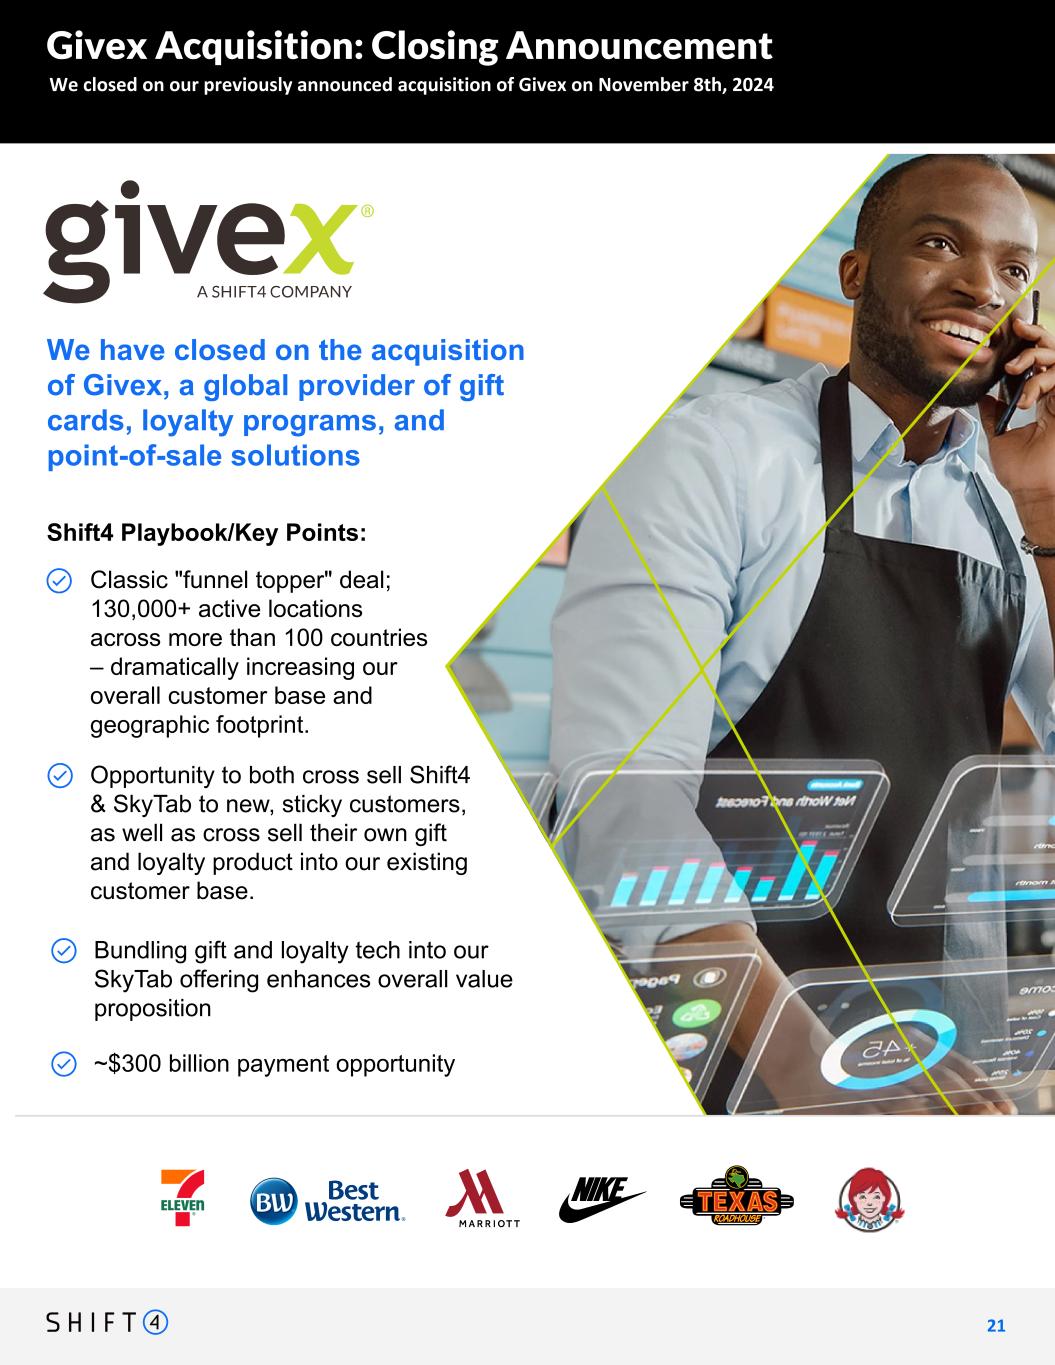
We closed on our previously announced acquisition of Givex on November 8th, 2024 2 1 21 Givex Acquisition: Closing Announcement We have closed on the acquisition of Givex, a global provider of gift cards, loyalty programs, and point-of-sale solutions Shift4 Playbook/Key Points: Classic "funnel topper" deal; 130,000+ active locations across more than 100 countries – dramatically increasing our overall customer base and geographic footprint. Opportunity to both cross sell Shift4 & SkyTab to new, sticky customers, as well as cross sell their own gift and loyalty product into our existing customer base. ~$300 billion payment opportunity Bundling gift and loyalty tech into our SkyTab offering enhances overall value proposition
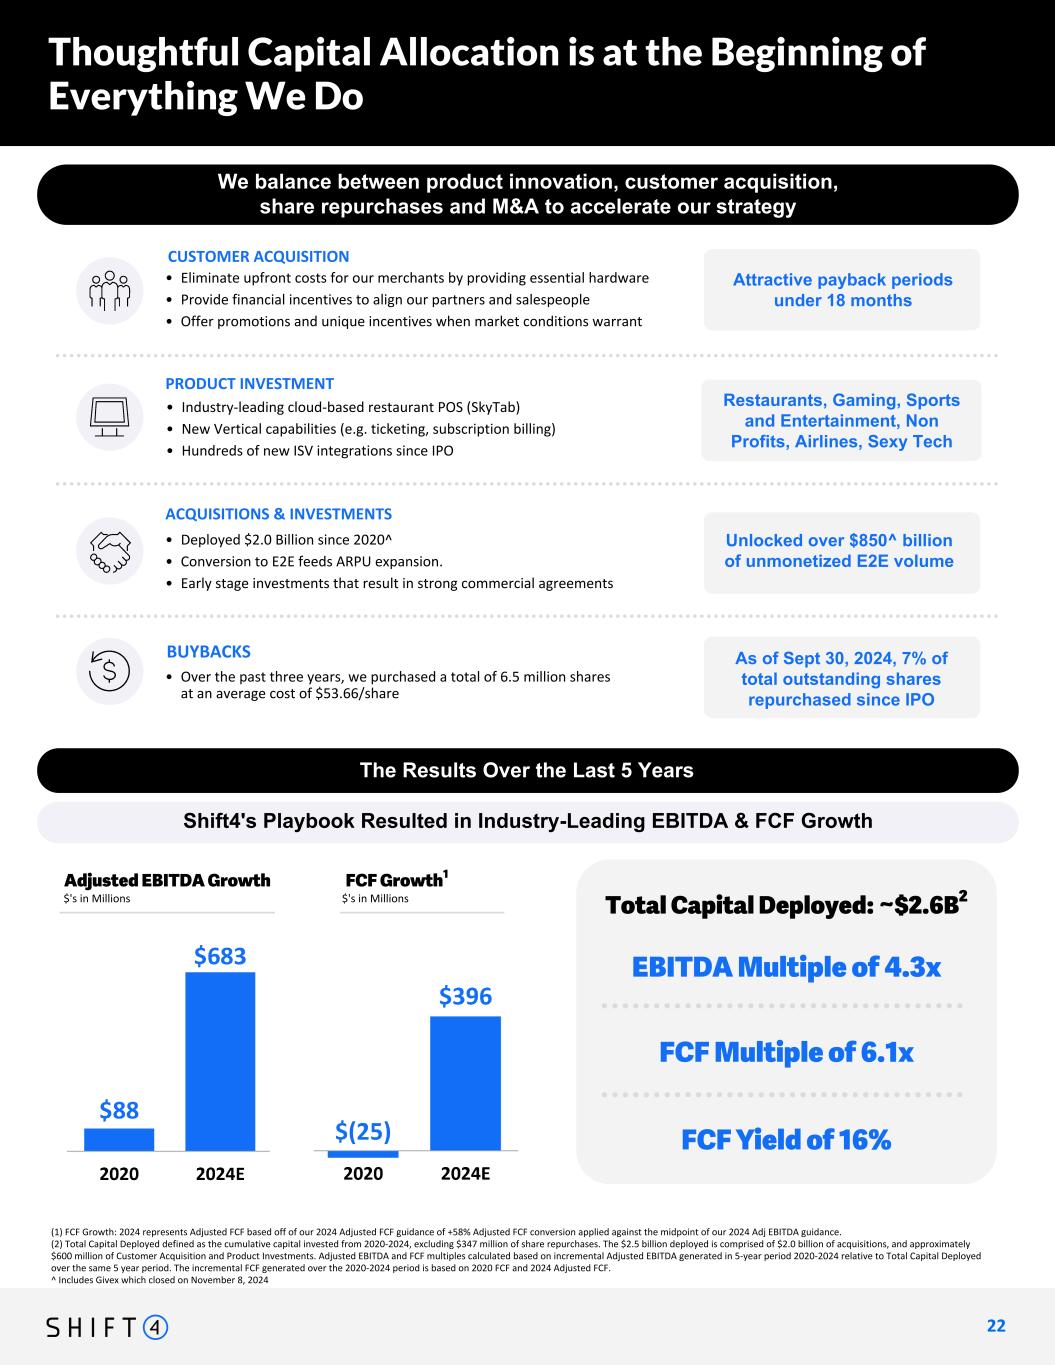
Restaurants, Gaming, Sports and Entertainment, Non Profits, Airlines, Sexy Tech Shift4's Playbook Resulted in Industry-Leading EBITDA & FCF Growth (1) FCF Growth: 2024 represents Adjusted FCF based off of our 2024 Adjusted FCF guidance of +58% Adjusted FCF conversion applied against the midpoint of our 2024 Adj EBITDA guidance. (2) Total Capital Deployed defined as the cumulative capital invested from 2020-2024, excluding $347 million of share repurchases. The $2.5 billion deployed is comprised of $2.0 billion of acquisitions, and approximately $600 million of Customer Acquisition and Product Investments. Adjusted EBITDA and FCF multiples calculated based on incremental Adjusted EBITDA generated in 5-year period 2020-2024 relative to Total Capital Deployed over the same 5 year period. The incremental FCF generated over the 2020-2024 period is based on 2020 FCF and 2024 Adjusted FCF. ^ Includes Givex which closed on November 8, 2024 2 2 22 2024 GOAL & BEYOND We balance between product innovation, customer acquisition, share repurchases and M&A to accelerate our strategy Thoughtful Capital Allocation is at the Beginning of Everything We Do CUSTOMER ACQUISITION • Industry-leading cloud-based restaurant POS (SkyTab) • New Vertical capabilities (e.g. ticketing, subscription billing) • Hundreds of new ISV integrations since IPO Buybacks Acquisitions and Investments PRODUCT INVESTMENT • Eliminate upfront costs for our merchants by providing essential hardware • Provide financial incentives to align our partners and salespeople • Offer promotions and unique incentives when market conditions warrant • Deployed $1.5 Billion since 2020 • Conversion to E2E feeds ARPU expansion. • Early stage investments that result in strong commercial agreements • Over the past three years, we purchased a total of 5.9 million shares at an average cost of $52.41/share The Results Over the Last 5 Years Adjusted EBITDA Growth THE RESULTS Cumulative Incremental FCF Generated $278 Million FCF of 14% Cumulative Capital Invested ($'s in Millions) FCF Growth1 EBITDA Multiple of 4.3x THE RESULTS Cumulative Incremental FCF Generated FCF Multiple of 6.1x FCF Yield of 16% Total Capital Deployed: ~$2.6B2$'s in Millions $'s in Millions Attractive payback periods under 18 months Unlocked over $500 billion of unmonetized E2E volume 6% of total outstanding shares repurchased since IPO ACQUISITIONS & INVESTMENTS • Deployed $2.0 Billion since 2020^ • Conversion to E2E feeds ARPU expansion. • Early stage investments that result in strong commercial agreements Unlocked over $850^ billion of unmonetized E2E volume BUYBACKS • Over the past three years, we purchased a total of 6.5 million shares at an average cost of $53.66/share As of Sept 30, 2024, 7% of total outstanding shares repurchased since IPO $683 $396
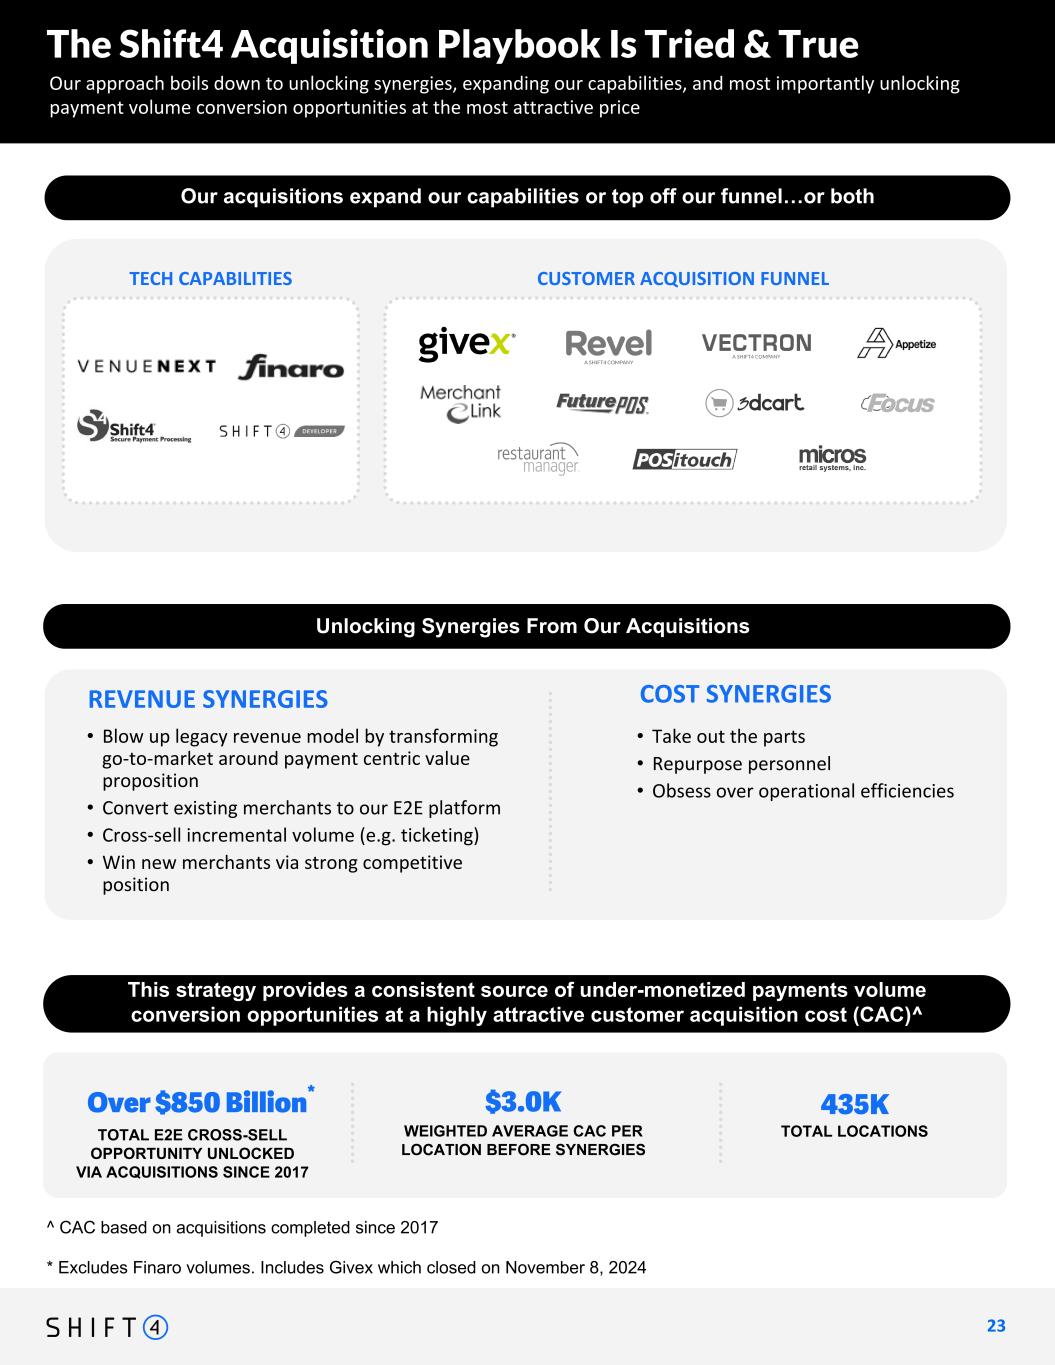
Over $850 Billion* 435K TOTAL E2E CROSS-SELL OPPORTUNITY UNLOCKED VIA ACQUISITIONS SINCE 2017 TOTAL LOCATIONS $3.0K WEIGHTED AVERAGE CAC PER LOCATION BEFORE SYNERGIES * Excludes Finaro volumes. Includes Givex which closed on November 8, 2024 The Shift4 Acquisition Playbook Is Tried & True Our approach boils down to unlocking synergies, expanding our capabilities, and most importantly unlocking payment volume conversion opportunities at the most attractive price 2 3 23 highlight contrast vs. worldline add comment on M&A for distribution? (+ finaro charts from Luke?) 2024 GOAL & BEYOND EBITDA Multiple: 5.3x FCF Yield: 14% • Take out the parts • Repurpose personnel • Obsess over operational efficiencies COST SYNERGIESREVENUE SYNERGIES Unlocking Synergies From Our Acquisitions • Blow up legacy revenue model by transforming go-to-market around payment centric value proposition • Convert existing merchants to our E2E platform • Cross-sell incremental volume (e.g. ticketing) • Win new merchants via strong competitive position Our acquisitions either expand our capabilities or top off our funnel... This strategy provides a consistent source of under-monetized payments volume conversion opportunities at a highly attractive customer acquisition cost (CAC)^ arrow here leading to punchline Our acquisitions provide a consistent source of under monetized payment opportunities to convert merchants onto our end-to-end platform at highly attractive customer acquisition cost (CAC) TECH CAPABILITIES CUSTOMER ACQUISITION FUNNEL Our acquisitions expand our capabilities or top off our funnel…or both ^ CAC based on acquisitions completed since 2017
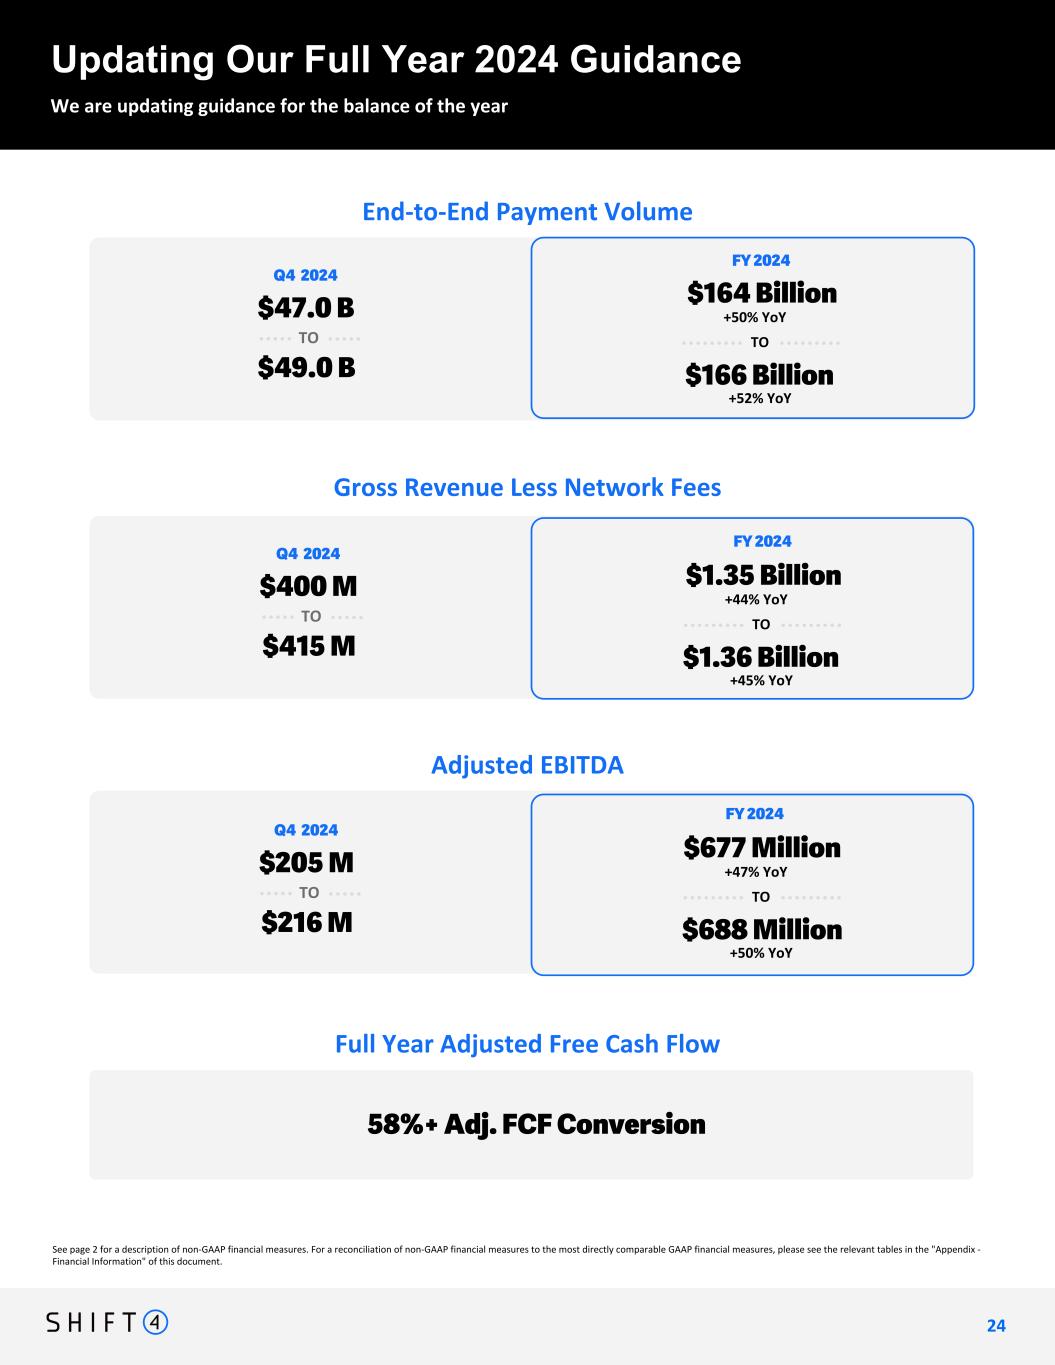
See page 2 for a description of non-GAAP financial measures. For a reconciliation of non-GAAP financial measures to the most directly comparable GAAP financial measures, please see the relevant tables in the "Appendix - Financial Information" of this document. Updating Our Full Year 2024 Guidance We are updating guidance for the balance of the year 2 4 24 Intended Message: Adjusted for contribution from Finaro/Appetize, we're looking at 31% YoY GRLNF growth in Q4 Full Year Adjusted Free Cash Flow 58%+ Adj. FCF Conversion End-to-End Payment Volume $47.0 B $49.0 B TO Q4 2024 $164 Billion $166 Billion TO FY 2024 +50% YoY +52% YoY Gross Revenue Less Network Fees $1.35 Billion $1.36 Billion TO FY 2024 +44% YoY +45% YoY Adjusted EBITDA $677 Million $688 Million TO FY 2024 +47% YoY +50% YoY $400 M $415 M TO Q4 2024 $205 M $216 M TO Q4 2024 format fix + change to #s from Nancy continuing with quarterly guidance is smart. I know it was a judgement call last quarter, and just because something may have worked then doesn’t mean it will now. What it does do is ensure the analyst estimates are closer to ours, and improves our chance for a beat. I wouldn’t want to take a chance that analysts partition the second half estimates the same way we would
Appendix - Financial Information 25
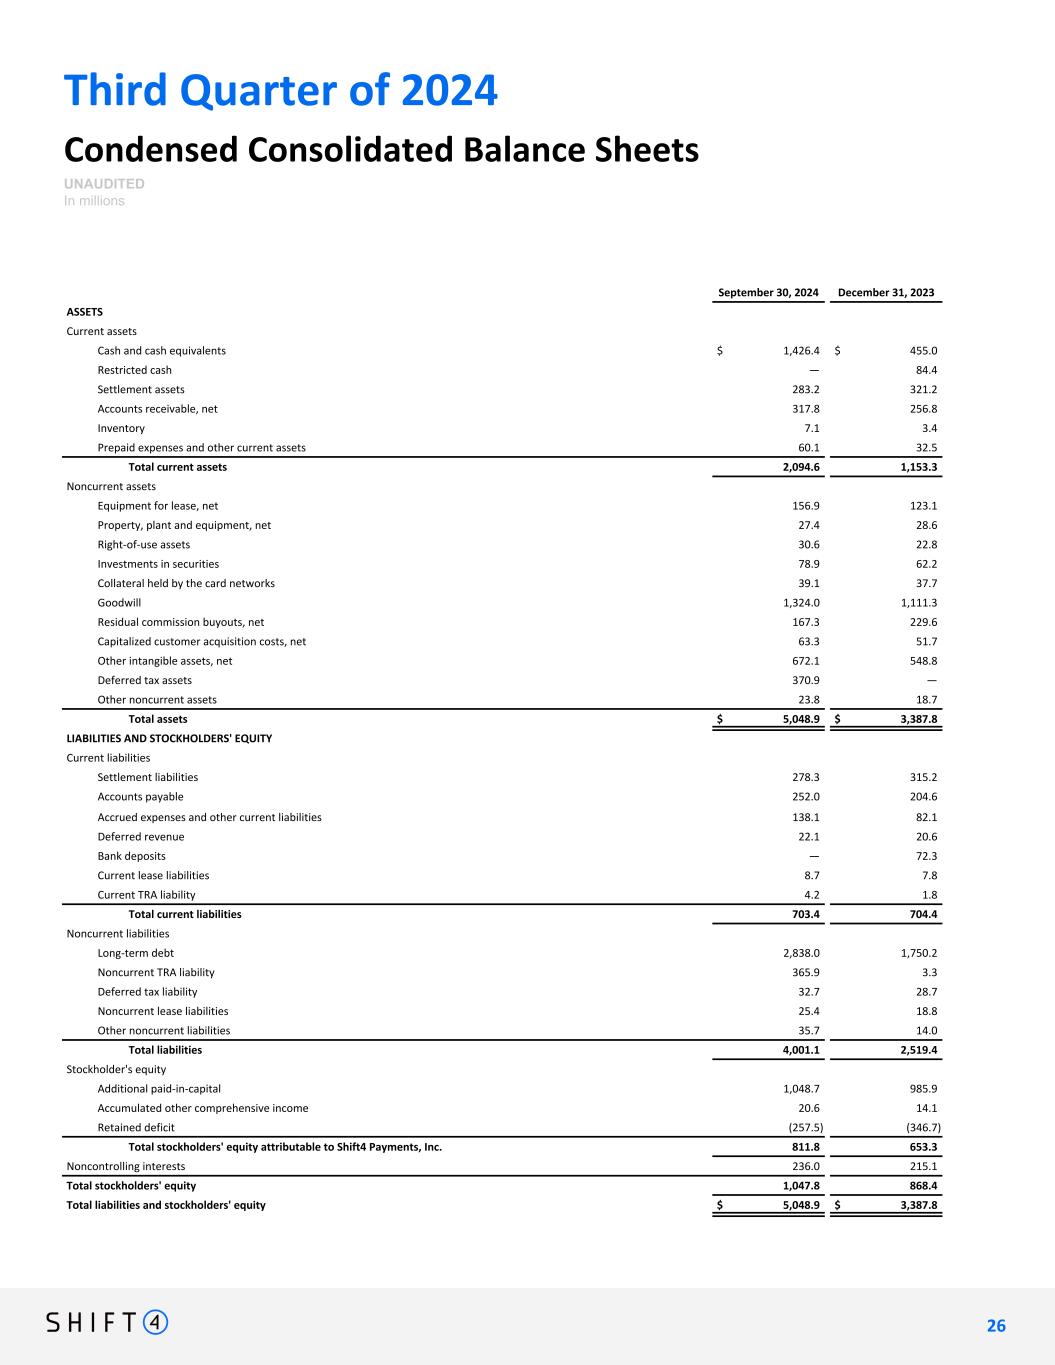
Third Quarter of 2024 Condensed Consolidated Balance Sheets UNAUDITED In millions September 30, 2024 December 31, 2023 ASSETS Current assets Cash and cash equivalents $ 1,426.4 $ 455.0 Restricted cash — 84.4 Settlement assets 283.2 321.2 Accounts receivable, net 317.8 256.8 Inventory 7.1 3.4 Prepaid expenses and other current assets 60.1 32.5 Total current assets 2,094.6 1,153.3 Noncurrent assets Equipment for lease, net 156.9 123.1 Property, plant and equipment, net 27.4 28.6 Right-of-use assets 30.6 22.8 Investments in securities 78.9 62.2 Collateral held by the card networks 39.1 37.7 Goodwill 1,324.0 1,111.3 Residual commission buyouts, net 167.3 229.6 Capitalized customer acquisition costs, net 63.3 51.7 Other intangible assets, net 672.1 548.8 Deferred tax assets 370.9 — Other noncurrent assets 23.8 18.7 Total assets $ 5,048.9 $ 3,387.8 LIABILITIES AND STOCKHOLDERS' EQUITY Current liabilities Settlement liabilities 278.3 315.2 Accounts payable 252.0 204.6 Accrued expenses and other current liabilities 138.1 82.1 Deferred revenue 22.1 20.6 Bank deposits — 72.3 Current lease liabilities 8.7 7.8 Current TRA liability 4.2 1.8 Total current liabilities 703.4 704.4 Noncurrent liabilities Long-term debt 2,838.0 1,750.2 Noncurrent TRA liability 365.9 3.3 Deferred tax liability 32.7 28.7 Noncurrent lease liabilities 25.4 18.8 Other noncurrent liabilities 35.7 14.0 Total liabilities 4,001.1 2,519.4 Stockholder's equity Additional paid-in-capital 1,048.7 985.9 Accumulated other comprehensive income 20.6 14.1 Retained deficit (257.5) (346.7) Total stockholders' equity attributable to Shift4 Payments, Inc. 811.8 653.3 Noncontrolling interests 236.0 215.1 Total stockholders' equity 1,047.8 868.4 Total liabilities and stockholders' equity $ 5,048.9 $ 3,387.8 2 6 26
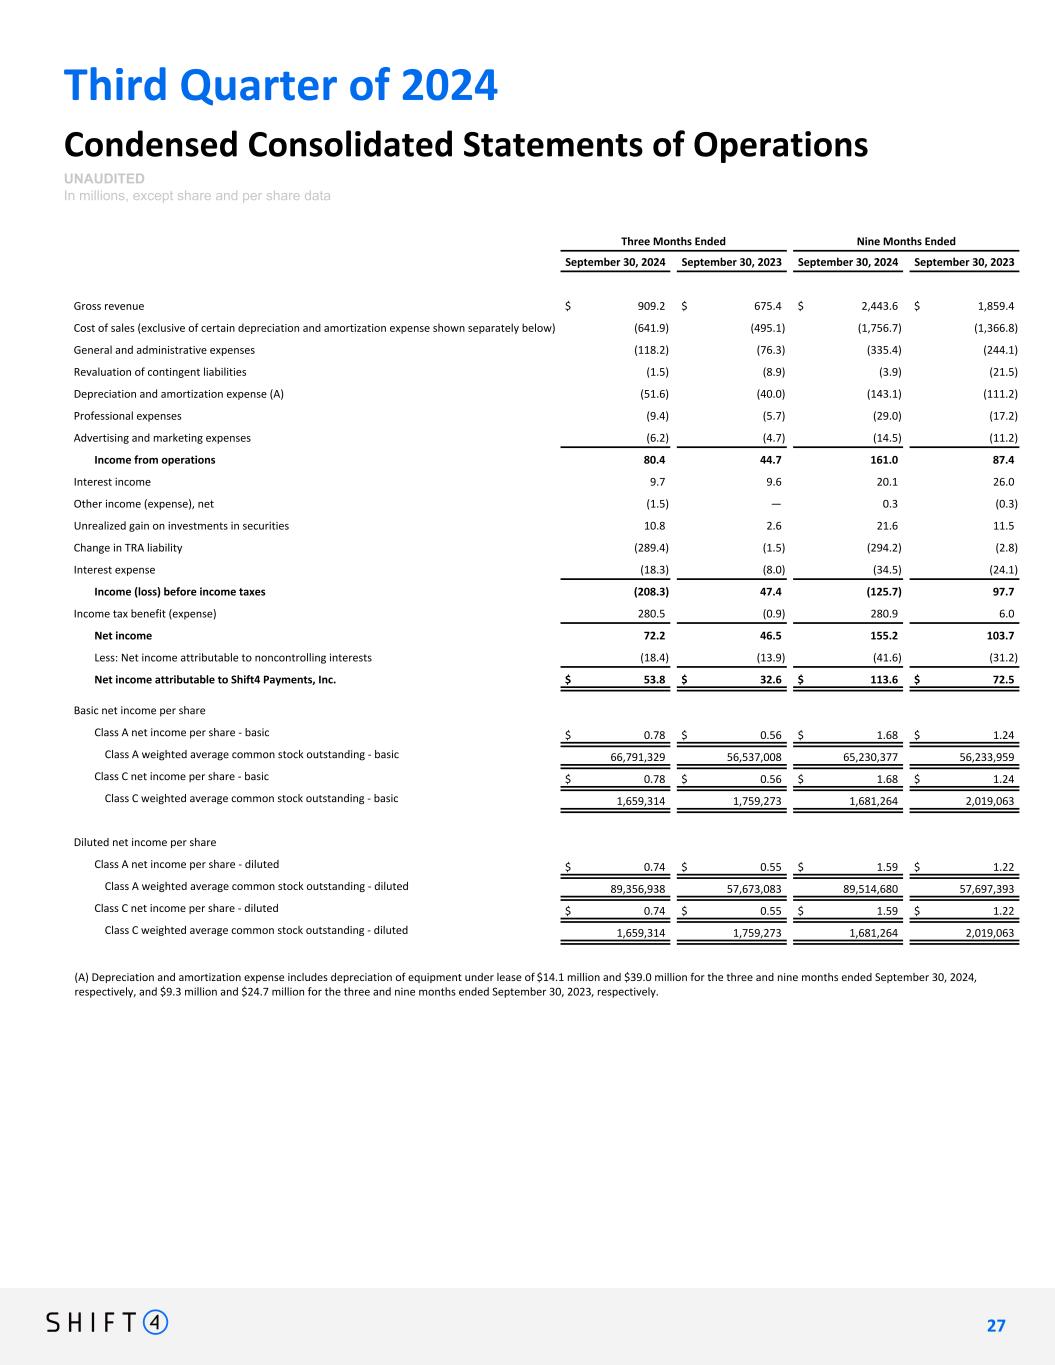
Third Quarter of 2024 Condensed Consolidated Statements of Operations UNAUDITED In millions, except share and per share data Three Months Ended Nine Months Ended September 30, 2024 September 30, 2023 September 30, 2024 September 30, 2023 Gross revenue $ 909.2 $ 675.4 $ 2,443.6 $ 1,859.4 Cost of sales (exclusive of certain depreciation and amortization expense shown separately below) (641.9) (495.1) (1,756.7) (1,366.8) General and administrative expenses (118.2) (76.3) (335.4) (244.1) Revaluation of contingent liabilities (1.5) (8.9) (3.9) (21.5) Depreciation and amortization expense (A) (51.6) (40.0) (143.1) (111.2) Professional expenses (9.4) (5.7) (29.0) (17.2) Advertising and marketing expenses (6.2) (4.7) (14.5) (11.2) Income from operations 80.4 44.7 161.0 87.4 Interest income 9.7 9.6 20.1 26.0 Other income (expense), net (1.5) — 0.3 (0.3) Unrealized gain on investments in securities 10.8 2.6 21.6 11.5 Change in TRA liability (289.4) (1.5) (294.2) (2.8) Interest expense (18.3) (8.0) (34.5) (24.1) Income (loss) before income taxes (208.3) 47.4 (125.7) 97.7 Income tax benefit (expense) 280.5 (0.9) 280.9 6.0 Net income 72.2 46.5 155.2 103.7 Less: Net income attributable to noncontrolling interests (18.4) (13.9) (41.6) (31.2) Net income attributable to Shift4 Payments, Inc. $ 53.8 $ 32.6 $ 113.6 $ 72.5 Basic net income per share Class A net income per share - basic $ 0.78 $ 0.56 $ 1.68 $ 1.24 Class A weighted average common stock outstanding - basic 66,791,329 56,537,008 65,230,377 56,233,959 Class C net income per share - basic $ 0.78 $ 0.56 $ 1.68 $ 1.24 Class C weighted average common stock outstanding - basic 1,659,314 1,759,273 1,681,264 2,019,063 Diluted net income per share Class A net income per share - diluted $ 0.74 $ 0.55 $ 1.59 $ 1.22 Class A weighted average common stock outstanding - diluted 89,356,938 57,673,083 89,514,680 57,697,393 Class C net income per share - diluted $ 0.74 $ 0.55 $ 1.59 $ 1.22 Class C weighted average common stock outstanding - diluted 1,659,314 1,759,273 1,681,264 2,019,063 (A) Depreciation and amortization expense includes depreciation of equipment under lease of $14.1 million and $39.0 million for the three and nine months ended September 30, 2024, respectively, and $9.3 million and $24.7 million for the three and nine months ended September 30, 2023, respectively. 2 7 27
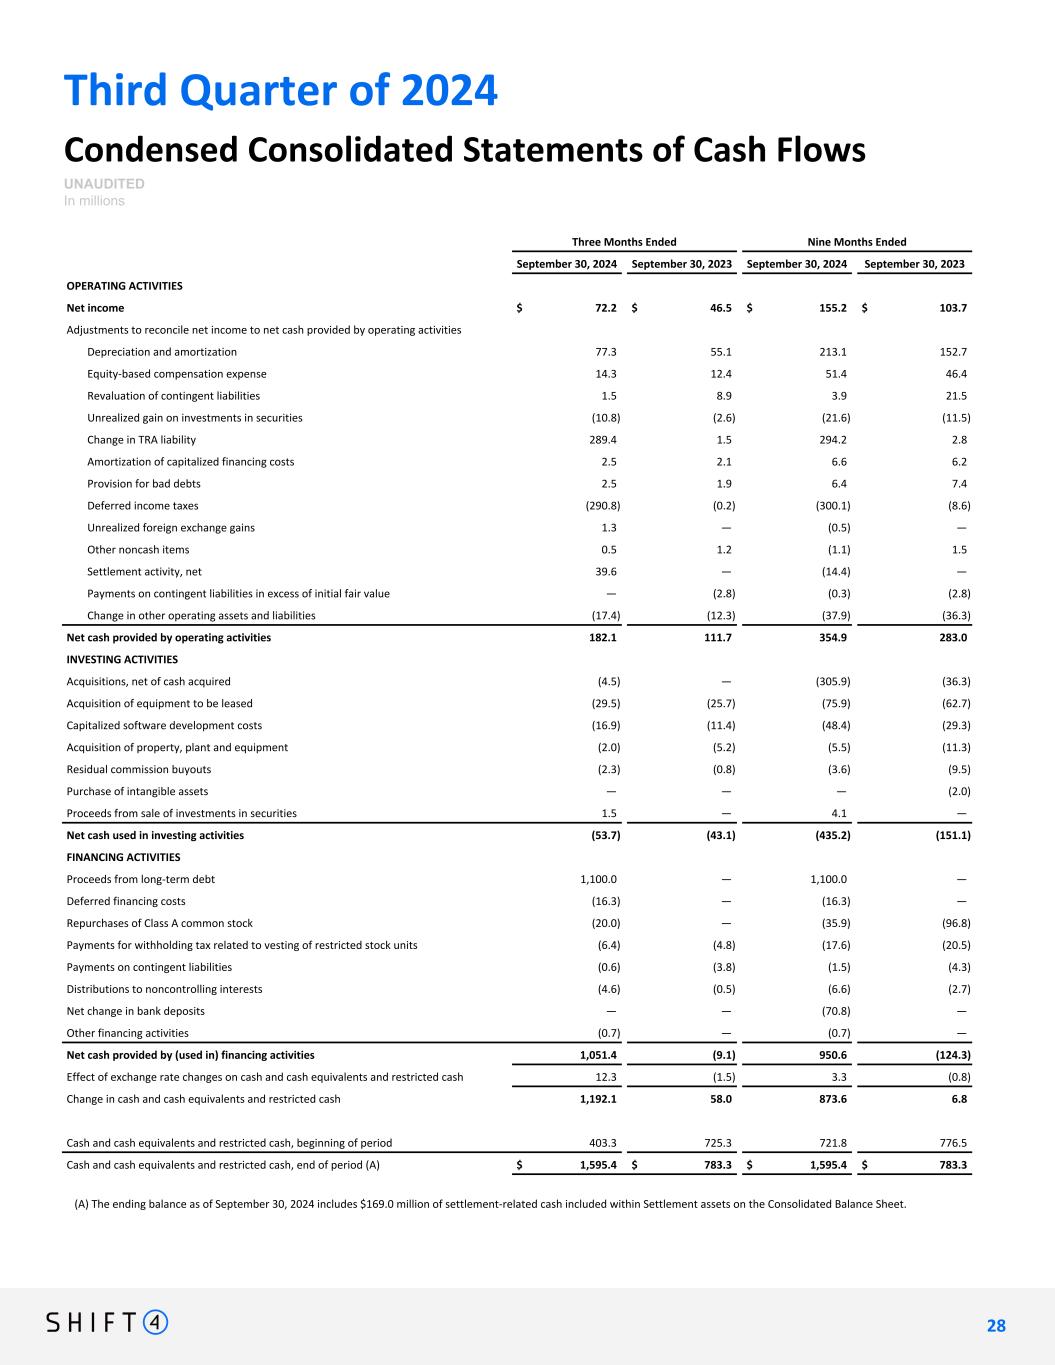
Third Quarter of 2024 Condensed Consolidated Statements of Cash Flows UNAUDITED In millions Three Months Ended Nine Months Ended September 30, 2024 September 30, 2023 September 30, 2024 September 30, 2023 OPERATING ACTIVITIES Net income $ 72.2 $ 46.5 $ 155.2 $ 103.7 Adjustments to reconcile net income to net cash provided by operating activities Depreciation and amortization 77.3 55.1 213.1 152.7 Equity-based compensation expense 14.3 12.4 51.4 46.4 Revaluation of contingent liabilities 1.5 8.9 3.9 21.5 Unrealized gain on investments in securities (10.8) (2.6) (21.6) (11.5) Change in TRA liability 289.4 1.5 294.2 2.8 Amortization of capitalized financing costs 2.5 2.1 6.6 6.2 Provision for bad debts 2.5 1.9 6.4 7.4 Deferred income taxes (290.8) (0.2) (300.1) (8.6) Unrealized foreign exchange gains 1.3 — (0.5) — Other noncash items 0.5 1.2 (1.1) 1.5 Settlement activity, net 39.6 — (14.4) — Payments on contingent liabilities in excess of initial fair value — (2.8) (0.3) (2.8) Change in other operating assets and liabilities (17.4) (12.3) (37.9) (36.3) Net cash provided by operating activities 182.1 111.7 354.9 283.0 INVESTING ACTIVITIES Acquisitions, net of cash acquired (4.5) — (305.9) (36.3) Acquisition of equipment to be leased (29.5) (25.7) (75.9) (62.7) Capitalized software development costs (16.9) (11.4) (48.4) (29.3) Acquisition of property, plant and equipment (2.0) (5.2) (5.5) (11.3) Residual commission buyouts (2.3) (0.8) (3.6) (9.5) Purchase of intangible assets — — — (2.0) Proceeds from sale of investments in securities 1.5 — 4.1 — Net cash used in investing activities (53.7) (43.1) (435.2) (151.1) FINANCING ACTIVITIES Proceeds from long-term debt 1,100.0 — 1,100.0 — Deferred financing costs (16.3) — (16.3) — Repurchases of Class A common stock (20.0) — (35.9) (96.8) Payments for withholding tax related to vesting of restricted stock units (6.4) (4.8) (17.6) (20.5) Payments on contingent liabilities (0.6) (3.8) (1.5) (4.3) Distributions to noncontrolling interests (4.6) (0.5) (6.6) (2.7) Net change in bank deposits — — (70.8) — Other financing activities (0.7) — (0.7) — Net cash provided by (used in) financing activities 1,051.4 (9.1) 950.6 (124.3) Effect of exchange rate changes on cash and cash equivalents and restricted cash 12.3 (1.5) 3.3 (0.8) Change in cash and cash equivalents and restricted cash 1,192.1 58.0 873.6 6.8 Cash and cash equivalents and restricted cash, beginning of period 403.3 725.3 721.8 776.5 Cash and cash equivalents and restricted cash, end of period (A) $ 1,595.4 $ 783.3 $ 1,595.4 $ 783.3 2 8 28 (A) The ending balance as of September 30, 2024 includes $169.0 million of settlement-related cash included within Settlement assets on the Consolidated Balance Sheet.
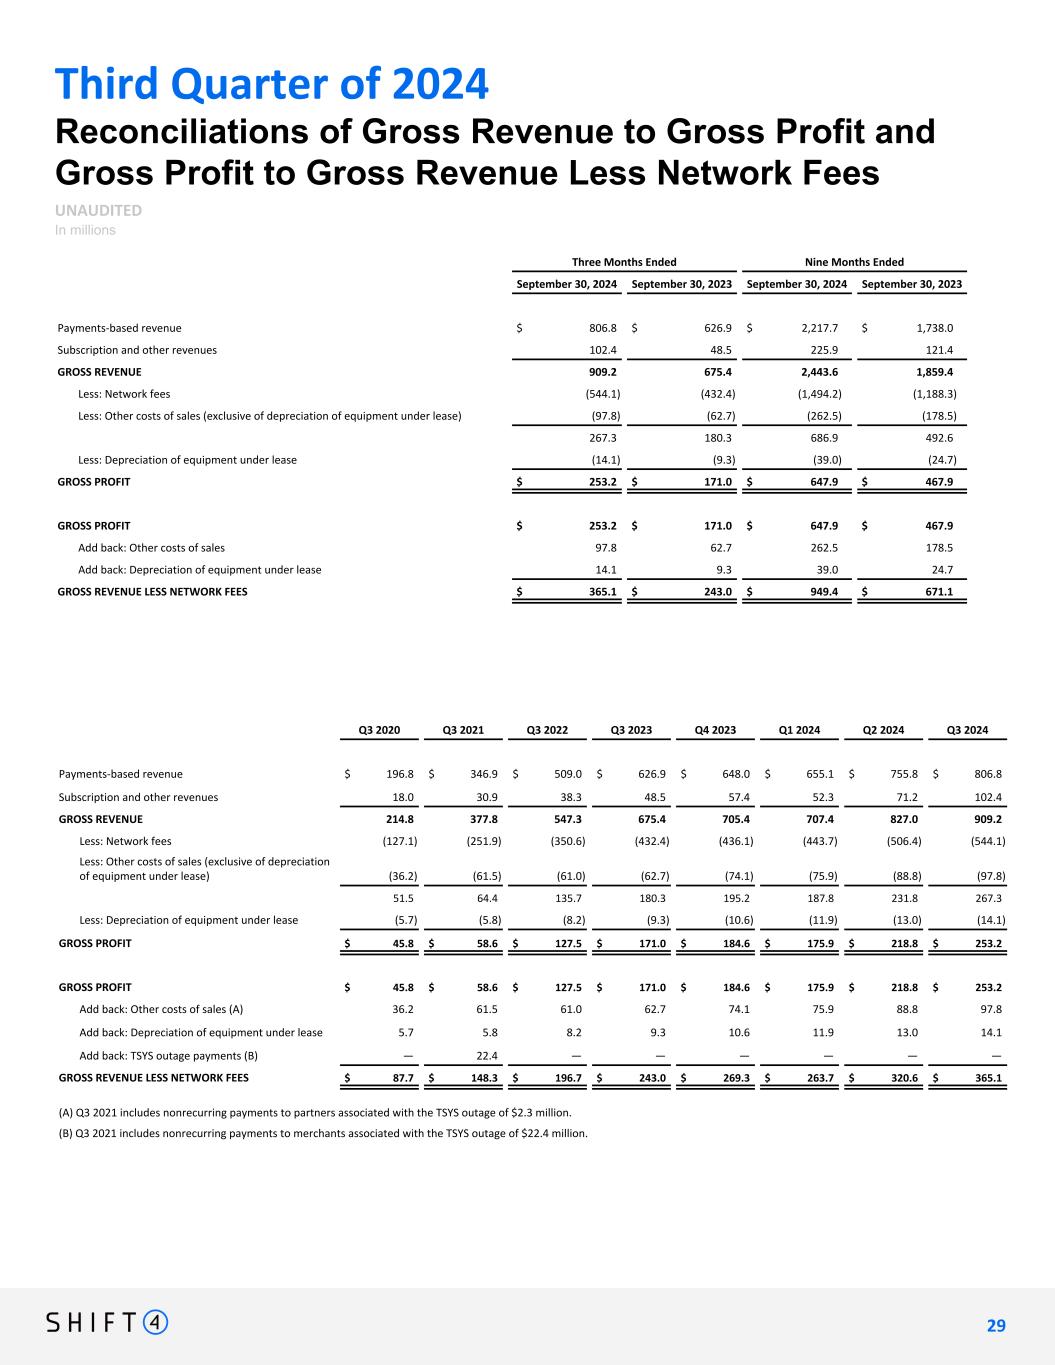
Third Quarter of 2024 Reconciliations of Gross Revenue to Gross Profit and Gross Profit to Gross Revenue Less Network Fees UNAUDITED In millions Three Months Ended Nine Months Ended September 30, 2024 September 30, 2023 September 30, 2024 September 30, 2023 Payments-based revenue $ 806.8 $ 626.9 $ 2,217.7 $ 1,738.0 Subscription and other revenues 102.4 48.5 225.9 121.4 GROSS REVENUE 909.2 675.4 2,443.6 1,859.4 Less: Network fees (544.1) (432.4) (1,494.2) (1,188.3) Less: Other costs of sales (exclusive of depreciation of equipment under lease) (97.8) (62.7) (262.5) (178.5) 267.3 180.3 686.9 492.6 Less: Depreciation of equipment under lease (14.1) (9.3) (39.0) (24.7) GROSS PROFIT $ 253.2 $ 171.0 $ 647.9 $ 467.9 GROSS PROFIT $ 253.2 $ 171.0 $ 647.9 $ 467.9 Add back: Other costs of sales 97.8 62.7 262.5 178.5 Add back: Depreciation of equipment under lease 14.1 9.3 39.0 24.7 GROSS REVENUE LESS NETWORK FEES $ 365.1 $ 243.0 $ 949.4 $ 671.1 Q3 2020 Q3 2021 Q3 2022 Q3 2023 Q4 2023 Q1 2024 Q2 2024 Q3 2024 Payments-based revenue $ 196.8 $ 346.9 $ 509.0 $ 626.9 $ 648.0 $ 655.1 $ 755.8 $ 806.8 Subscription and other revenues 18.0 30.9 38.3 48.5 57.4 52.3 71.2 102.4 GROSS REVENUE 214.8 377.8 547.3 675.4 705.4 707.4 827.0 909.2 Less: Network fees (127.1) (251.9) (350.6) (432.4) (436.1) (443.7) (506.4) (544.1) Less: Other costs of sales (exclusive of depreciation of equipment under lease) (36.2) (61.5) (61.0) (62.7) (74.1) (75.9) (88.8) (97.8) 51.5 64.4 135.7 180.3 195.2 187.8 231.8 267.3 Less: Depreciation of equipment under lease (5.7) (5.8) (8.2) (9.3) (10.6) (11.9) (13.0) (14.1) GROSS PROFIT $ 45.8 $ 58.6 $ 127.5 $ 171.0 $ 184.6 $ 175.9 $ 218.8 $ 253.2 GROSS PROFIT $ 45.8 $ 58.6 $ 127.5 $ 171.0 $ 184.6 $ 175.9 $ 218.8 $ 253.2 Add back: Other costs of sales (A) 36.2 61.5 61.0 62.7 74.1 75.9 88.8 97.8 Add back: Depreciation of equipment under lease 5.7 5.8 8.2 9.3 10.6 11.9 13.0 14.1 Add back: TSYS outage payments (B) — 22.4 — — — — — — GROSS REVENUE LESS NETWORK FEES $ 87.7 $ 148.3 $ 196.7 $ 243.0 $ 269.3 $ 263.7 $ 320.6 $ 365.1 (A) Q3 2021 includes nonrecurring payments to partners associated with the TSYS outage of $2.3 million. (B) Q3 2021 includes nonrecurring payments to merchants associated with the TSYS outage of $22.4 million. 2 9 29
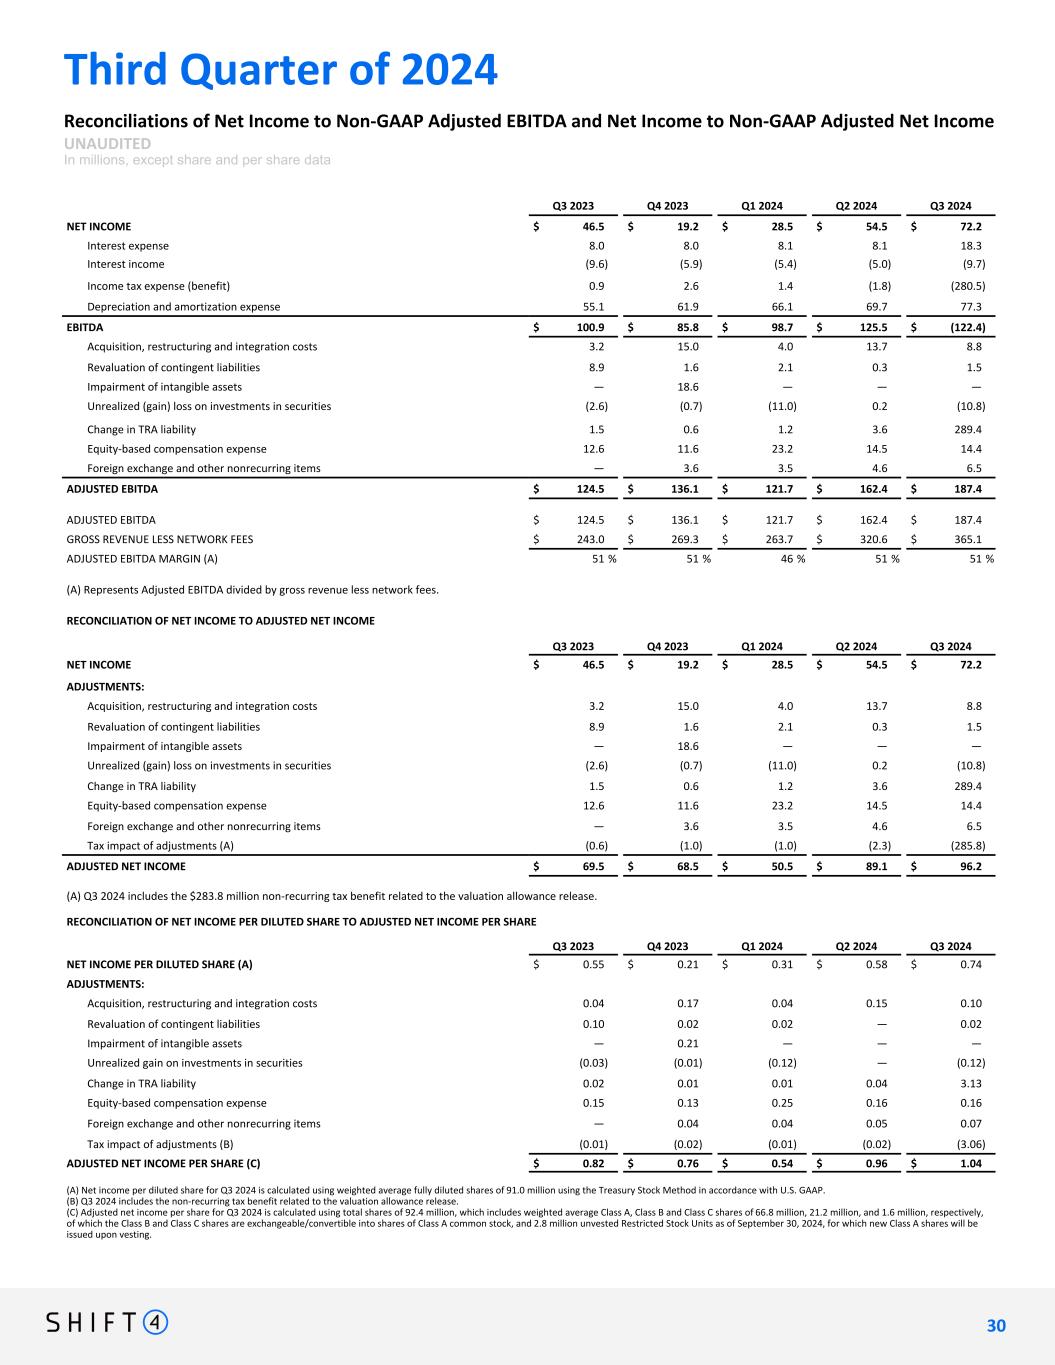
Third Quarter of 2024 Reconciliations of Net Income to Non-GAAP Adjusted EBITDA and Net Income to Non-GAAP Adjusted Net Income UNAUDITED In millions, except share and per share data Q3 2023 Q4 2023 Q1 2024 Q2 2024 Q3 2024 NET INCOME $ 46.5 $ 19.2 $ 28.5 $ 54.5 $ 72.2 Interest expense 8.0 8.0 8.1 8.1 18.3 Interest income (9.6) (5.9) (5.4) (5.0) (9.7) Income tax expense (benefit) 0.9 2.6 1.4 (1.8) (280.5) Depreciation and amortization expense 55.1 61.9 66.1 69.7 77.3 EBITDA $ 100.9 $ 85.8 $ 98.7 $ 125.5 $ (122.4) Acquisition, restructuring and integration costs 3.2 15.0 4.0 13.7 8.8 Revaluation of contingent liabilities 8.9 1.6 2.1 0.3 1.5 Impairment of intangible assets — 18.6 — — — Unrealized (gain) loss on investments in securities (2.6) (0.7) (11.0) 0.2 (10.8) Change in TRA liability 1.5 0.6 1.2 3.6 289.4 Equity-based compensation expense 12.6 11.6 23.2 14.5 14.4 Foreign exchange and other nonrecurring items — 3.6 3.5 4.6 6.5 ADJUSTED EBITDA $ 124.5 $ 136.1 $ 121.7 $ 162.4 $ 187.4 ADJUSTED EBITDA $ 124.5 $ 136.1 $ 121.7 $ 162.4 $ 187.4 GROSS REVENUE LESS NETWORK FEES $ 243.0 $ 269.3 $ 263.7 $ 320.6 $ 365.1 ADJUSTED EBITDA MARGIN (A) 51 % 51 % 46 % 51 % 51 % (A) Represents Adjusted EBITDA divided by gross revenue less network fees. RECONCILIATION OF NET INCOME TO ADJUSTED NET INCOME Q3 2023 Q4 2023 Q1 2024 Q2 2024 Q3 2024 NET INCOME $ 46.5 $ 19.2 $ 28.5 $ 54.5 $ 72.2 ADJUSTMENTS: Acquisition, restructuring and integration costs 3.2 15.0 4.0 13.7 8.8 Revaluation of contingent liabilities 8.9 1.6 2.1 0.3 1.5 Impairment of intangible assets — 18.6 — — — Unrealized (gain) loss on investments in securities (2.6) (0.7) (11.0) 0.2 (10.8) Change in TRA liability 1.5 0.6 1.2 3.6 289.4 Equity-based compensation expense 12.6 11.6 23.2 14.5 14.4 Foreign exchange and other nonrecurring items — 3.6 3.5 4.6 6.5 Tax impact of adjustments (A) (0.6) (1.0) (1.0) (2.3) (285.8) ADJUSTED NET INCOME $ 69.5 $ 68.5 $ 50.5 $ 89.1 $ 96.2 (A) Q3 2024 includes the $283.8 million non-recurring tax benefit related to the valuation allowance release. RECONCILIATION OF NET INCOME PER DILUTED SHARE TO ADJUSTED NET INCOME PER SHARE Q3 2023 Q4 2023 Q1 2024 Q2 2024 Q3 2024 NET INCOME PER DILUTED SHARE (A) $ 0.55 $ 0.21 $ 0.31 $ 0.58 $ 0.74 ADJUSTMENTS: Acquisition, restructuring and integration costs 0.04 0.17 0.04 0.15 0.10 Revaluation of contingent liabilities 0.10 0.02 0.02 — 0.02 Impairment of intangible assets — 0.21 — — — Unrealized gain on investments in securities (0.03) (0.01) (0.12) — (0.12) Change in TRA liability 0.02 0.01 0.01 0.04 3.13 Equity-based compensation expense 0.15 0.13 0.25 0.16 0.16 Foreign exchange and other nonrecurring items — 0.04 0.04 0.05 0.07 Tax impact of adjustments (B) (0.01) (0.02) (0.01) (0.02) (3.06) ADJUSTED NET INCOME PER SHARE (C) $ 0.82 $ 0.76 $ 0.54 $ 0.96 $ 1.04 (A) Net income per diluted share for Q3 2024 is calculated using weighted average fully diluted shares of 91.0 million using the Treasury Stock Method in accordance with U.S. GAAP. (B) Q3 2024 includes the non-recurring tax benefit related to the valuation allowance release. (C) Adjusted net income per share for Q3 2024 is calculated using total shares of 92.4 million, which includes weighted average Class A, Class B and Class C shares of 66.8 million, 21.2 million, and 1.6 million, respectively, of which the Class B and Class C shares are exchangeable/convertible into shares of Class A common stock, and 2.8 million unvested Restricted Stock Units as of September 30, 2024, for which new Class A shares will be issued upon vesting. 3 0 30
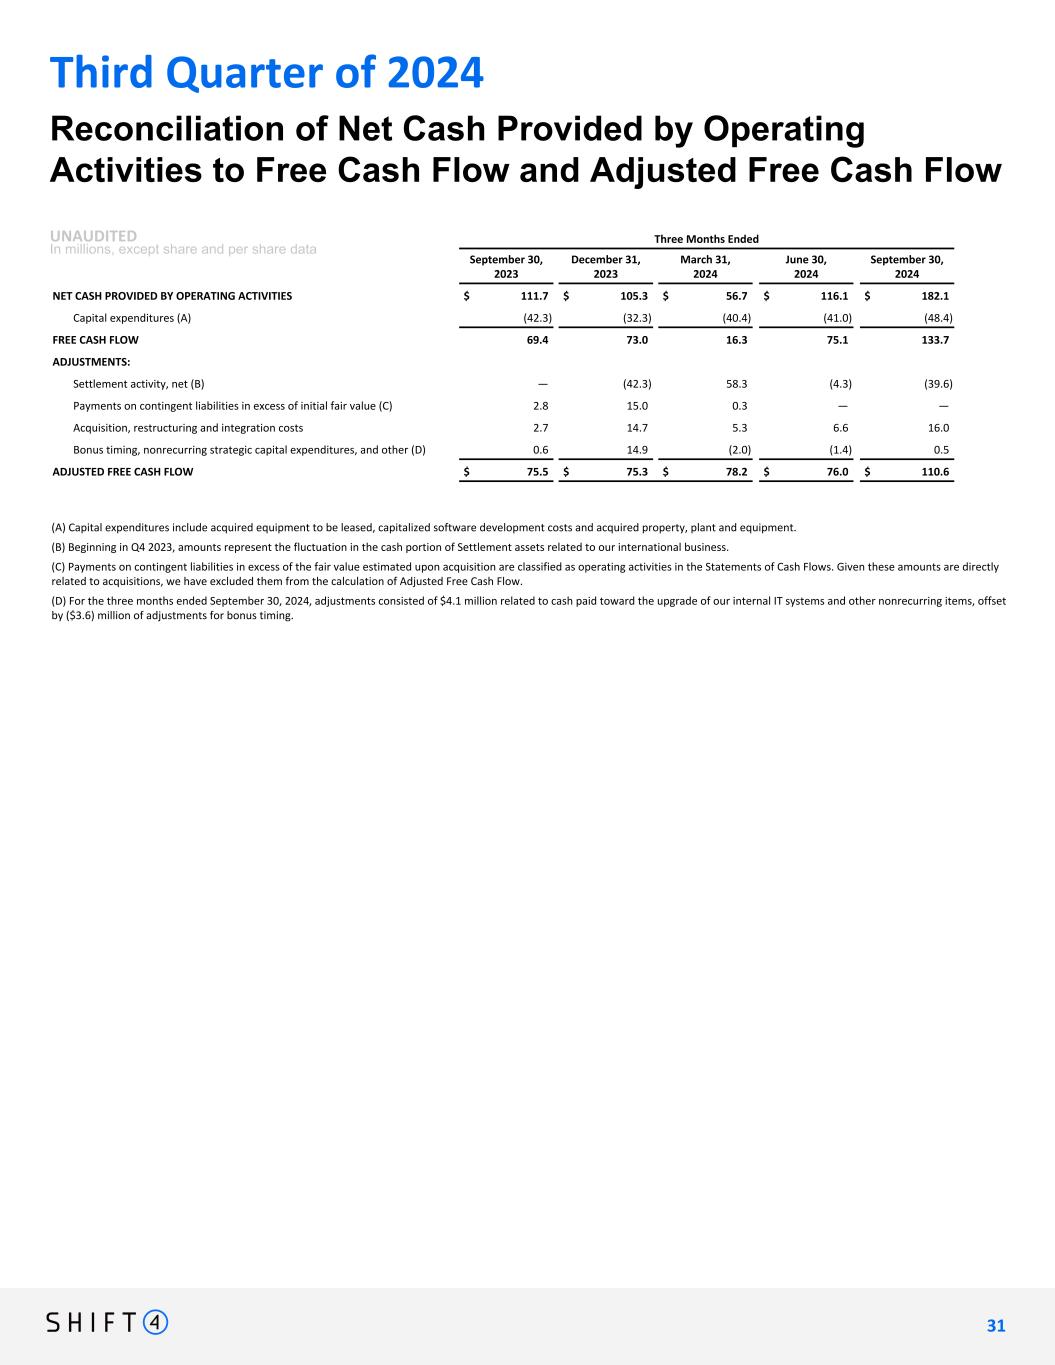
Three Months Ended September 30, 2023 December 31, 2023 March 31, 2024 June 30, 2024 September 30, 2024 NET CASH PROVIDED BY OPERATING ACTIVITIES $ 111.7 $ 105.3 $ 56.7 $ 116.1 $ 182.1 Capital expenditures (A) (42.3) (32.3) (40.4) (41.0) (48.4) FREE CASH FLOW 69.4 73.0 16.3 75.1 133.7 ADJUSTMENTS: Settlement activity, net (B) — (42.3) 58.3 (4.3) (39.6) Payments on contingent liabilities in excess of initial fair value (C) 2.8 15.0 0.3 — — Acquisition, restructuring and integration costs 2.7 14.7 5.3 6.6 16.0 Bonus timing, nonrecurring strategic capital expenditures, and other (D) 0.6 14.9 (2.0) (1.4) 0.5 ADJUSTED FREE CASH FLOW $ 75.5 $ 75.3 $ 78.2 $ 76.0 $ 110.6 Reconciliation of Net Cash Provided by Operating Activities to Free Cash Flow and Adjusted Free Cash Flow UNAUDITED In millions, except share and per share data Third Quarter of 2024 (A) Capital expenditures include acquired equipment to be leased, capitalized software development costs and acquired property, plant and equipment. (B) Beginning in Q4 2023, amounts represent the fluctuation in the cash portion of Settlement assets related to our international business. (C) Payments on contingent liabilities in excess of the fair value estimated upon acquisition are classified as operating activities in the Statements of Cash Flows. Given these amounts are directly related to acquisitions, we have excluded them from the calculation of Adjusted Free Cash Flow. (D) For the three months ended September 30, 2024, adjustments consisted of $4.1 million related to cash paid toward the upgrade of our internal IT systems and other nonrecurring items, offset by ($3.6) million of adjustments for bonus timing. 3 1 31
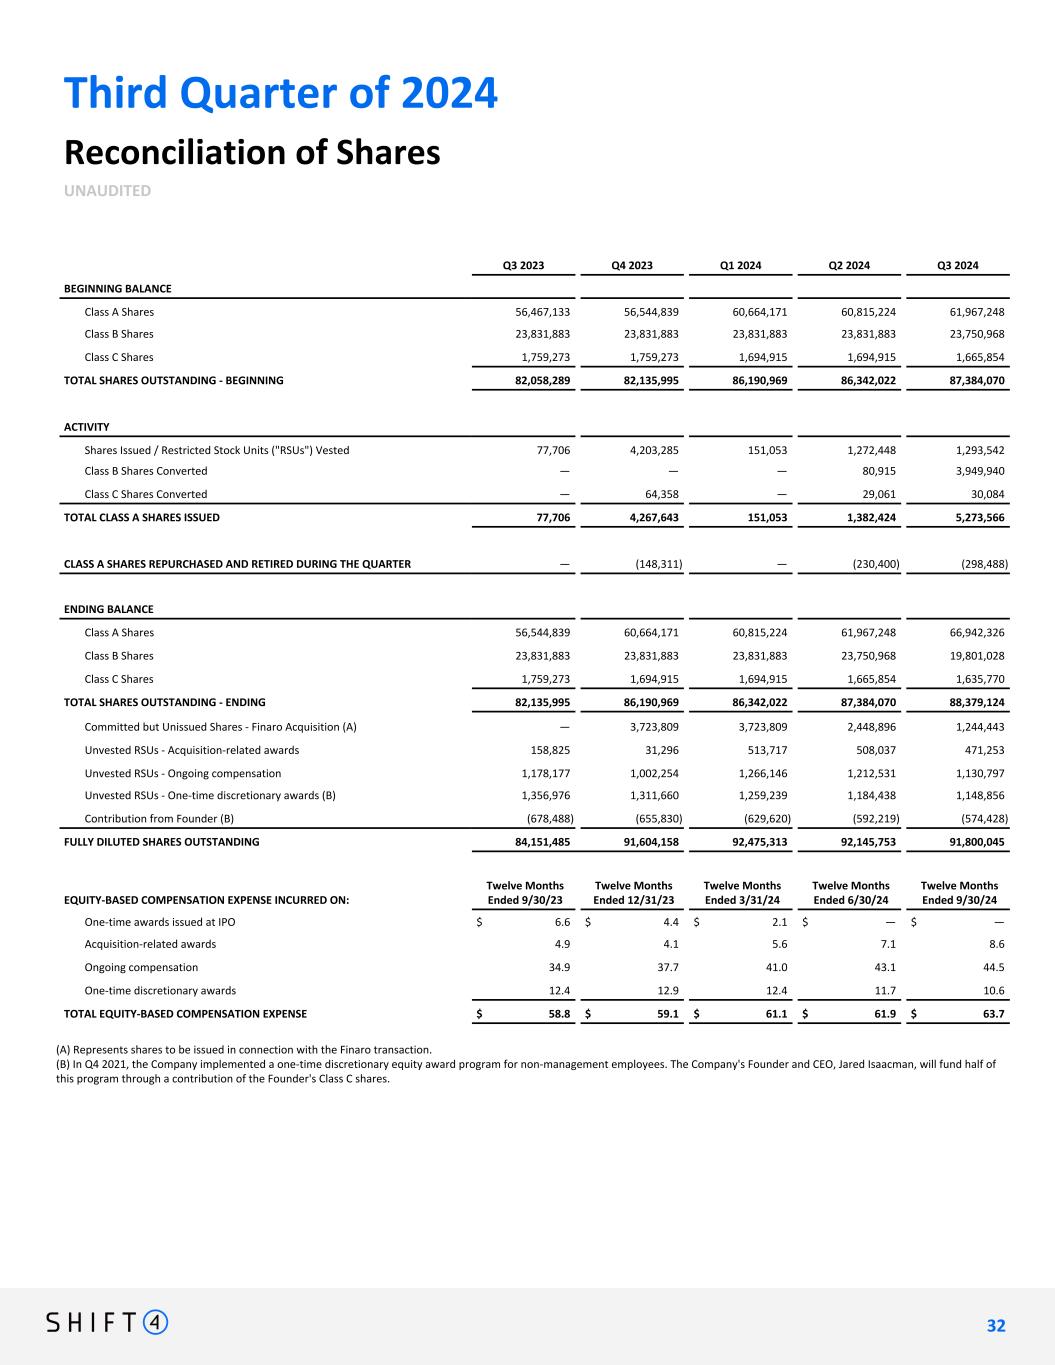
Third Quarter of 2024 Reconciliation of Shares UNAUDITED Q3 2023 Q4 2023 Q1 2024 Q2 2024 Q3 2024 BEGINNING BALANCE Class A Shares 56,467,133 56,544,839 60,664,171 60,815,224 61,967,248 Class B Shares 23,831,883 23,831,883 23,831,883 23,831,883 23,750,968 Class C Shares 1,759,273 1,759,273 1,694,915 1,694,915 1,665,854 TOTAL SHARES OUTSTANDING - BEGINNING 82,058,289 82,135,995 86,190,969 86,342,022 87,384,070 ACTIVITY Shares Issued / Restricted Stock Units ("RSUs") Vested 77,706 4,203,285 151,053 1,272,448 1,293,542 Class B Shares Converted — — — 80,915 3,949,940 Class C Shares Converted — 64,358 — 29,061 30,084 TOTAL CLASS A SHARES ISSUED 77,706 4,267,643 151,053 1,382,424 5,273,566 CLASS A SHARES REPURCHASED AND RETIRED DURING THE QUARTER — (148,311) — (230,400) (298,488) ENDING BALANCE Class A Shares 56,544,839 60,664,171 60,815,224 61,967,248 66,942,326 Class B Shares 23,831,883 23,831,883 23,831,883 23,750,968 19,801,028 Class C Shares 1,759,273 1,694,915 1,694,915 1,665,854 1,635,770 TOTAL SHARES OUTSTANDING - ENDING 82,135,995 86,190,969 86,342,022 87,384,070 88,379,124 Committed but Unissued Shares - Finaro Acquisition (A) — 3,723,809 3,723,809 2,448,896 1,244,443 Unvested RSUs - Acquisition-related awards 158,825 31,296 513,717 508,037 471,253 Unvested RSUs - Ongoing compensation 1,178,177 1,002,254 1,266,146 1,212,531 1,130,797 Unvested RSUs - One-time discretionary awards (B) 1,356,976 1,311,660 1,259,239 1,184,438 1,148,856 Contribution from Founder (B) (678,488) (655,830) (629,620) (592,219) (574,428) FULLY DILUTED SHARES OUTSTANDING 84,151,485 91,604,158 92,475,313 92,145,753 91,800,045 EQUITY-BASED COMPENSATION EXPENSE INCURRED ON: Twelve Months Ended 9/30/23 Twelve Months Ended 12/31/23 Twelve Months Ended 3/31/24 Twelve Months Ended 6/30/24 Twelve Months Ended 9/30/24 One-time awards issued at IPO $ 6.6 $ 4.4 $ 2.1 $ — $ — Acquisition-related awards 4.9 4.1 5.6 7.1 8.6 Ongoing compensation 34.9 37.7 41.0 43.1 44.5 One-time discretionary awards 12.4 12.9 12.4 11.7 10.6 TOTAL EQUITY-BASED COMPENSATION EXPENSE $ 58.8 $ 59.1 $ 61.1 $ 61.9 $ 63.7 (A) Represents shares to be issued in connection with the Finaro transaction. (B) In Q4 2021, the Company implemented a one-time discretionary equity award program for non-management employees. The Company's Founder and CEO, Jared Isaacman, will fund half of this program through a contribution of the Founder's Class C shares. 3 2 32