
Q4 2024 SHAREHOLDER LETTER INVESTORS.SHIFT4.COM 'Tis the Season for Enterprise Wins pop more - get rid of ikon yellow Exhibit 99.1
Non-GAAP Financial Measures and Key Performance Indicators Forward-Looking Statements We use supplemental measures of our performance which are derived from our consolidated financial information but which are not presented in our consolidated financial statements prepared in accordance with U.S. generally accepted accounting principles ("GAAP"). These non-GAAP financial measures include: gross revenue less network fees, which includes interchange and adjustment fees; adjusted net income; adjusted net income per share; free cash flow; Adjusted Free Cash Flow; earnings before interest expense, interest income, income taxes, depreciation, and amortization (“EBITDA”); Adjusted EBITDA; Adjusted EBITDA conversion rate; and Adjusted EBITDA margin. Gross revenue less network fees represents a key performance metric that management uses to measure changes in the mix and value derived from our customer base as we continue to execute our strategy to expand our reach to serve larger, complex merchants. Adjusted net income represents net income adjusted for certain non-cash and other nonrecurring items that management believes are not indicative of ongoing operations, such as acquisition, restructuring and integration costs, revaluation of contingent liabilities, impairment of intangible assets, gain (loss) on investments in securities, change in TRA liability, equity-based compensation expense, and foreign exchange and other nonrecurring items. Adjusted EBITDA is the primary financial performance measure used by management to evaluate its business and monitor results of operations. Adjusted EBITDA represents EBITDA further adjusted for certain non- cash and other nonrecurring items that management believes are not indicative of ongoing operations. These adjustments include acquisition, restructuring and integration costs, revaluation of contingent liabilities, impairment of intangible assets, gain (loss) on investments in securities, changes in TRA liability, equity-based compensation expense, and foreign exchange and other nonrecurring items. Free cash flow represents net cash provided by operating activities adjusted for non-discretionary capital expenditures. Adjusted EBITDA Margin represents Adjusted EBITDA divided by gross revenue less network fees. Free cash flow represents net cash provided by operating activities adjusted for certain capital expenditures. Adjusted Free Cash Flow represents free cash flow further adjusted for certain transactions that are not indicative of future operating cash flows, including acquisition, restructuring and integration costs, the impact of timing of annual performance bonuses, other nonrecurring expenses, and nonrecurring strategic capital expenditures that are not indicative of ongoing activities. We believe Adjusted Free Cash Flow is useful to measure the funds generated in a given period that are available to invest in the business, to repurchase stock and to make strategic decisions. The Adjusted EBITDA conversion rate is calculated as Adjusted Free Cash Flow divided by Adjusted EBITDA. We use non-GAAP financial measures to supplement financial information presented on a GAAP basis. We believe that excluding certain items from our GAAP results allows management to better understand our consolidated financial performance and, in the case of Adjusted Free Cash Flow, our liquidity, from period to period and better project our future consolidated financial performance as forecasts are developed at a level of detail different from that used to prepare GAAP-based financial measures. Moreover, we believe these non-GAAP financial measures provide our stakeholders with useful information to help them evaluate our operating results by facilitating an enhanced understanding of our operating performance and, in the case of Adjusted Free Cash Flow, our liquidity, and enabling them to make more meaningful period to period comparisons. There are limitations to the use of the non-GAAP financial measures presented in this letter. Our non-GAAP financial measures may not be comparable to similarly titled measures of other companies. Other companies, including companies in our industry, may calculate non-GAAP financial measures differently than we do, limiting the usefulness of those measures for comparative purposes. We have based these forward-looking statements largely on our current expectations and projections about future events and financial trends that we believe may affect our business, financial condition and results of operations. These forward-looking statements speak only as of the date of this letter. These statements are neither promises nor guarantees, but involve known and unknown risks, uncertainties and other important factors that may cause our actual results, performance or achievements to be materially different from any future results, performance or achievements expressed or implied by the forward-looking statements, including, but not limited to, the following: the substantial and increasingly intense competition worldwide in the financial services, payments and payment technology industries; potential changes in the competitive landscape, including disintermediation from other participants in the payments chain; the effect of global economic, political and other conditions on trends in consumer, business and government spending; fluctuations in inflation; our ability to anticipate and respond to changing industry trends and the needs and preferences of our merchants and consumers; our reliance on third-party vendors to provide products and services; risks associated with acquisitions; dispositions, and other strategic transactions; our inability to protect our IT systems and confidential information, as well as the IT systems of third parties we rely on, from continually evolving cybersecurity risks, security breaches or other technological risks; compliance with governmental regulation and other legal obligations, particularly related to privacy, data protection and information security, marketing across different markets where we conduct our business; risks associated with a The non-GAAP financial measures are not meant to be considered as indicators of performance, or in the case of Adjusted Free Cash Flow, as an indicator of liquidity, in isolation from or as a substitute for financial information prepared in accordance with GAAP, and should be read only in conjunction with financial information presented on a GAAP basis. Reconciliations each of EBITDA and Adjusted EBITDA, gross revenue less network fees, adjusted net income, adjusted net income per share, free cash flow and Adjusted Free Cash Flow to, in each case, its most directly comparable GAAP financial measure are presented in Appendix - Financial Information. For 2025, we are unable to provide a reconciliation of Gross revenue less network fees, Adjusted EBITDA, and Adjusted Free Cash Flow to Gross Profit, Net Income, and net cash provided by operating activities, respectively, the nearest comparable GAAP measures, without unreasonable efforts. We are also unable to provide a reconciliation of free cash flow to net cash provided by operating activities for the three year period ended December 31, 2027 without unreasonable efforts. We encourage you to review the reconciliations in conjunction with the presentation of the non-GAAP financial measures for each of the periods presented. In future fiscal periods, we may exclude such items and may incur income and expenses similar to these excluded items. In addition, key performance indicators include end-to-end payment volume, Blended Spread and margin. End-to- end payment volume is defined as the total dollar amount of payments that we deliver for settlement on behalf of our merchants. Included in end-to-end volume are dollars routed via our international payments platform and alternative payment methods, including cryptocurrency and stock donations, plus volume we route to one or more third party merchant acquirers on behalf of strategic enterprise merchant relationships. This volume does not include volume processed through our legacy gateway-only offering. Blended Spread represents the average yield Shift4 earns on the average end-to-end payment volume processed for a given period after network fees. Blended Spread is calculated as payments-based revenue less gateway revenue and network fees for a given period divided by the end-to-end payment volume processed for the same period. variety of laws and regulations, including those relating to financial services, money-laundering, anti-bribery, sanctions, and counter-terrorist financing, consumer protection and cryptocurrencies; our ability to continue to expand our share of the existing payment processing markets or expand into new markets; additional risks associated with our expansion into international operations, including compliance with and changes in foreign regulations governmental policies, as well as exposure to foreign exchange rates; our ability to integrate and interoperate our services and products with a variety of operating systems, software, devices, and web browsers; our dependence, in part, on our merchant and software partner relationships and strategic partnerships with various institutions to operate and grow our business; and the significant influence Jared Isaacman, our CEO and founder, has over us, including control over decisions that require the approval of stockholders, including a change in control, his expected transition, and the timing of any of the foregoing. These and other important factors discussed under the caption “Risk Factors” in Part I, Item 1A. in our Annual Report on Form 10-K for the fiscal year ended December 31, 2024, and our other filings with the Securities and Exchange Commission could cause actual results to differ materially from those indicated by the forward-looking statements made in this letter. Any such forward-looking statements represent management’s estimates as of the date of this letter. While we may elect to update such forward-looking statements at some point in the future, we disclaim any obligation to do so, even if subsequent events cause our views to change. 2 This letter contains forward-looking statements within the meaning of the Private Securities Litigation Reform Act of 1995. Shift4 Payments, Inc. (“we,” “our,” the “Company,” or “Shift4”) intends such forward-looking statements to be covered by the safe harbor provisions for forward-looking statements contained in Section 27A of the Securities Act of 1933, as amended and Section 21E of the Securities Exchange Act of 1934, as amended. All statements contained in this letter, other than statements of historical fact, including, without limitation, statements relating to our position as a leader within our industry; our future results of operations and financial position, business strategy and plans; the impact of changes in TRA liability; the anticipated benefits of and costs associated with recent acquisitions; and objectives of management for future operations and activities, including, among others, statements regarding expected growth, international expansion, future capital expenditures, debt covenant compliance, financing activities, debt service obligations including the settlement of conversions of our 2025 Convertible Notes, executive transitions and succession planning, the timing of any of the foregoing, and our financial outlook and guidance for 2025 and future periods, are forward-looking statements. In some cases, you can identify forward-looking statements by terms such as “may,” “will,” “should,” “expect,” “plan,” “anticipate,” “could,” “intend,” “target,” “project,” “contemplate,” “believe,” “estimate,” “predict,” “potential,” or “continue” or the negative of these terms or other similar expressions, though not all forward-looking statements can be identified by such terms or expressions.
We wrapped up another reasonably strong quarter, executing well on our strategy – growing rapidly and profitably, generating free cash flow, improving our products, unlocking efficiencies, enhancing our capital structure and, most importantly, topping off what has become an impressive customer conversion funnel. To be concise, I want to break down what we accomplished this quarter and highlight what we still have going for us as we aim for even greater performance on the road ahead. Q3 Accomplishments • Despite accelerating some of the revenue model rebuild in our recent acquisitions and facing some softening consumer spending, we delivered record Volume of 43.5 Billion, $365 million of GRLNF, $187 million of EBITDA, $111 million of FCF, while maintaining spreads of 60bps. • Adjusted net leverage was____ and we rebuilt our capital structure with new ____ providing substantial firepower for organic and inorganic investments as well as opportunistic buybacks. • Expanded margins to 54% excluding recent M&A drag. • Achieved major hospitality wins, including securing deals with [Wynn Resorts and] KSL Resorts, which encompasses 40 iconic properties like Blue Mountain, Camelback, Deer Valley, and all the Hawaiian Outrigger brands. [We further won Alterra ___ ] • The sports, entertainment, and ticketing wins keep piling up including _______ stadiums. • Grew Skytab system installations quarter-over-quarter _______, including ramping production in the UK and Ireland. • Followed our strategic customers into ____ new countries with many more lined up for the balance of the year. • Pulled forward the Revel and Vectron integration plan and began executing on the Vectron 65,000 merchant conversion opportunity across central Europe, with our first installs already taking place. • Announced the acquisition of Givex, expected to close in Q4, adding over 120,000 new gift and loyalty customers, representing what we believe to be over $300 billion in payment volume cross-sell opportunity. This acquisition also brings product enhancements through a best-in-class gift and loyalty platform. • Increased contracted volume backlog to $30B. • We remain on track to close the year with organic GRLNF exceeding 25% and easily surpassing all mid-term outlook goals set more than three years ago. Dear Shareholders, 3 3 Jared Isaacman CEO jared@shift4.com V7 - DRAFTS CIRCULATED VIA EMAIL (WORD DOC) Over the next few weeks, after 26 years leading Shift4, I will transition my responsibilities to Taylor Lauber. Despite what some may think, I do not find this personally or professionally challenging. Of course, there are so many great memories—from our teenage basement days to the ups and downs that forged Shift4 into the dreadnaught of a business it is today—but it is easy to step away knowing the company is well-positioned and in excellent hands. The timing feels rather fortuitous: e have delivered on every promise from our IPO, and now, alo gside reasonably s rong Q4 results, we will host an Investor Day to s t the stage for the years ahead. The Investor Day will begin shortly after an abridged investor call, which you can access here: investors.shift4.com This Investor Day will reinforce how Shift4 will continue to dominate in our selected verticals while expanding across the world. We will cover: • Review of Q4 Results: We closed 2024 on a reasonably strong note, expanding into new geographies and securing significant wins, including the eighteen Alterra Mountain Company resorts alongside ticketing for th iconic IKON P ss. We have continued to enhance our products, e ficiently deleting p rts nd intellige tly prioritizing our resources and rojects. As a result, our products & services are in a lot more countries-- and our cross-sell funnel is overflowing with opportunity. • Deep Dive into SkyTab: We exceeded our 2024 production goals, we will cover recent notable wins, the product roadmap (including our new mobile hardware SkyTab AIR), and our international expansion strategy. We are the second-fastest-growing player in this vertical—and we don’t like settling for second best. • Deep Dive into Hospitality: Highlights include recent wins like Alterra, renewal of Great Wolf Lodge, signing the luxury Meritage Collection of resort hotels, as well as new features and updates to our international strategy. We are the global leader in serving hospitality customers, which should be well reflected in the signature wins we announce each q arter. • Deep Dive into Spor s & Entertainment: Recent wins incl de adding ticketing for the New York Yanke s nd Dallas Mavericks, signing agreements with the Portland Trail Blazers, the Arizona Diamondbacks, and the University of Southern C lifornia, a d partnering wit Live Nation to power payments at their House of Blues venues. We were also honored to power payments for the College Football National Championship. Similar to Hospitality, when it comes to S&E, we are number one in the world. • Introduction of the Unified Commerce Product: Over the last three years, we have built a robust “one platform, one integration” capability, enabling commerce all over the world. This includes working alongside our strategic customer to shape the platform and then adding other enterprise merchants like St. Jude, Allegiant, BetMGM, Wolt and thousands of others. Features include pay-ins, payouts, cross-border transactions, merchant-of- record (MOR) capabilities, local-to-local functionality, a wide array of alternative payment method (APM ), inte ligent fraud management tools, and unique geographic coverage. It is really that geographic coverage and strengths in card present and card not present that we think will drive so much growth. It is probably worth reinforcing that this platform was developed to meet the requirements of the world’s most technologically advanced company and now it is ready for more just like them.
4 4 This brings us to the most significant acquisition announcement in Shift4’s history—one that will transform our ability to win in unified commerce in every major market across the globe. We are pleased to announce our acquisition of Global Blue in an all-cash transaction. This opportunity has been years in the making, and only recently—thanks to the maturity of our global unified commerce platform—did we feel adequately prepared to unlock the full potential of this acquisition. Like many of our past deals, Global Blue has been overlooked and undervalued, but unlike others, this isn’t a broken business. It’s an exceptional one, and here’s why: • Global Blue possesses scarce capabilities in payments, tax refunds, and dynamic currency conversion, and they offer these services all over the world. • They operate a true two-sided network serving over 75,000 luxury retailers and over 15 million affluent consumers through a proprietary app. • Similar to Visa and Mastercard, there are only two scaled players with these capabilities. This unique combination of offerings and a two-sided network creates a deep competitive moat. • The merchants they serve, including names like LVMH, Prada, Bottega Veneta, Fendi, and many others, represent a more than $500 billion payment cross-sell opportunity and the geographic footprint to accelerate our efforts in bringing our restaurant, hotel, and sports & entertainment products to new markets. As a reminder, our cross-sell funnel expansion is over $800 billion today, and with this transaction, our total cross-sell funnel increases to over $1.4T. • As mentioned, our unified commerce platform gives us the confidence to pursue this opportunity—a confidence shared by Tencent and Ant, two of the world’s largest fintech companies, that have committed to partnering with and purchasing substantial positions in Shift4 alongside this transaction. With all of this in mind—and with no mystery about where our customers will come from over the next few years—I have complete confidence in Taylor and the team’s ability to execute on the plan and deliver sustainable growth well into the future. This is reflected in our 2025 guidance and our new mid-term outlook, with the goal of reaching a $1 billion annual run rate in adjusted free cash flow within three years. I will participate in the Investor Day and continue serving as CEO through confirmation, but this is likely my farewell. I could never have imagined that the company I started in my parents’ basement would become the business it is today. And back then, I wasn’t thinking about how my career would end, but if I had been, I wouldn’t have dreamed of being nominated to lead the most accomplished space agency in the world. I have been fortunate to have a great career and I owe so much to my parents for letting me leave school to start this business—a risk I can hardly imagine allowing my own kids to ever take. I am immensely grateful to the Shift4 team for bringing so many ideas to life, the advisors and friends who supported us, the investors who believed in us, and, most importantly, this great nation, which makes the American Dream possible. Sincerely, Jared Isaacman CEO jared@shift4.com V7 - DRAFTS CIRCULATED VIA EMAIL (WORD DOC)
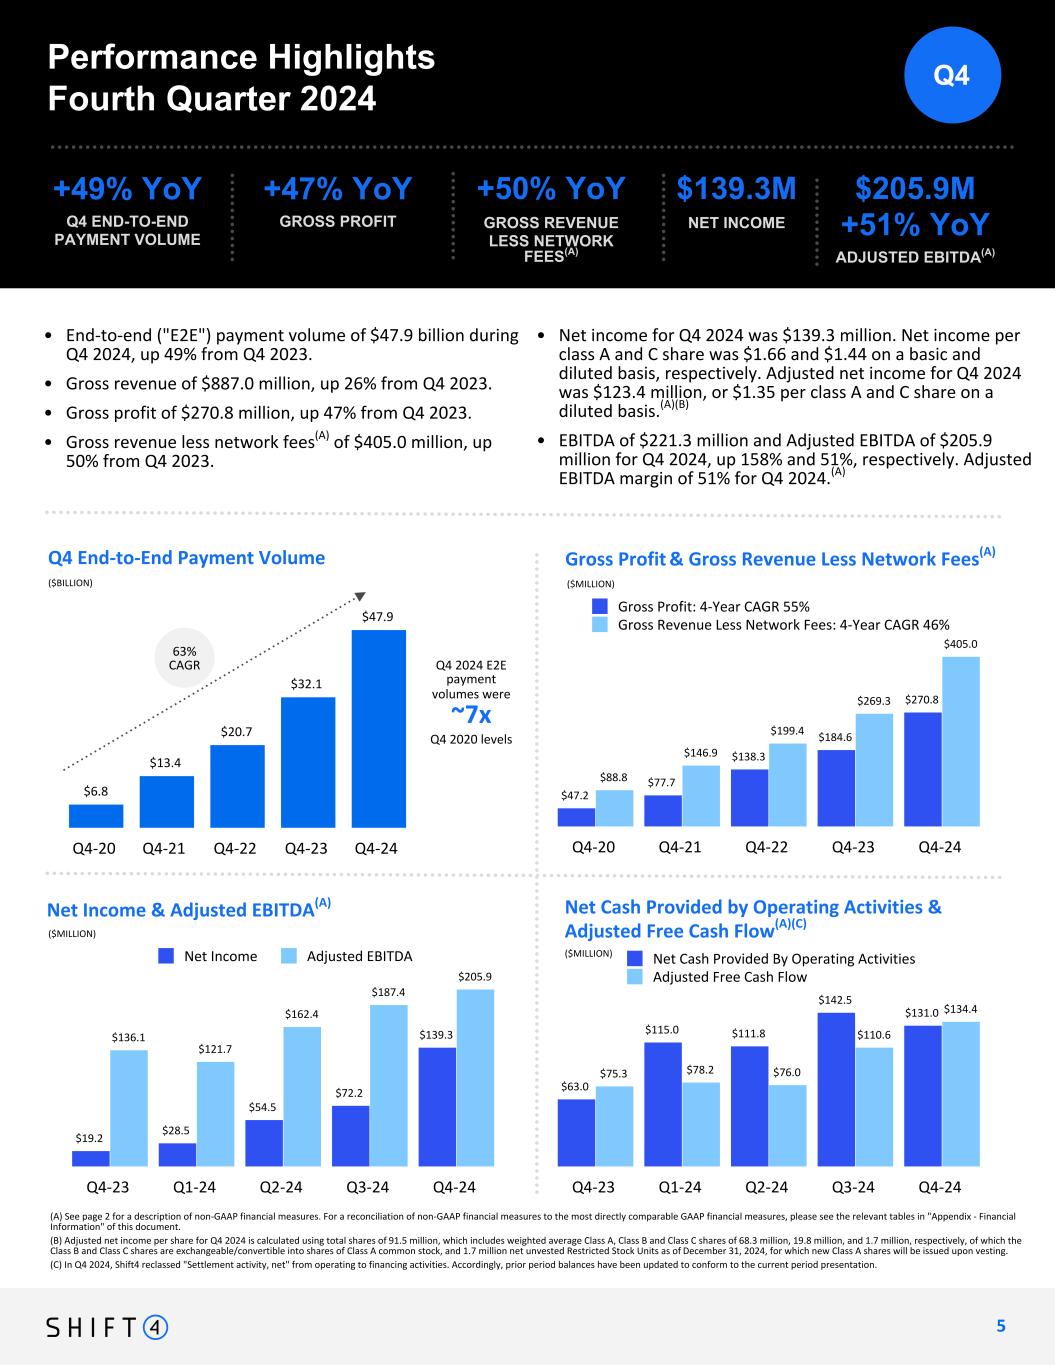
Q4 2024 E2E payment volumes were ~7x Q4 2020 levels $6.8 $13.4 $20.7 $32.1 $47.9 Q4-20 Q4-21 Q4-22 Q4-23 Q4-24 (A) See page 2 for a description of non-GAAP financial measures. For a reconciliation of non-GAAP financial measures to the most directly comparable GAAP financial measures, please see the relevant tables in "Appendix - Financial Information" of this document. (B) Adjusted net income per share for Q4 2024 is calculated using total shares of 91.5 million, which includes weighted average Class A, Class B and Class C shares of 68.3 million, 19.8 million, and 1.7 million, respectively, of which the Class B and Class C shares are exchangeable/convertible into shares of Class A common stock, and 1.7 million net unvested Restricted Stock Units as of December 31, 2024, for which new Class A shares will be issued upon vesting. (C) In Q4 2024, Shift4 reclassed "Settlement activity, net" from operating to financing activities. Accordingly, prior period balances have been updated to conform to the current period presentation. 5 Q4 End-to-End Payment Volume Gross Profit & Gross Revenue Less Network Fees(A) ($BILLION) Performance Highlights Fourth Quarter 2024 +49% YoY Q4 END-TO-END PAYMENT VOLUME 63% CAGR Net Income & Adjusted EBITDA(A) Net Cash Provided by Operating Activities & Adjusted Free Cash Flow(A)(C) ($MILLION) ($MILLION) ($MILLION) +47% YoY GROSS PROFIT $139.3M NET INCOME • $205.9M +51% YoY ADJUSTED EBITDA(A) +50% YoY GROSS REVENUE LESS NETWORK FEES(A) • End-to-end ("E2E") payment volume of $47.9 billion during Q4 2024, up 49% from Q4 2023. • Gross revenue of $887.0 million, up 26% from Q4 2023. • Gross profit of $270.8 million, up 47% from Q4 2023. • Gross revenue less network fees(A) of $405.0 million, up 50% from Q4 2023. • Net income for Q4 2024 was $139.3 million. Net income per class A and C share was $1.66 and $1.44 on a basic and diluted basis, respectively. Adjusted net income for Q4 2024 was $123.4 million, or $1.35 per class A and C share on a diluted basis.(A)(B) • EBITDA of $221.3 million and Adjusted EBITDA of $205.9 million for Q4 2024, up 158% and 51%, respectively. Adjusted EBITDA margin of 51% for Q4 2024.(A) Q4 5 $19.2 $28.5 $54.5 $72.2 $139.3$136.1 $121.7 $162.4 $187.4 $205.9 Net Income Adjusted EBITDA Q4-23 Q1-24 Q2-24 Q3-24 Q4-24 $47.2 $77.7 $138.3 $184.6 $270.8 $88.8 $146.9 $199.4 $269.3 $405.0 Gross Profit: 4-Year CAGR 55% Gross Revenue Less Network Fees: 4-Year CAGR 46% Q4-20 Q4-21 Q4-22 Q4-23 Q4-24 $63.0 $115.0 $111.8 $142.5 $131.0 $75.3 $78.2 $76.0 $110.6 $134.4 Net Cash Provided By Operating Activities Adjusted Free Cash Flow Q4-23 Q1-24 Q2-24 Q3-24 Q4-24
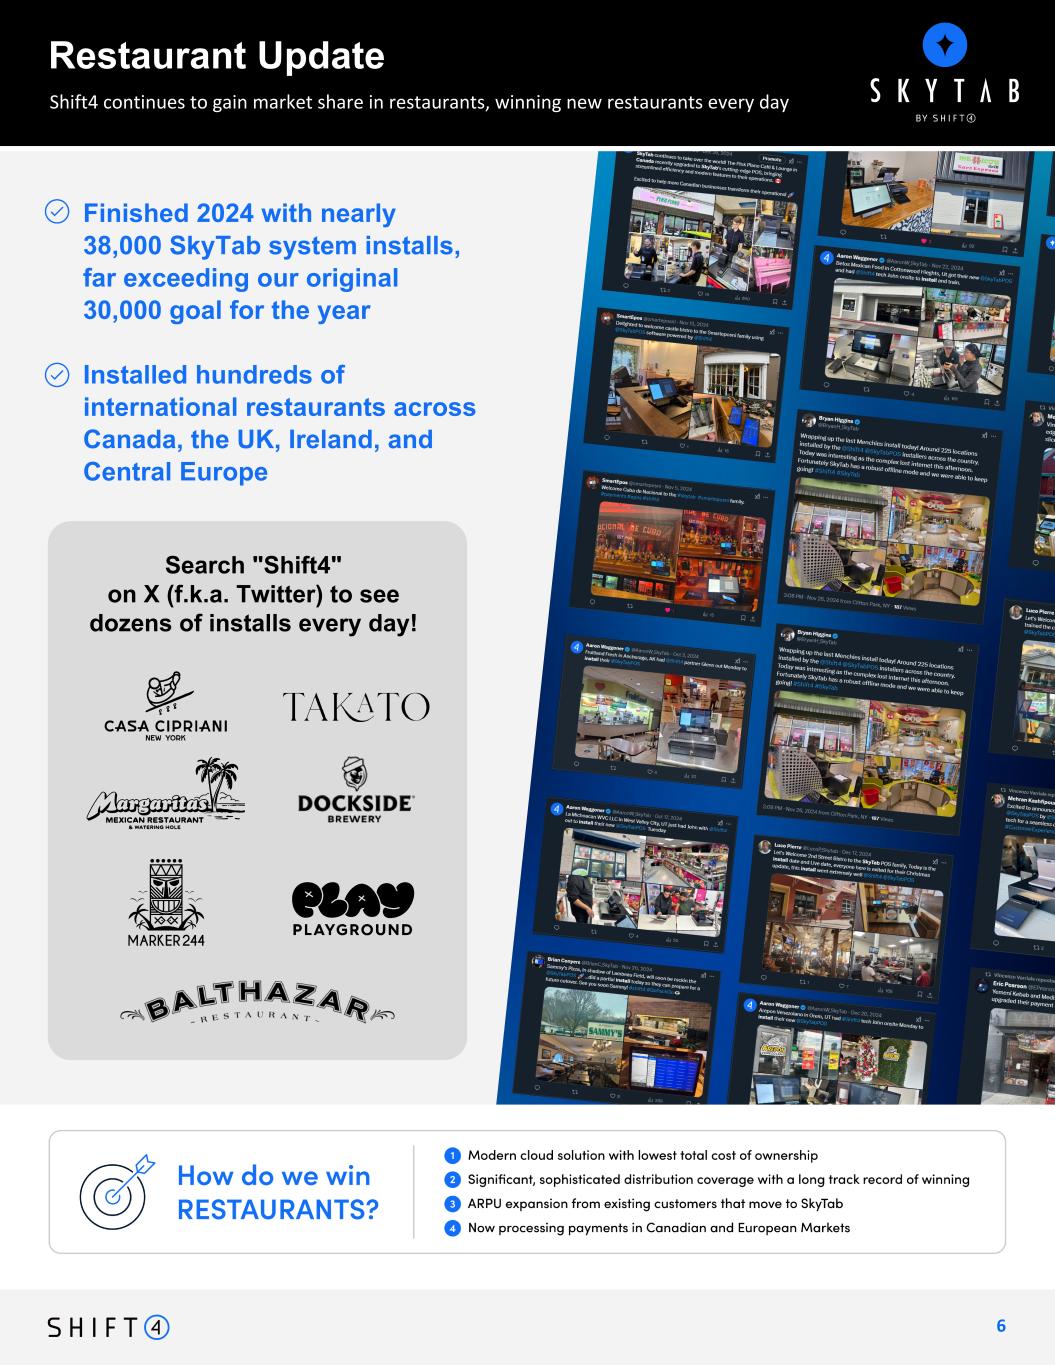
6 Over 55,000 Search "Shift4" on X (f.k.a. Twitter) to see dozens of installs every day! since coming out of beta, and on pace to exceed 35,000 installs in 2024 alone SkyTab installs Shift4 continues to gain market share in restaurants, winning new restaurants every day Restaurant Update LOGOS: Casa Cipriani Club** (highlight somehow Village Tavern Play PlayGround WATERMARC MANAGEMENT LLC Margaritas Takato Alamo Alehouse Gourmet Burgers Bar Dockside Brewery Marker 244 ++ Twitter screenshots BULLETS: – Finished 2024 with XXX SkyTab system installs – Installed XXX international restaurants across Canada, the UK, Ireland, and Central Europe – Reference X for daily updates Finished 2024 with nearly 38,000 SkyTab system installs, far exceeding our original 30,000 goal for the year Installed hundreds of international restaurants across Canada, the UK, Ireland, and Central Europe logos colornless / B&W
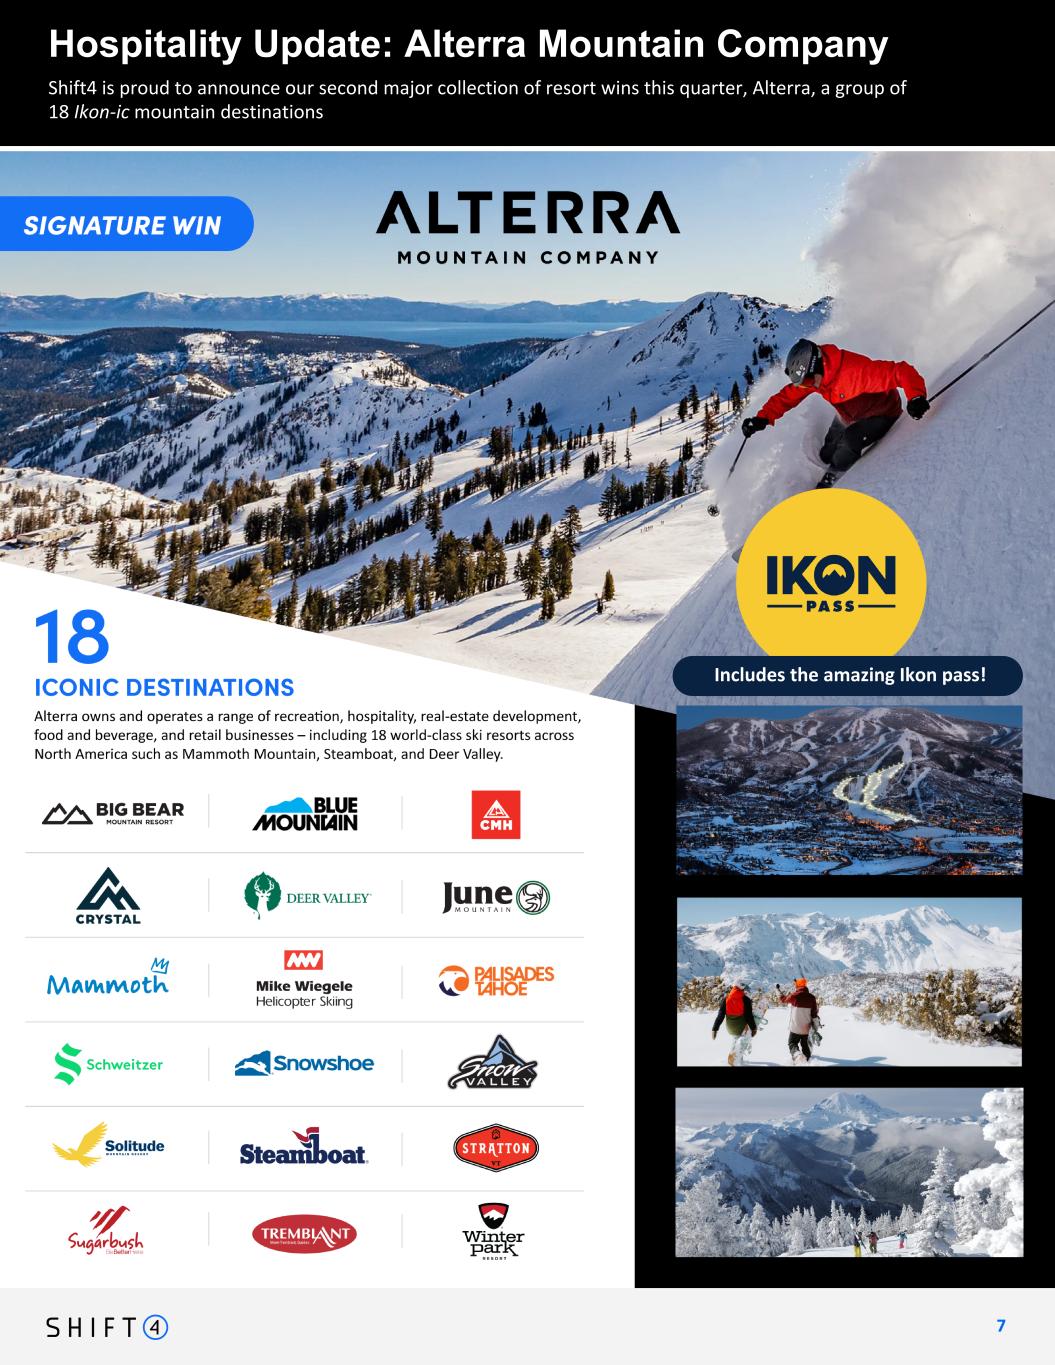
Continuing to expand market share in hospitality vertical Hospitality Update: Alterra Mountain Company 7 7 Shift4 is proud to announce our second major collection of resort wins this quarter, Alterra, a group of 18 Ikon-ic mountain destinations Includes the amazing Ikon pass!
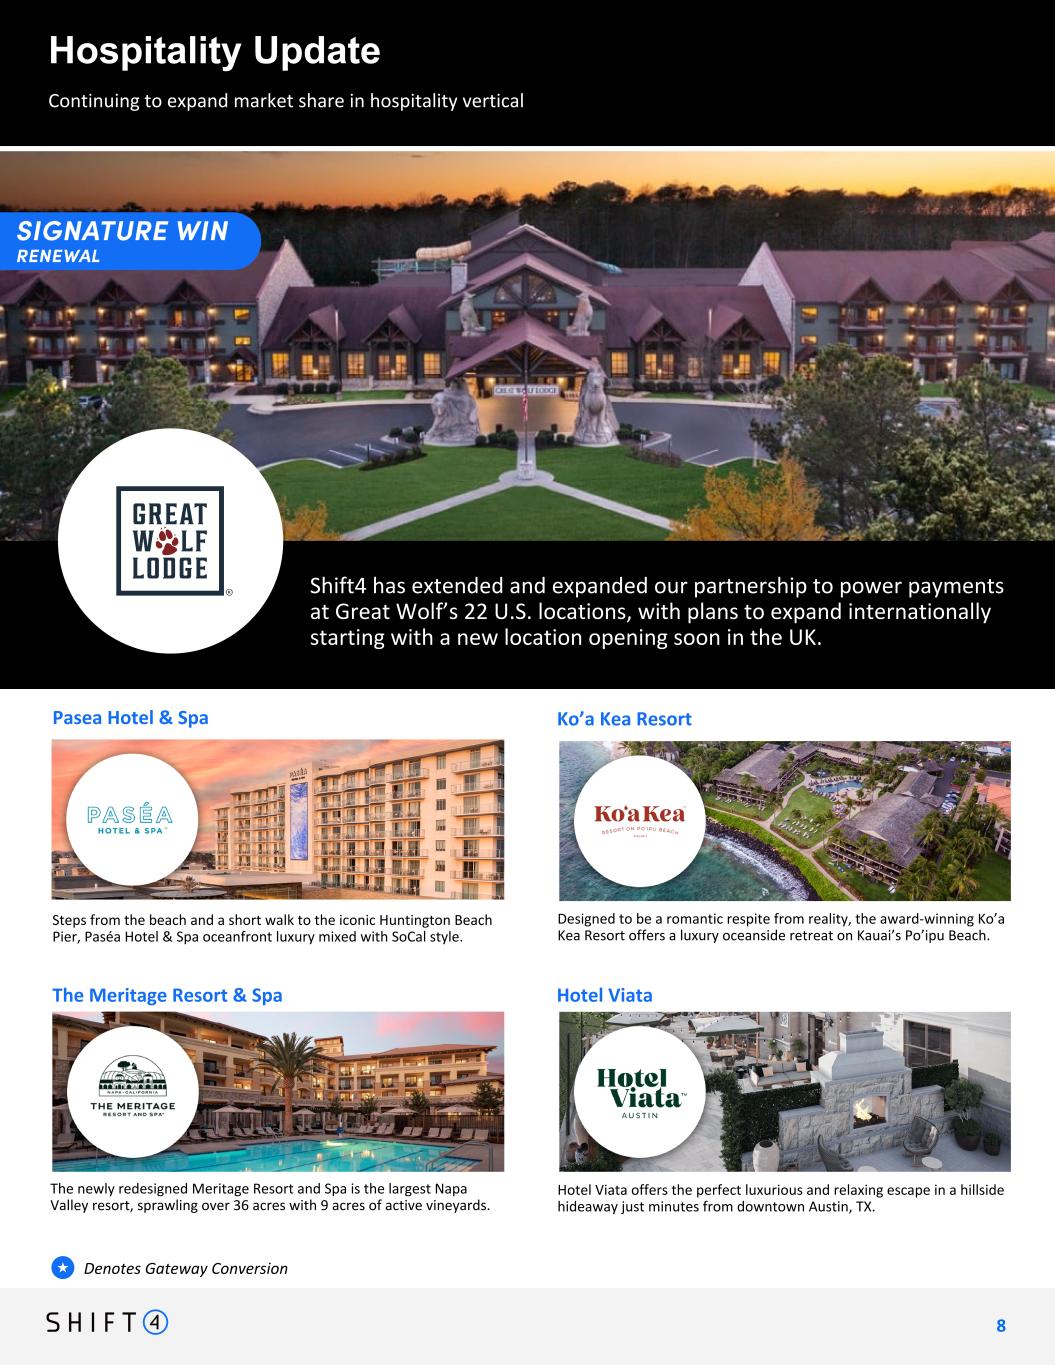
Continuing to expand market share in hospitality vertical Hospitality Update 8 8 Shift4 has extended and expanded our partnership to power payments at Great Wolf’s 22 U.S. locations, with plans to expand internationally starting with a new location opening soon in the UK. top half: auberge resorts (2 resorts: bishops lodge + auberge du soleil) - signature win - with more to come! bottom half: great wolf resorts — signature win - renewal! Designed to be a romantic respite from reality, the award-winning Ko’a Kea Resort offers a luxury oceanside retreat on Kauai’s Po’ipu Beach. Ko’a Kea Resort The newly redesigned Meritage Resort and Spa is the largest Napa Valley resort, sprawling over 36 acres with 9 acres of active vineyards. The Meritage Resort & Spa Hotel Viata offers the perfect luxurious and relaxing escape in a hillside hideaway just minutes from downtown Austin, TX. Hotel Viata Steps from the beach and a short walk to the iconic Huntington Beach Pier, Paséa Hotel & Spa oceanfront luxury mixed with SoCal style. Pasea Hotel & Spa Denotes Gateway Conversion★ Continuing to expand arket share in hospitality vertical WIP
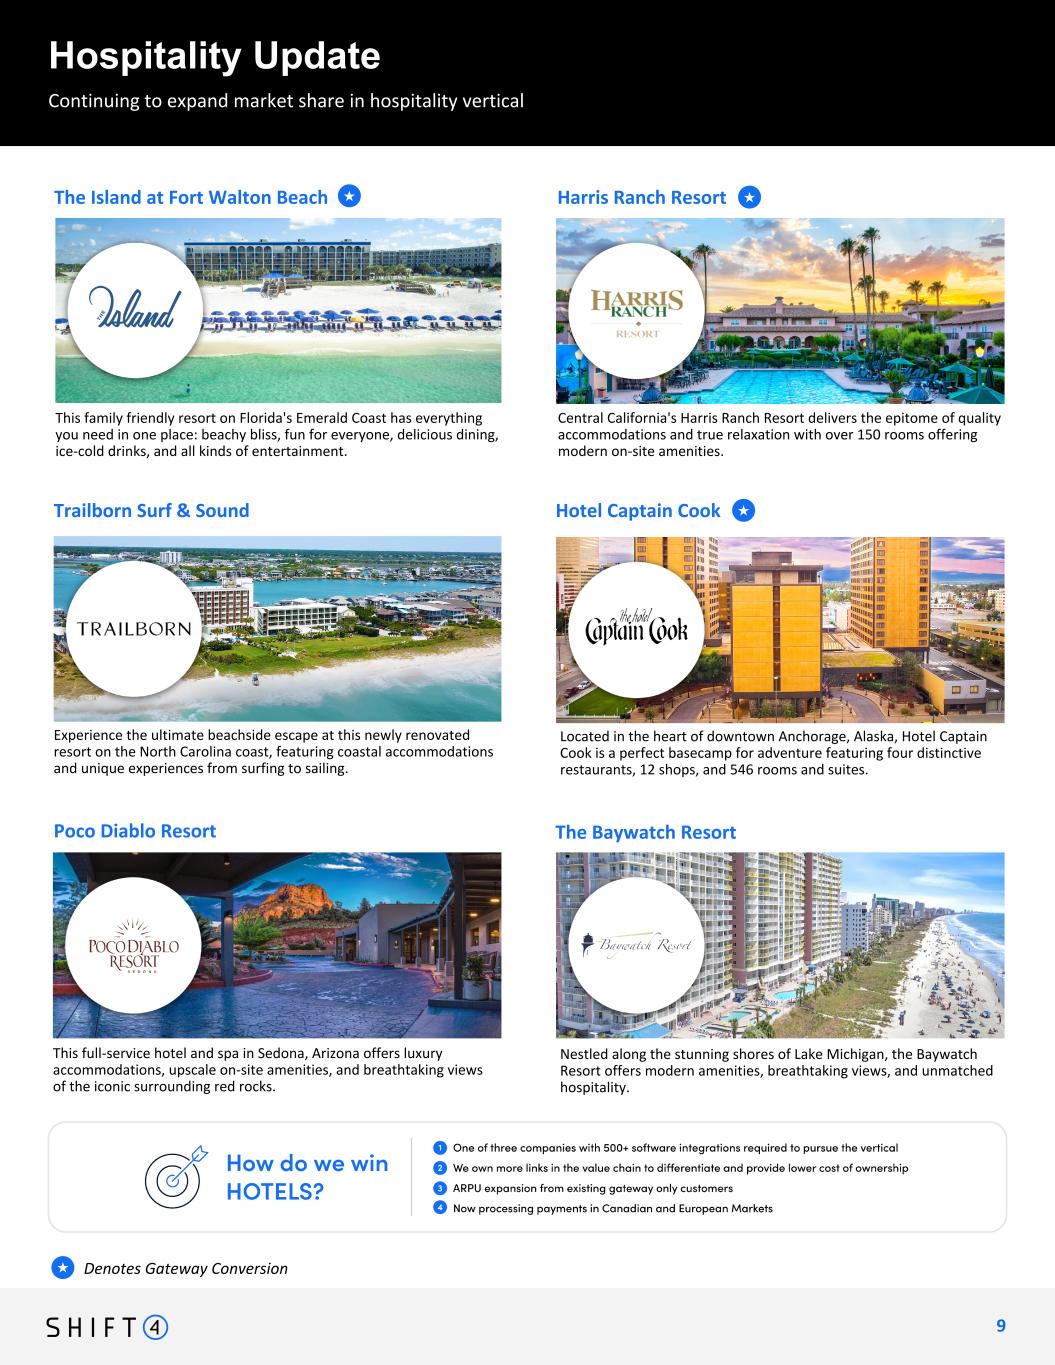
Continuing to expand market share in hospitality vertical Hospitality Update 9 9 Continuing to expand arket share in hospitality vertical Denotes Gateway Conversion★ Located in the heart of downtown Anchorage, Alaska, Hotel Captain Cook is a perfect basecamp for adventure featuring four distinctive restaurants, 12 shops, and 546 rooms and suites. Poco Diablo Resort Nestled along the stunning shores of Lake Michigan, the Baywatch Resort offers modern amenities, breathtaking views, and unmatched hospitality. The Baywatch Resort Experience the ultimate beachside escape at this newly renovated resort on the North Carolina coast, featuring coastal accommodations and unique experiences from surfing to sailing. Hotel Captain CookTrailborn Surf & Sound Central California's Harris Ranch Resort delivers the epitome of quality accommodations and true relaxation with over 150 rooms offering modern on-site amenities. This family friendly resort on Florida's Emerald Coast has everything you need in one place: beachy bliss, fun for everyone, delicious dining, ice-cold drinks, and all kinds of entertainment. Harris Ranch ResortThe Island at Fort Walton Beach This full-service hotel and spa in Sedona, Arizona offers luxury accommodations, upscale on-site amenities, and breathtaking views of the iconic surrounding red rocks. The Island Resort at Fort Walton Beach - GW Conversion Harris Ranch Resort - GW Conversion Trailborn Surf & Sound Hotel Captain Cook - GW Conversion Poco Diablo Resort -- The Baywatch Resort -- ★ ★ ★
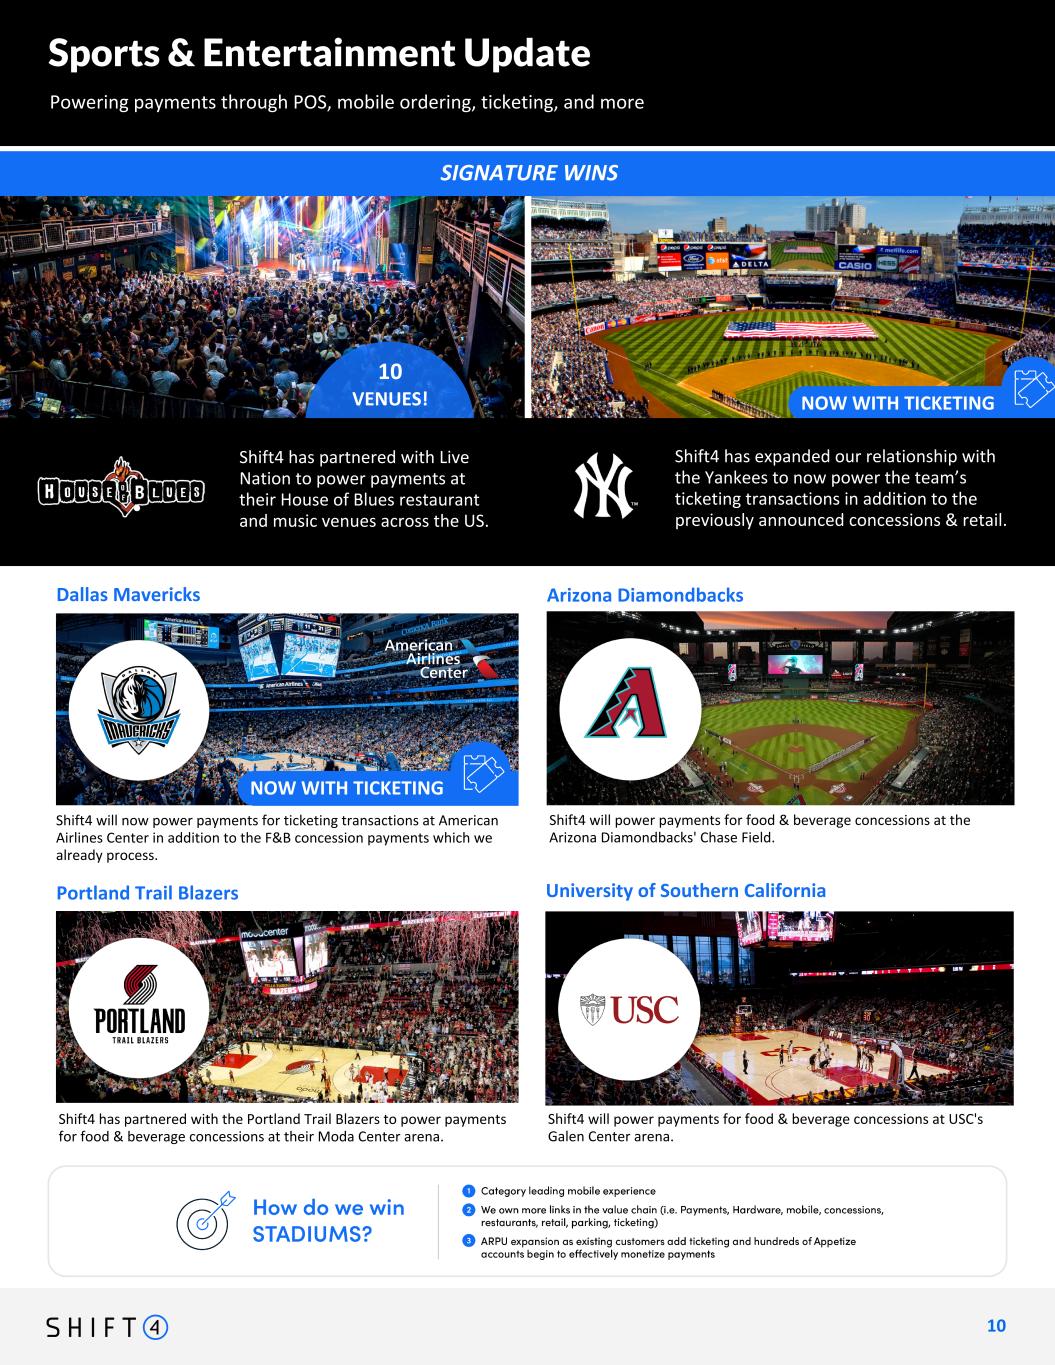
American Airlines Center Chicago White Sox SIGNATURE WINS 10 VENUES! Sports & Entertainment Update Powering payments through POS, mobile ordering, ticketing, and more 1 0 10 University of Southern California Arizona Diamondbacks Shift4 has partnered with the Portland Trail Blazers to power payments for food & beverage concessions at their Moda Center arena. Dallas Mavericks Portland Trail Blazers Shift4 will power payments for food & beverage concessions at USC's Galen Center arena. NOW WITH TICKETING Shift4 will now power payments for ticketing transactions at American Airlines Center in addition to the F&B concession payments which we already process. highlight: house of blues (somewhere splash "10 venues!") four others: ny yankees "now with ticketing!" arizona diamondbacks moda center (portland trail blazers) galen center (USC) Shift4 will power payments for food & beverage concessions at the Arizona Diamondbacks' Chase Field. NOW WITH TICKETING Shift4 has expanded our relationship with the Yankees to now power the team’s ticketing transactions in addition to the previously announced concessions & retail. Shift4 has partnered with Live Nation to power payments at their House of Blues restaurant and music venues across the US.
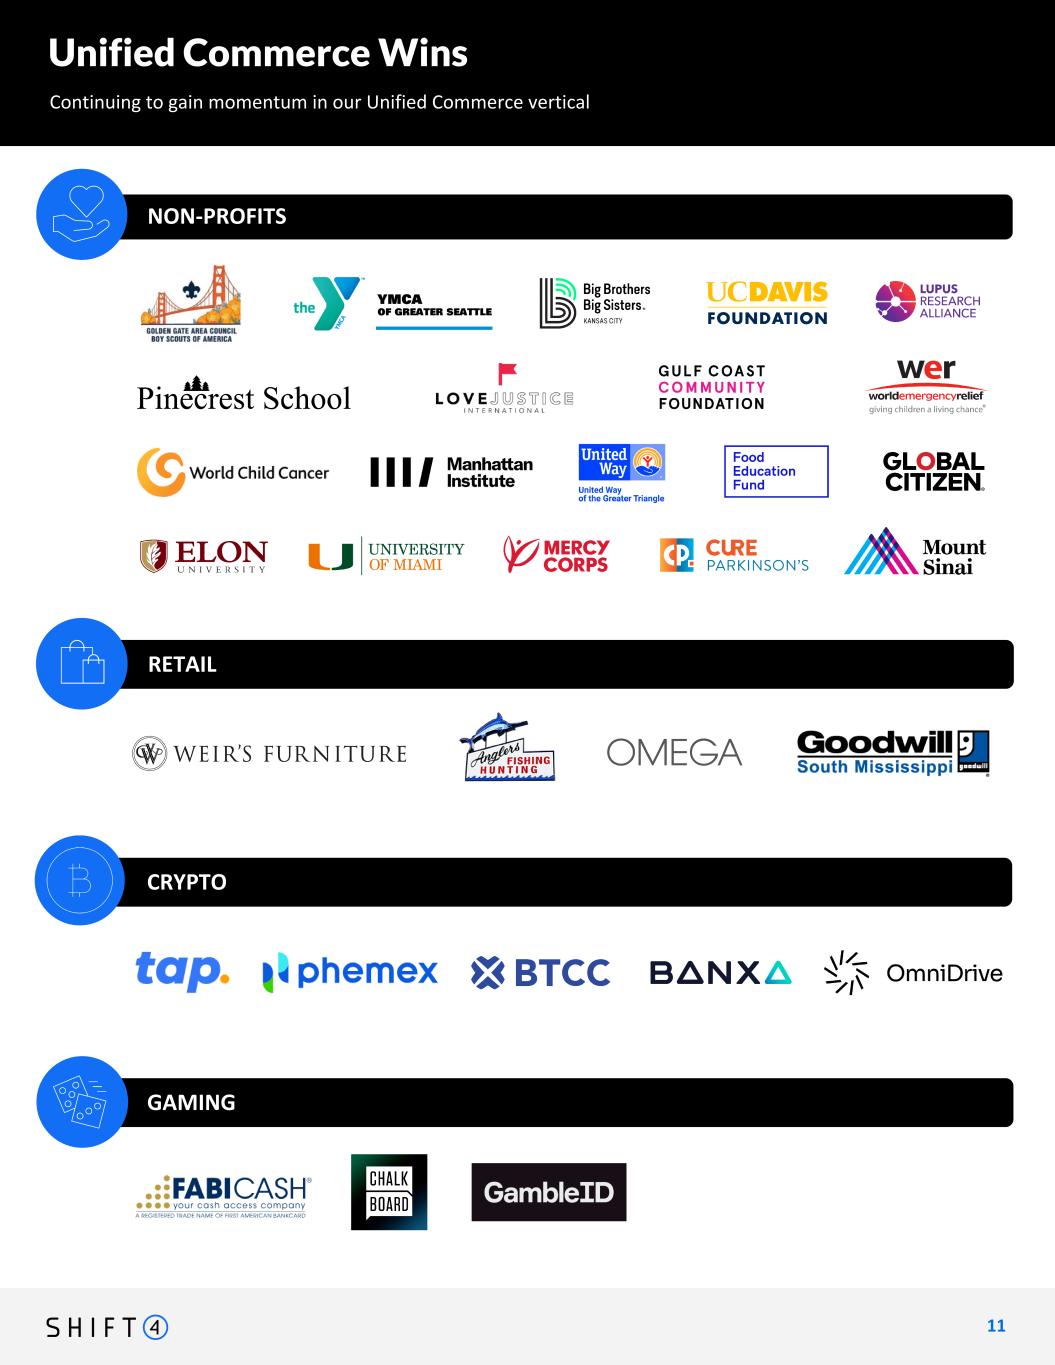
Unified Commerce Wins Continuing to gain momentum in our Unified Commerce vertical 1 1 11 NON-PROFITS CRYPTO GAMING RETAIL We expect to be live in all 24 sportsbook locations by year end Retail: Weir's Furniture Anglers Sports Center Omega Institute for Holistic Studies Goodwill of S Mississippi Gaming: FABI Cash America Inc. Chalkboard Fantasy Sports GambleID Non-Profits: (have 70+ to choose from - leave space for ~10-15 logos here Crypto: TAP Global, Phemex, BTCC, Banxa, Omnidrive WIP Boy Scouts of America - Golden Gate Area Council YMCA of Greater Seattle Big Brothers Big Sisters Kansas City The UC Davis Foundation Pine Crest School Love Justice International Gulf Coast Community Foundation World Emergency Relief Lupus Research Alliance World Child Cancer Manhattan Institute for Policy Research United Way of the Greater Triangle Food Education Fund Elon University University of Miami Mercy Corps Europe Cure Parkinson's Mount Sinai Medical Center Global Citizen
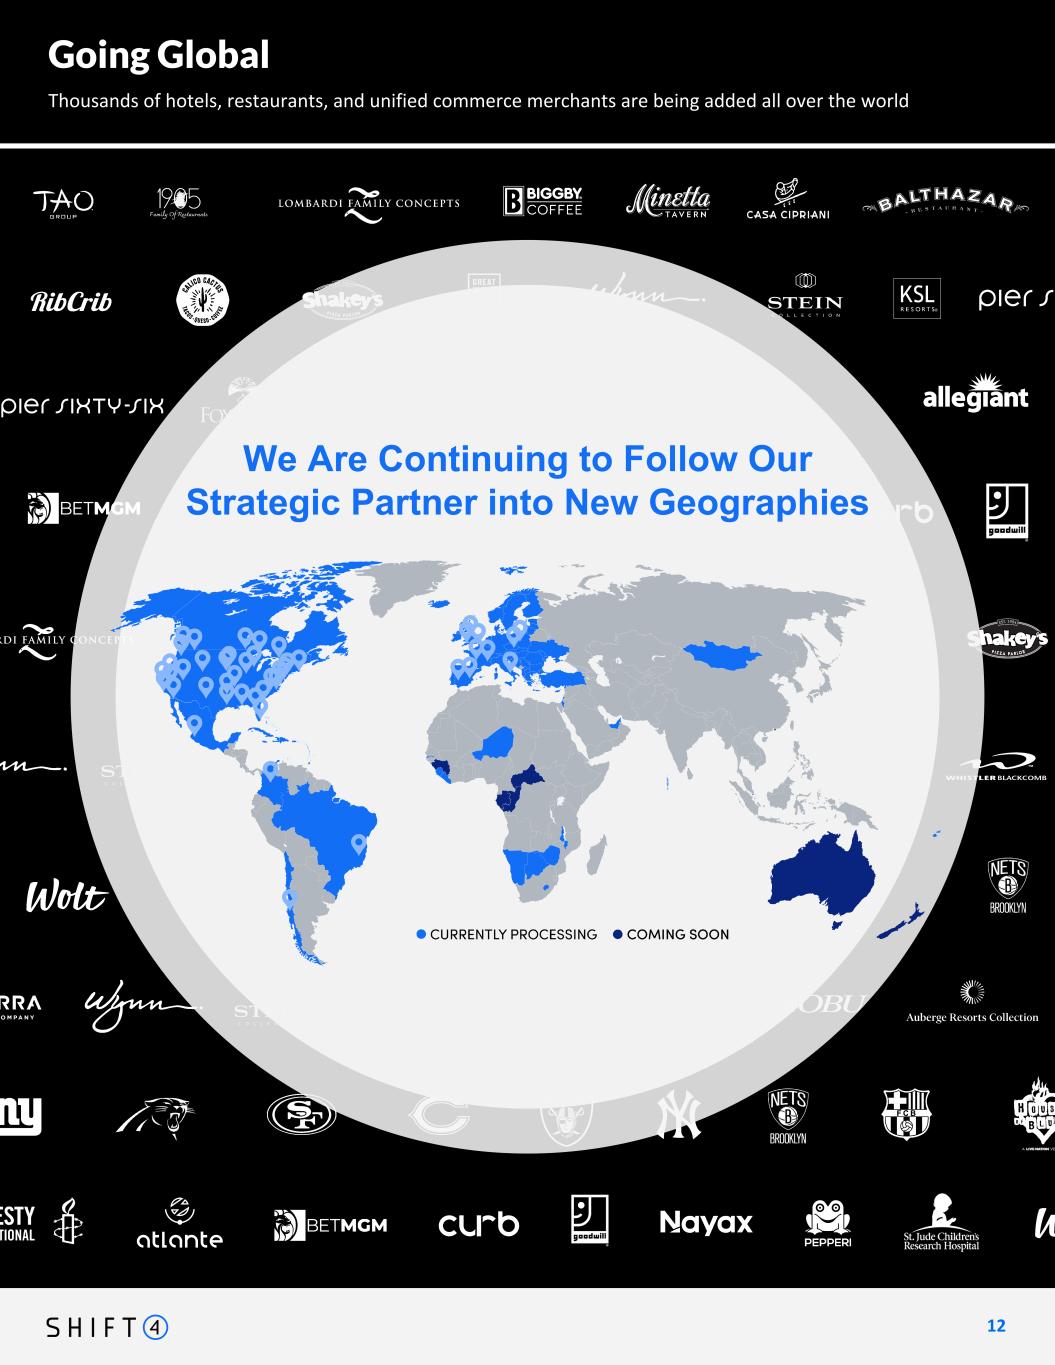
Shift4 continues to move Boldly Forward towards becoming a truly global company 1 2 12 Magnuson is a global network of individually owned hotels, connecting independent hotel properties with travelers across all destinations. Now Live Now Processing in 2024 Notable International Wins in Our Key Verticals Xolvis digitizes customer communication and online payments, using software for auto workshops, craftsmen, bicycle workshops and MRO. Klass Wagen is a national car rentals leader for leisure travel, active in Romania and Hungary. Part of the Royal British Legion, Poppy Appeal provides support to the UK Armed forces in 6 key areas: financial support, advice, employment, mobility, housing and mental health. An Online Travel Agency that has introduced a new, personalized, and dynamic, holiday packages booking experience. The RNLI, a charity based in Poole England, is the largest lifeboat services operating around the coasts of the United Kingdom, the Republic of Ireland, the Channel Islands and the Isle of Man. Coming Soon One of Winnipeg's architectural landmarks, the Fort Garry Hotel, Spa and Conference Centre is second to none in service, luxury, and location. CURB - UK WOLT - EURO CONTINENTAL NOBU - CANADA (TORONTO) CASA CIPRIANI - NEW YORK GREAT WOLF LODGE - MIDWEST ISH AUBREGE - WEST COAST Going Global We Are Continuing to Follow Our Strategic Partner into New Geographies Thousands of hotels, restaurants, and unified commerce merchants are being added all over the world
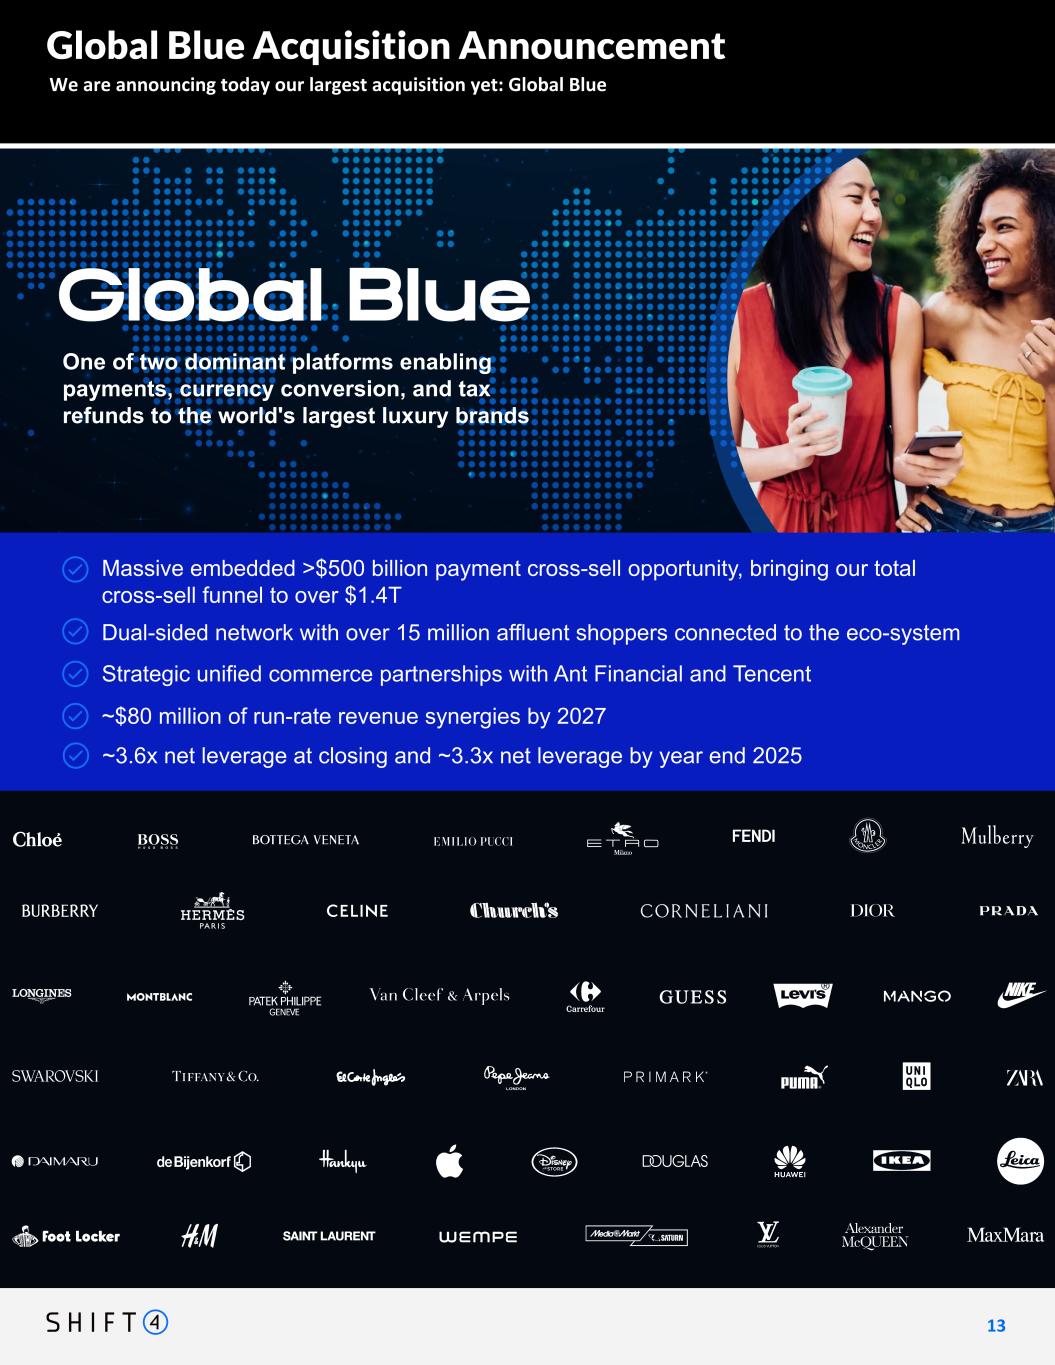
We are announcing today our largest acquisition yet: Global Blue 1 3 13 Massive embedded >$500 billion payment cross-sell opportunity Dual-sided network with over 15 million affluent shoppers connected to the eco-system ~$80 million of run- rate revenue synergies by 2027 [Strategic e-commerce partnerships with Ant Financial and Tencent] Global Blue Acquisition Announcement Shift4 Playbook/Key Points: One of two dominant platforms enabling payments, currency conversion, and tax refunds to the world's largest luxury brands Massive embedded >$500 billion payment cross-sell opportunity, bringing our total cross-sell funnel to over $1.4T Dual-sided network with over 15 million affluent shoppers connected to the eco-system ~$80 million of run-rate revenue synergies by 2027 Strategic unified commerce partnerships with Ant Financial and Tencent ~3.6x net leverage at closing and ~3.3x net leverage by year end 2025
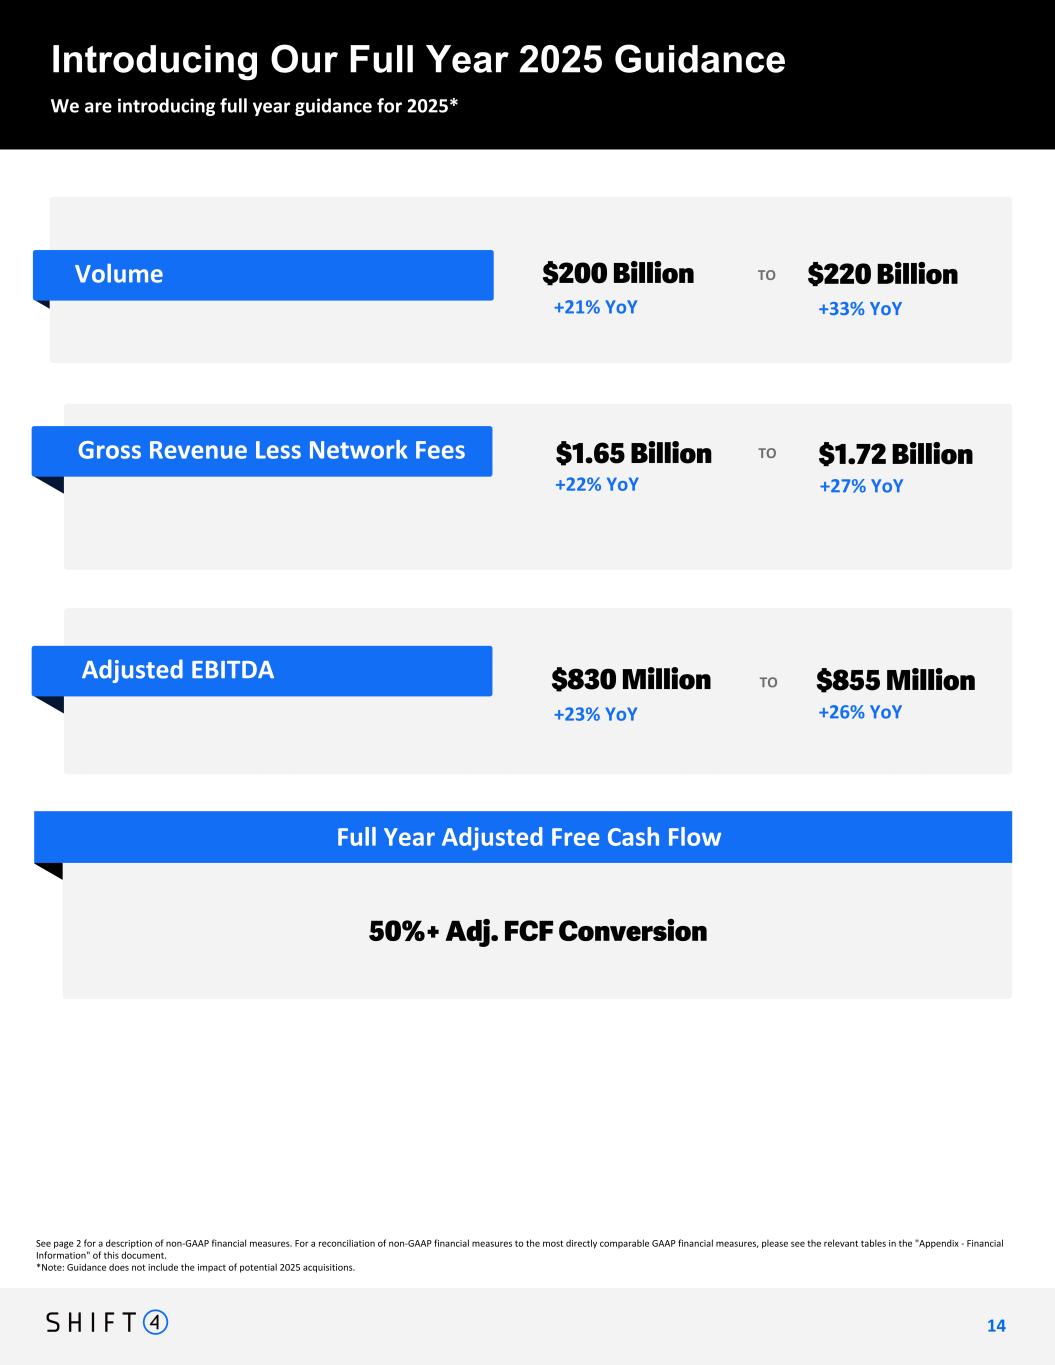
See page 2 for a description of non-GAAP financial measures. For a reconciliation of non-GAAP financial measures to the most directly comparable GAAP financial measures, please see the relevant tables in the "Appendix - Financial Information" of this document. *Note: Guidance does not include the impact of potential 2025 acquisitions. Introducing Our Full Year 2025 Guidance We are introducing full year guidance for 2025* 1 4 14 $1.65 Billion +22% YoY +27% YoY $1.72 BillionGross Revenue Less Network Fees Full Year Adjusted Free Cash Flow $200 Billion $220 BillionVolume $830 Million +23% YoY +26% YoY $855 MillionAdjusted EBITDA TO TO TO FY 2025 Guidance 50%+ Adj. FCF Conversion $167 Billion +53% YoY +XX% YoY $172 Billion $1.35 Billion +44% YoY +XX% YoY $1.38 Billion TO TO End-to-End Payment Volume Increasing our GRLNF Range Gross Revenue Less Network Fees TO $662 Million +XX% YoY +XX% YoY $689 Million Increasing our Adjusted EBITDA range Adjusted EBITDA Tightening our Adjusted FCF Conversion Adjusted Free Cash Flow from $167 Billion to $175 Billion from $640 Million to $675 Million from 60%+Adj FCF Conversion 58%+ Adj. FCF Conversion Tightening the high end of our End-to-End Payment Volume range from $1.33 Billion to $1.35 Billion need space for these metrics: VOLUME - 200B - 220B GRLNF 1.650B - 1.720B EBITDA 830M - 855M FCF greater than 50% organic greater than 20% Full Year Organic Growth 20%+ Organic Growth +21% YoY +33% YoY
Appendix - Financial Information 15
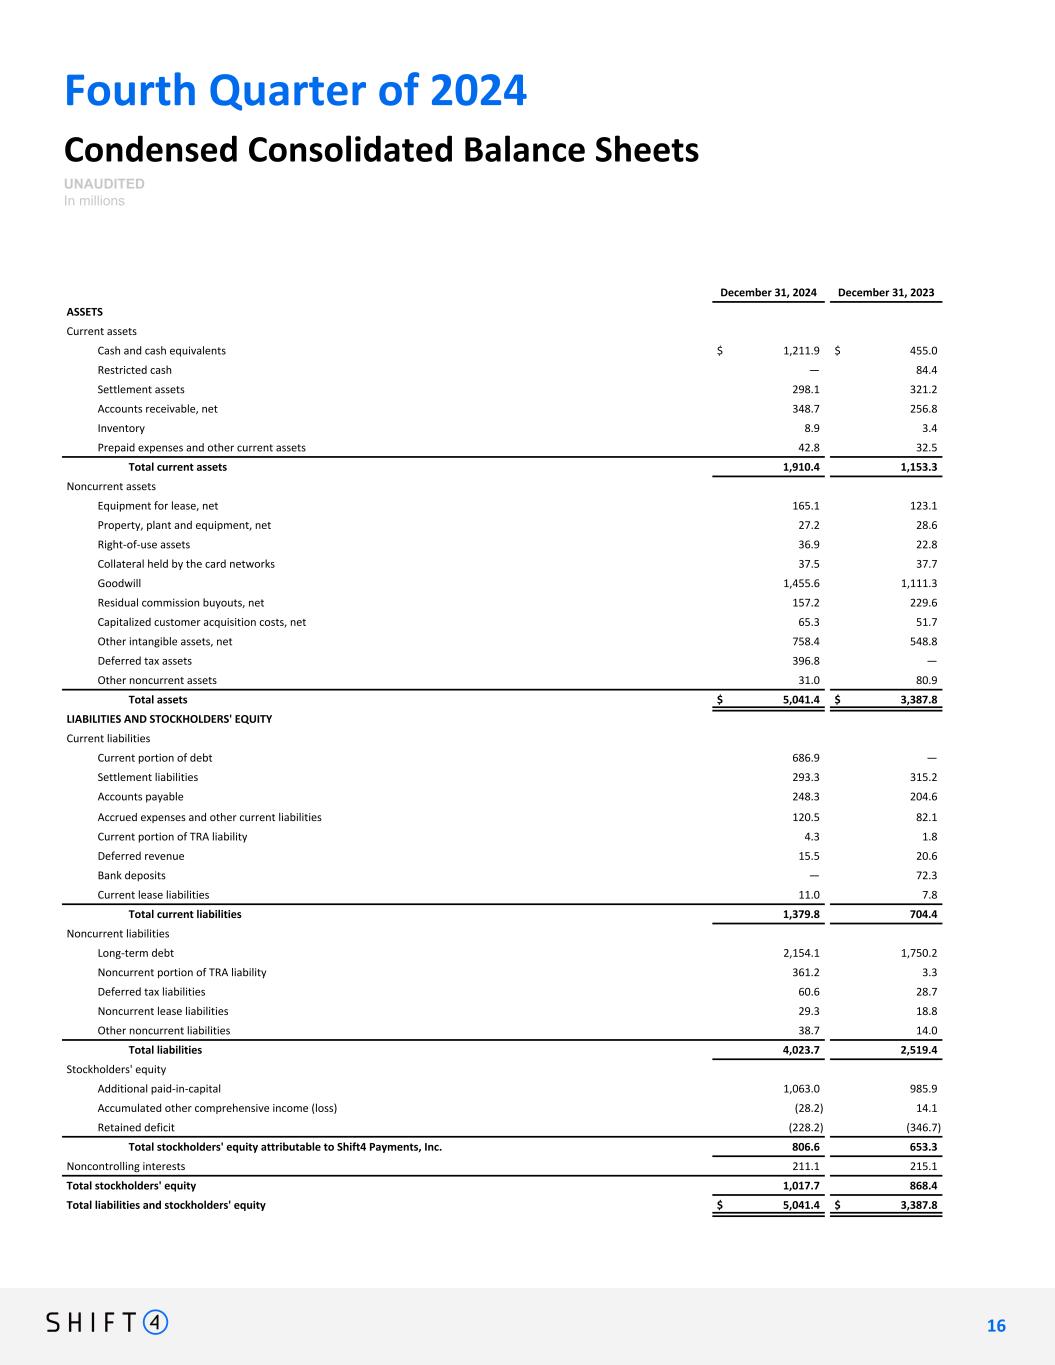
Fourth Quarter of 2024 Condensed Consolidated Balance Sheets UNAUDITED In millions December 31, 2024 December 31, 2023 ASSETS Current assets Cash and cash equivalents $ 1,211.9 $ 455.0 Restricted cash — 84.4 Settlement assets 298.1 321.2 Accounts receivable, net 348.7 256.8 Inventory 8.9 3.4 Prepaid expenses and other current assets 42.8 32.5 Total current assets 1,910.4 1,153.3 Noncurrent assets Equipment for lease, net 165.1 123.1 Property, plant and equipment, net 27.2 28.6 Right-of-use assets 36.9 22.8 Collateral held by the card networks 37.5 37.7 Goodwill 1,455.6 1,111.3 Residual commission buyouts, net 157.2 229.6 Capitalized customer acquisition costs, net 65.3 51.7 Other intangible assets, net 758.4 548.8 Deferred tax assets 396.8 — Other noncurrent assets 31.0 80.9 Total assets $ 5,041.4 $ 3,387.8 LIABILITIES AND STOCKHOLDERS' EQUITY Current liabilities Current portion of debt 686.9 — Settlement liabilities 293.3 315.2 Accounts payable 248.3 204.6 Accrued expenses and other current liabilities 120.5 82.1 Current portion of TRA liability 4.3 1.8 Deferred revenue 15.5 20.6 Bank deposits — 72.3 Current lease liabilities 11.0 7.8 Total current liabilities 1,379.8 704.4 Noncurrent liabilities Long-term debt 2,154.1 1,750.2 Noncurrent portion of TRA liability 361.2 3.3 Deferred tax liabilities 60.6 28.7 Noncurrent lease liabilities 29.3 18.8 Other noncurrent liabilities 38.7 14.0 Total liabilities 4,023.7 2,519.4 Stockholders' equity Additional paid-in-capital 1,063.0 985.9 Accumulated other comprehensive income (loss) (28.2) 14.1 Retained deficit (228.2) (346.7) Total stockholders' equity attributable to Shift4 Payments, Inc. 806.6 653.3 Noncontrolling interests 211.1 215.1 Total stockholders' equity 1,017.7 868.4 Total liabilities and stockholders' equity $ 5,041.4 $ 3,387.8 1 6 16
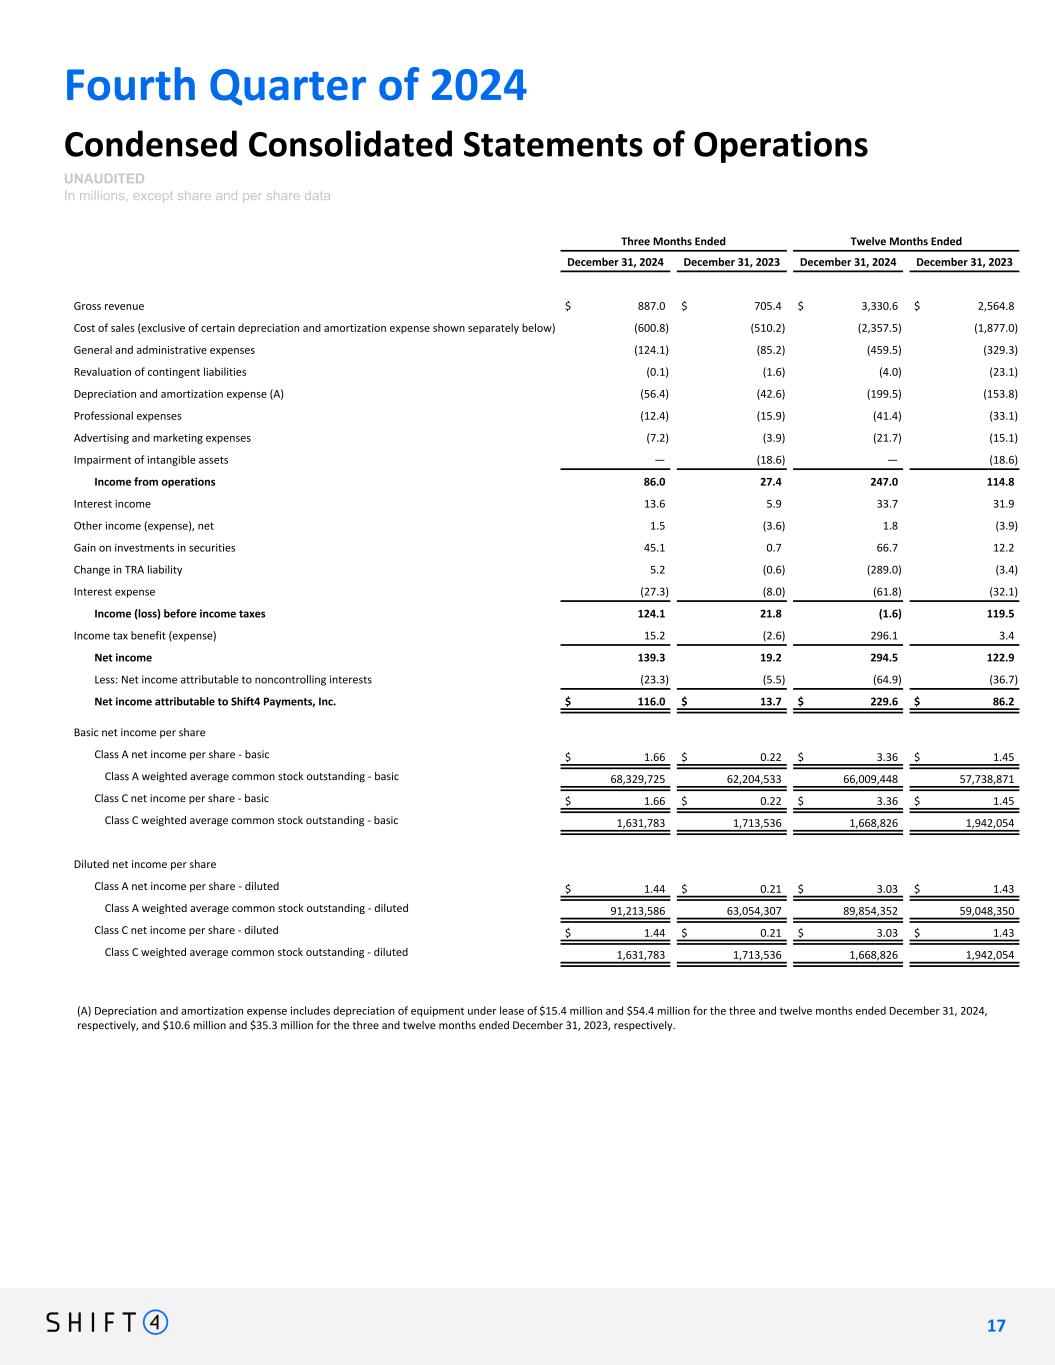
Fourth Quarter of 2024 Condensed Consolidated Statements of Operations UNAUDITED In millions, except share and per share data Three Months Ended Twelve Months Ended December 31, 2024 December 31, 2023 December 31, 2024 December 31, 2023 Gross revenue $ 887.0 $ 705.4 $ 3,330.6 $ 2,564.8 Cost of sales (exclusive of certain depreciation and amortization expense shown separately below) (600.8) (510.2) (2,357.5) (1,877.0) General and administrative expenses (124.1) (85.2) (459.5) (329.3) Revaluation of contingent liabilities (0.1) (1.6) (4.0) (23.1) Depreciation and amortization expense (A) (56.4) (42.6) (199.5) (153.8) Professional expenses (12.4) (15.9) (41.4) (33.1) Advertising and marketing expenses (7.2) (3.9) (21.7) (15.1) Impairment of intangible assets — (18.6) — (18.6) Income from operations 86.0 27.4 247.0 114.8 Interest income 13.6 5.9 33.7 31.9 Other income (expense), net 1.5 (3.6) 1.8 (3.9) Gain on investments in securities 45.1 0.7 66.7 12.2 Change in TRA liability 5.2 (0.6) (289.0) (3.4) Interest expense (27.3) (8.0) (61.8) (32.1) Income (loss) before income taxes 124.1 21.8 (1.6) 119.5 Income tax benefit (expense) 15.2 (2.6) 296.1 3.4 Net income 139.3 19.2 294.5 122.9 Less: Net income attributable to noncontrolling interests (23.3) (5.5) (64.9) (36.7) Net income attributable to Shift4 Payments, Inc. $ 116.0 $ 13.7 $ 229.6 $ 86.2 Basic net income per share Class A net income per share - basic $ 1.66 $ 0.22 $ 3.36 $ 1.45 Class A weighted average common stock outstanding - basic 68,329,725 62,204,533 66,009,448 57,738,871 Class C net income per share - basic $ 1.66 $ 0.22 $ 3.36 $ 1.45 Class C weighted average common stock outstanding - basic 1,631,783 1,713,536 1,668,826 1,942,054 Diluted net income per share Class A net income per share - diluted $ 1.44 $ 0.21 $ 3.03 $ 1.43 Class A weighted average common stock outstanding - diluted 91,213,586 63,054,307 89,854,352 59,048,350 Class C net income per share - diluted $ 1.44 $ 0.21 $ 3.03 $ 1.43 Class C weighted average common stock outstanding - diluted 1,631,783 1,713,536 1,668,826 1,942,054 (A) Depreciation and amortization expense includes depreciation of equipment under lease of $15.4 million and $54.4 million for the three and twelve months ended December 31, 2024, respectively, and $10.6 million and $35.3 million for the three and twelve months ended December 31, 2023, respectively. 1 7 17
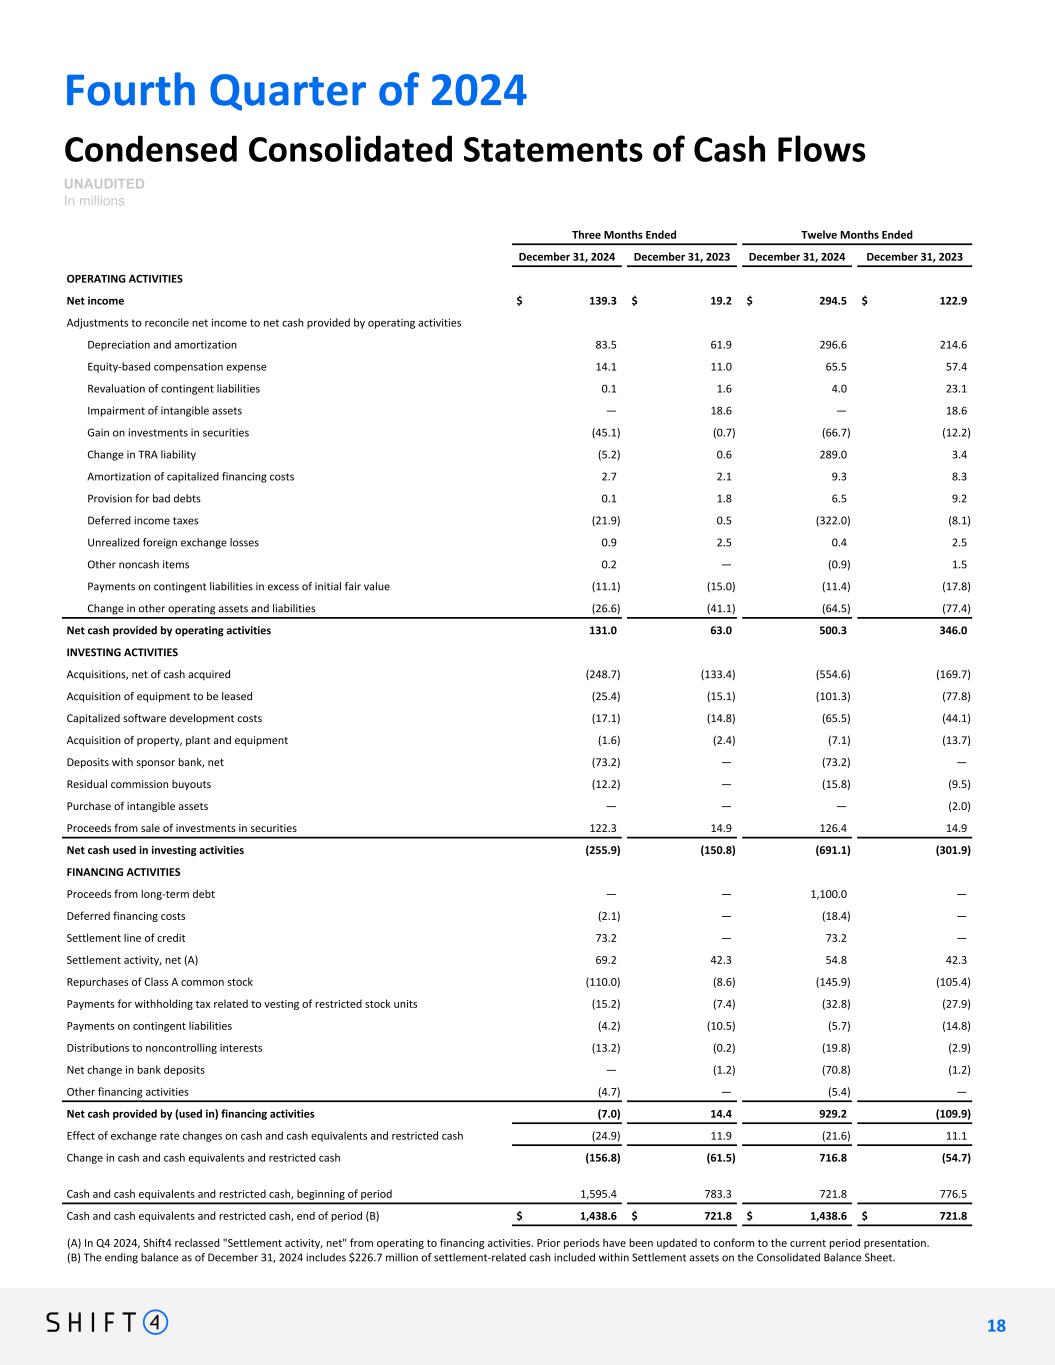
Fourth Quarter of 2024 Condensed Consolidated Statements of Cash Flows UNAUDITED In millions Three Months Ended Twelve Months Ended December 31, 2024 December 31, 2023 December 31, 2024 December 31, 2023 OPERATING ACTIVITIES Net income $ 139.3 $ 19.2 $ 294.5 $ 122.9 Adjustments to reconcile net income to net cash provided by operating activities Depreciation and amortization 83.5 61.9 296.6 214.6 Equity-based compensation expense 14.1 11.0 65.5 57.4 Revaluation of contingent liabilities 0.1 1.6 4.0 23.1 Impairment of intangible assets — 18.6 — 18.6 Gain on investments in securities (45.1) (0.7) (66.7) (12.2) Change in TRA liability (5.2) 0.6 289.0 3.4 Amortization of capitalized financing costs 2.7 2.1 9.3 8.3 Provision for bad debts 0.1 1.8 6.5 9.2 Deferred income taxes (21.9) 0.5 (322.0) (8.1) Unrealized foreign exchange losses 0.9 2.5 0.4 2.5 Other noncash items 0.2 — (0.9) 1.5 Payments on contingent liabilities in excess of initial fair value (11.1) (15.0) (11.4) (17.8) Change in other operating assets and liabilities (26.6) (41.1) (64.5) (77.4) Net cash provided by operating activities 131.0 63.0 500.3 346.0 INVESTING ACTIVITIES Acquisitions, net of cash acquired (248.7) (133.4) (554.6) (169.7) Acquisition of equipment to be leased (25.4) (15.1) (101.3) (77.8) Capitalized software development costs (17.1) (14.8) (65.5) (44.1) Acquisition of property, plant and equipment (1.6) (2.4) (7.1) (13.7) Deposits with sponsor bank, net (73.2) — (73.2) — Residual commission buyouts (12.2) — (15.8) (9.5) Purchase of intangible assets — — — (2.0) Proceeds from sale of investments in securities 122.3 14.9 126.4 14.9 Net cash used in investing activities (255.9) (150.8) (691.1) (301.9) FINANCING ACTIVITIES Proceeds from long-term debt — — 1,100.0 — Deferred financing costs (2.1) — (18.4) — Settlement line of credit 73.2 — 73.2 — Settlement activity, net (A) 69.2 42.3 54.8 42.3 Repurchases of Class A common stock (110.0) (8.6) (145.9) (105.4) Payments for withholding tax related to vesting of restricted stock units (15.2) (7.4) (32.8) (27.9) Payments on contingent liabilities (4.2) (10.5) (5.7) (14.8) Distributions to noncontrolling interests (13.2) (0.2) (19.8) (2.9) Net change in bank deposits — (1.2) (70.8) (1.2) Other financing activities (4.7) — (5.4) — Net cash provided by (used in) financing activities (7.0) 14.4 929.2 (109.9) Effect of exchange rate changes on cash and cash equivalents and restricted cash (24.9) 11.9 (21.6) 11.1 Change in cash and cash equivalents and restricted cash (156.8) (61.5) 716.8 (54.7) Cash and cash equivalents and restricted cash, beginning of period 1,595.4 783.3 721.8 776.5 Cash and cash equivalents and restricted cash, end of period (B) $ 1,438.6 $ 721.8 $ 1,438.6 $ 721.8 1 8 18 (A) In Q4 2024, Shift4 reclassed "Settlement activity, net" from operating to financing activities. Prior periods have been updated to conform to the current period presentation. (B) The ending balance as of December 31, 2024 includes $226.7 million of settlement-related cash included within Settlement assets on the Consolidated Balance Sheet.
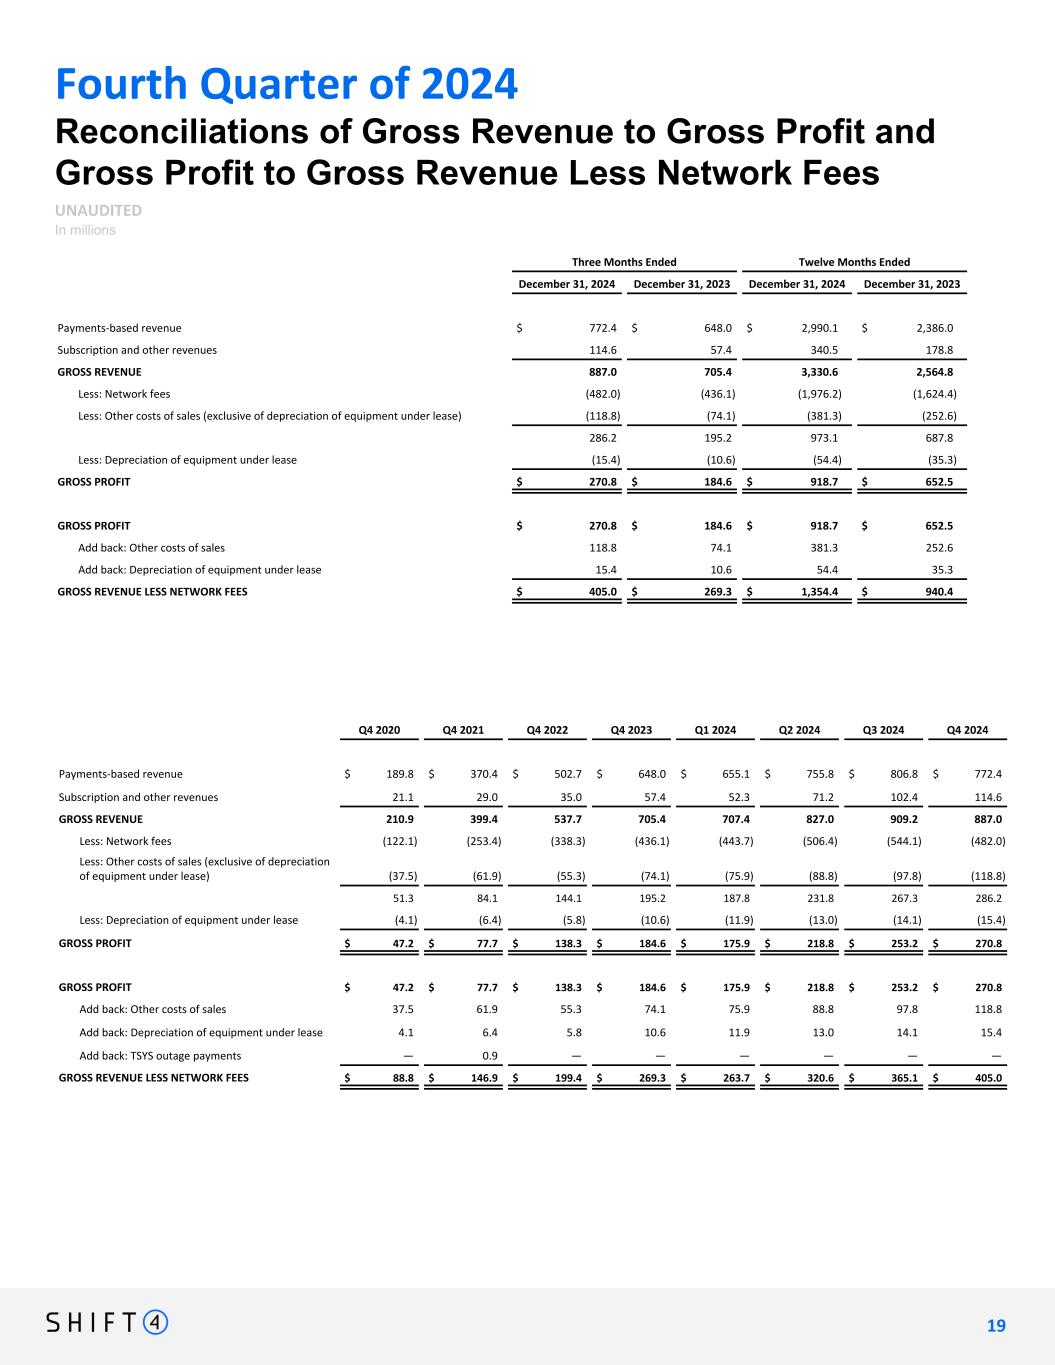
Fourth Quarter of 2024 Reconciliations of Gross Revenue to Gross Profit and Gross Profit to Gross Revenue Less Network Fees UNAUDITED In millions Three Months Ended Twelve Months Ended December 31, 2024 December 31, 2023 December 31, 2024 December 31, 2023 Payments-based revenue $ 772.4 $ 648.0 $ 2,990.1 $ 2,386.0 Subscription and other revenues 114.6 57.4 340.5 178.8 GROSS REVENUE 887.0 705.4 3,330.6 2,564.8 Less: Network fees (482.0) (436.1) (1,976.2) (1,624.4) Less: Other costs of sales (exclusive of depreciation of equipment under lease) (118.8) (74.1) (381.3) (252.6) 286.2 195.2 973.1 687.8 Less: Depreciation of equipment under lease (15.4) (10.6) (54.4) (35.3) GROSS PROFIT $ 270.8 $ 184.6 $ 918.7 $ 652.5 GROSS PROFIT $ 270.8 $ 184.6 $ 918.7 $ 652.5 Add back: Other costs of sales 118.8 74.1 381.3 252.6 Add back: Depreciation of equipment under lease 15.4 10.6 54.4 35.3 GROSS REVENUE LESS NETWORK FEES $ 405.0 $ 269.3 $ 1,354.4 $ 940.4 Q4 2020 Q4 2021 Q4 2022 Q4 2023 Q1 2024 Q2 2024 Q3 2024 Q4 2024 Payments-based revenue $ 189.8 $ 370.4 $ 502.7 $ 648.0 $ 655.1 $ 755.8 $ 806.8 $ 772.4 Subscription and other revenues 21.1 29.0 35.0 57.4 52.3 71.2 102.4 114.6 GROSS REVENUE 210.9 399.4 537.7 705.4 707.4 827.0 909.2 887.0 Less: Network fees (122.1) (253.4) (338.3) (436.1) (443.7) (506.4) (544.1) (482.0) Less: Other costs of sales (exclusive of depreciation of equipment under lease) (37.5) (61.9) (55.3) (74.1) (75.9) (88.8) (97.8) (118.8) 51.3 84.1 144.1 195.2 187.8 231.8 267.3 286.2 Less: Depreciation of equipment under lease (4.1) (6.4) (5.8) (10.6) (11.9) (13.0) (14.1) (15.4) GROSS PROFIT $ 47.2 $ 77.7 $ 138.3 $ 184.6 $ 175.9 $ 218.8 $ 253.2 $ 270.8 GROSS PROFIT $ 47.2 $ 77.7 $ 138.3 $ 184.6 $ 175.9 $ 218.8 $ 253.2 $ 270.8 Add back: Other costs of sales 37.5 61.9 55.3 74.1 75.9 88.8 97.8 118.8 Add back: Depreciation of equipment under lease 4.1 6.4 5.8 10.6 11.9 13.0 14.1 15.4 Add back: TSYS outage payments — 0.9 — — — — — — GROSS REVENUE LESS NETWORK FEES $ 88.8 $ 146.9 $ 199.4 $ 269.3 $ 263.7 $ 320.6 $ 365.1 $ 405.0 1 9 19
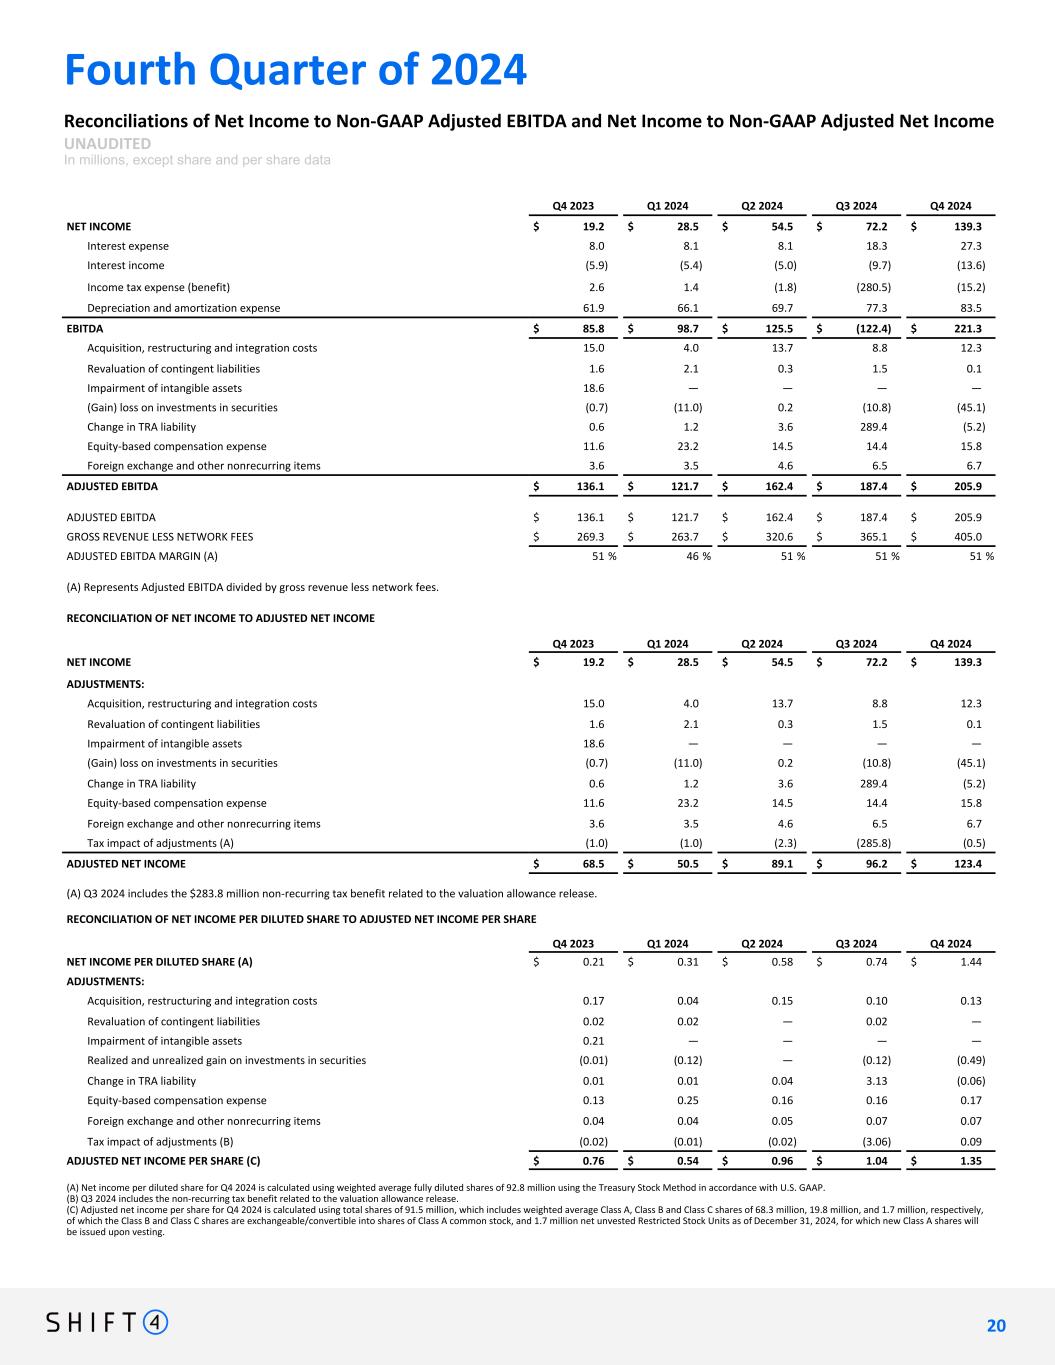
Fourth Quarter of 2024 Reconciliations of Net Income to Non-GAAP Adjusted EBITDA and Net Income to Non-GAAP Adjusted Net Income UNAUDITED In millions, except share and per share data Q4 2023 Q1 2024 Q2 2024 Q3 2024 Q4 2024 NET INCOME $ 19.2 $ 28.5 $ 54.5 $ 72.2 $ 139.3 Interest expense 8.0 8.1 8.1 18.3 27.3 Interest income (5.9) (5.4) (5.0) (9.7) (13.6) Income tax expense (benefit) 2.6 1.4 (1.8) (280.5) (15.2) Depreciation and amortization expense 61.9 66.1 69.7 77.3 83.5 EBITDA $ 85.8 $ 98.7 $ 125.5 $ (122.4) $ 221.3 Acquisition, restructuring and integration costs 15.0 4.0 13.7 8.8 12.3 Revaluation of contingent liabilities 1.6 2.1 0.3 1.5 0.1 Impairment of intangible assets 18.6 — — — — (Gain) loss on investments in securities (0.7) (11.0) 0.2 (10.8) (45.1) Change in TRA liability 0.6 1.2 3.6 289.4 (5.2) Equity-based compensation expense 11.6 23.2 14.5 14.4 15.8 Foreign exchange and other nonrecurring items 3.6 3.5 4.6 6.5 6.7 ADJUSTED EBITDA $ 136.1 $ 121.7 $ 162.4 $ 187.4 $ 205.9 ADJUSTED EBITDA $ 136.1 $ 121.7 $ 162.4 $ 187.4 $ 205.9 GROSS REVENUE LESS NETWORK FEES $ 269.3 $ 263.7 $ 320.6 $ 365.1 $ 405.0 ADJUSTED EBITDA MARGIN (A) 51 % 46 % 51 % 51 % 51 % (A) Represents Adjusted EBITDA divided by gross revenue less network fees. RECONCILIATION OF NET INCOME TO ADJUSTED NET INCOME Q4 2023 Q1 2024 Q2 2024 Q3 2024 Q4 2024 NET INCOME $ 19.2 $ 28.5 $ 54.5 $ 72.2 $ 139.3 ADJUSTMENTS: Acquisition, restructuring and integration costs 15.0 4.0 13.7 8.8 12.3 Revaluation of contingent liabilities 1.6 2.1 0.3 1.5 0.1 Impairment of intangible assets 18.6 — — — — (Gain) loss on investments in securities (0.7) (11.0) 0.2 (10.8) (45.1) Change in TRA liability 0.6 1.2 3.6 289.4 (5.2) Equity-based compensation expense 11.6 23.2 14.5 14.4 15.8 Foreign exchange and other nonrecurring items 3.6 3.5 4.6 6.5 6.7 Tax impact of adjustments (A) (1.0) (1.0) (2.3) (285.8) (0.5) ADJUSTED NET INCOME $ 68.5 $ 50.5 $ 89.1 $ 96.2 $ 123.4 (A) Q3 2024 includes the $283.8 million non-recurring tax benefit related to the valuation allowance release. RECONCILIATION OF NET INCOME PER DILUTED SHARE TO ADJUSTED NET INCOME PER SHARE Q4 2023 Q1 2024 Q2 2024 Q3 2024 Q4 2024 NET INCOME PER DILUTED SHARE (A) $ 0.21 $ 0.31 $ 0.58 $ 0.74 $ 1.44 ADJUSTMENTS: Acquisition, restructuring and integration costs 0.17 0.04 0.15 0.10 0.13 Revaluation of contingent liabilities 0.02 0.02 — 0.02 — Impairment of intangible assets 0.21 — — — — Realized and unrealized gain on investments in securities (0.01) (0.12) — (0.12) (0.49) Change in TRA liability 0.01 0.01 0.04 3.13 (0.06) Equity-based compensation expense 0.13 0.25 0.16 0.16 0.17 Foreign exchange and other nonrecurring items 0.04 0.04 0.05 0.07 0.07 Tax impact of adjustments (B) (0.02) (0.01) (0.02) (3.06) 0.09 ADJUSTED NET INCOME PER SHARE (C) $ 0.76 $ 0.54 $ 0.96 $ 1.04 $ 1.35 (A) Net income per diluted share for Q4 2024 is calculated using weighted average fully diluted shares of 92.8 million using the Treasury Stock Method in accordance with U.S. GAAP. (B) Q3 2024 includes the non-recurring tax benefit related to the valuation allowance release. (C) Adjusted net income per share for Q4 2024 is calculated using total shares of 91.5 million, which includes weighted average Class A, Class B and Class C shares of 68.3 million, 19.8 million, and 1.7 million, respectively, of which the Class B and Class C shares are exchangeable/convertible into shares of Class A common stock, and 1.7 million net unvested Restricted Stock Units as of December 31, 2024, for which new Class A shares will be issued upon vesting. 2 0 20
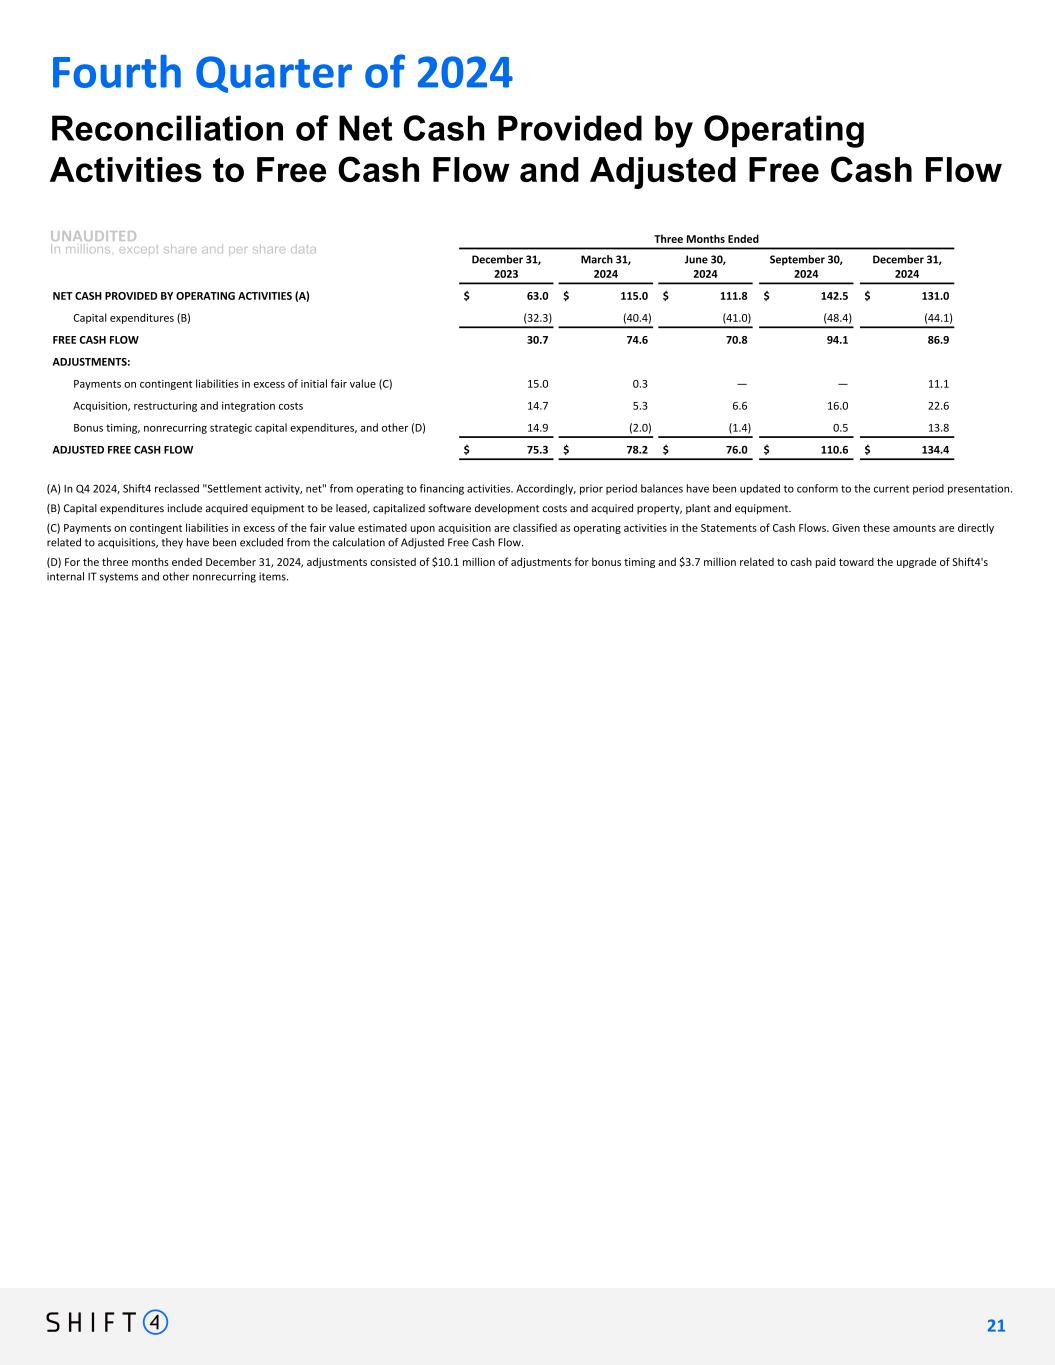
Three Months Ended December 31, 2023 March 31, 2024 June 30, 2024 September 30, 2024 December 31, 2024 NET CASH PROVIDED BY OPERATING ACTIVITIES (A) $ 63.0 $ 115.0 $ 111.8 $ 142.5 $ 131.0 Capital expenditures (B) (32.3) (40.4) (41.0) (48.4) (44.1) FREE CASH FLOW 30.7 74.6 70.8 94.1 86.9 ADJUSTMENTS: Payments on contingent liabilities in excess of initial fair value (C) 15.0 0.3 — — 11.1 Acquisition, restructuring and integration costs 14.7 5.3 6.6 16.0 22.6 Bonus timing, nonrecurring strategic capital expenditures, and other (D) 14.9 (2.0) (1.4) 0.5 13.8 ADJUSTED FREE CASH FLOW $ 75.3 $ 78.2 $ 76.0 $ 110.6 $ 134.4 Reconciliation of Net Cash Provided by Operating Activities to Free Cash Flow and Adjusted Free Cash Flow UNAUDITED In millions, except share and per share data Fourth Quarter of 2024 (A) In Q4 2024, Shift4 reclassed "Settlement activity, net" from operating to financing activities. Accordingly, prior period balances have been updated to conform to the current period presentation. (B) Capital expenditures include acquired equipment to be leased, capitalized software development costs and acquired property, plant and equipment. (C) Payments on contingent liabilities in excess of the fair value estimated upon acquisition are classified as operating activities in the Statements of Cash Flows. Given these amounts are directly related to acquisitions, they have been excluded from the calculation of Adjusted Free Cash Flow. (D) For the three months ended December 31, 2024, adjustments consisted of $10.1 million of adjustments for bonus timing and $3.7 million related to cash paid toward the upgrade of Shift4's internal IT systems and other nonrecurring items. 2 1 21
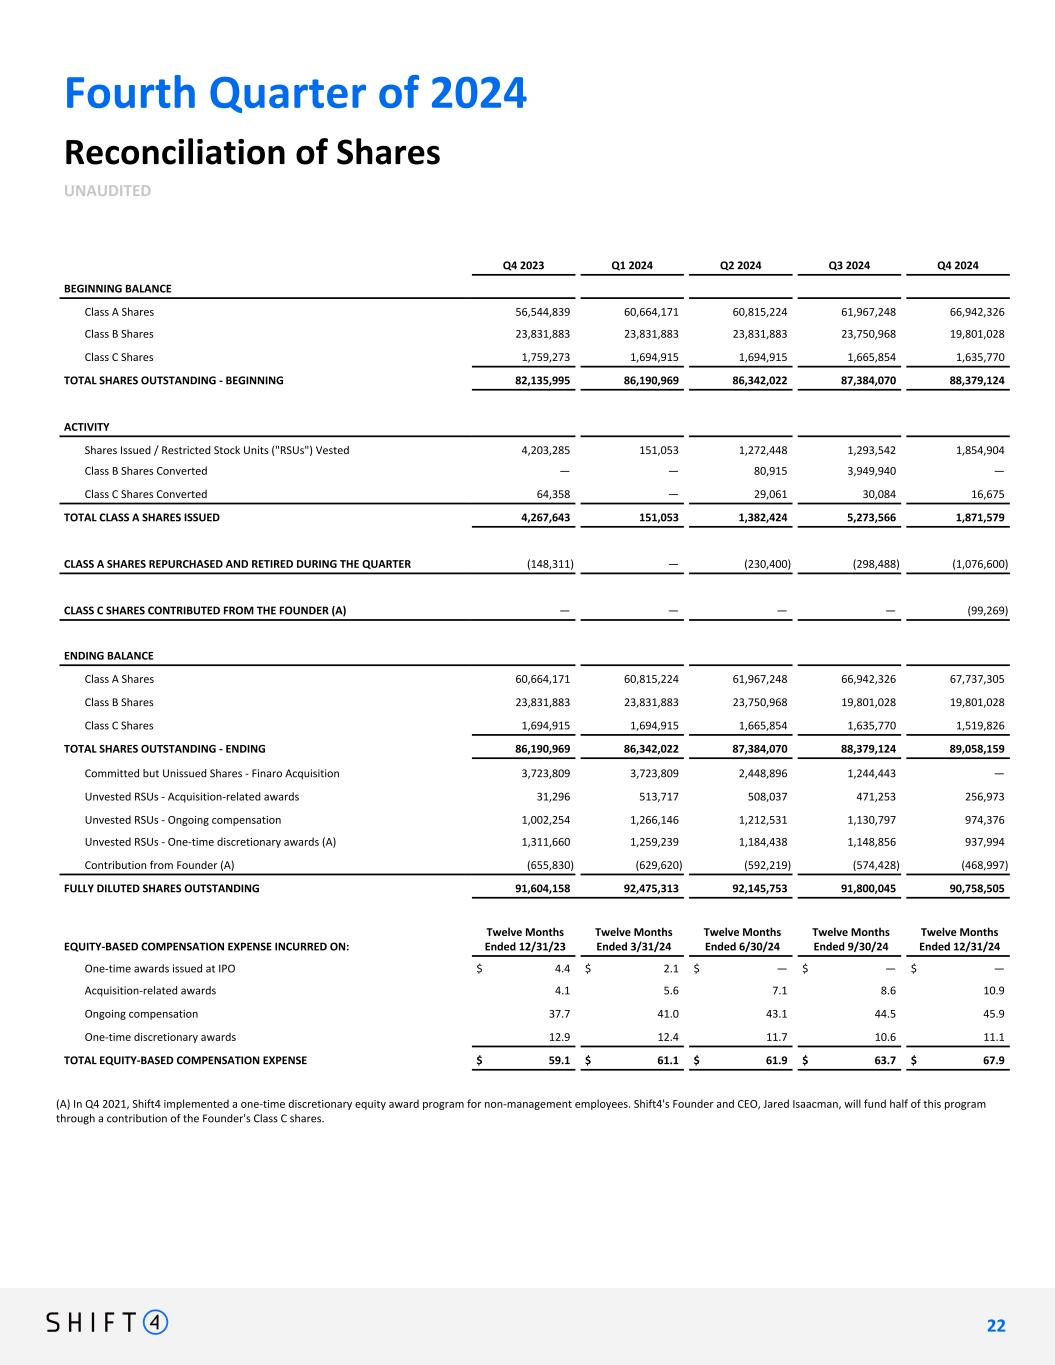
Fourth Quarter of 2024 Reconciliation of Shares UNAUDITED Q4 2023 Q1 2024 Q2 2024 Q3 2024 Q4 2024 BEGINNING BALANCE Class A Shares 56,544,839 60,664,171 60,815,224 61,967,248 66,942,326 Class B Shares 23,831,883 23,831,883 23,831,883 23,750,968 19,801,028 Class C Shares 1,759,273 1,694,915 1,694,915 1,665,854 1,635,770 TOTAL SHARES OUTSTANDING - BEGINNING 82,135,995 86,190,969 86,342,022 87,384,070 88,379,124 ACTIVITY Shares Issued / Restricted Stock Units ("RSUs") Vested 4,203,285 151,053 1,272,448 1,293,542 1,854,904 Class B Shares Converted — — 80,915 3,949,940 — Class C Shares Converted 64,358 — 29,061 30,084 16,675 TOTAL CLASS A SHARES ISSUED 4,267,643 151,053 1,382,424 5,273,566 1,871,579 CLASS A SHARES REPURCHASED AND RETIRED DURING THE QUARTER (148,311) — (230,400) (298,488) (1,076,600) CLASS C SHARES CONTRIBUTED FROM THE FOUNDER (A) — — — — (99,269) ENDING BALANCE Class A Shares 60,664,171 60,815,224 61,967,248 66,942,326 67,737,305 Class B Shares 23,831,883 23,831,883 23,750,968 19,801,028 19,801,028 Class C Shares 1,694,915 1,694,915 1,665,854 1,635,770 1,519,826 TOTAL SHARES OUTSTANDING - ENDING 86,190,969 86,342,022 87,384,070 88,379,124 89,058,159 Committed but Unissued Shares - Finaro Acquisition 3,723,809 3,723,809 2,448,896 1,244,443 — Unvested RSUs - Acquisition-related awards 31,296 513,717 508,037 471,253 256,973 Unvested RSUs - Ongoing compensation 1,002,254 1,266,146 1,212,531 1,130,797 974,376 Unvested RSUs - One-time discretionary awards (A) 1,311,660 1,259,239 1,184,438 1,148,856 937,994 Contribution from Founder (A) (655,830) (629,620) (592,219) (574,428) (468,997) FULLY DILUTED SHARES OUTSTANDING 91,604,158 92,475,313 92,145,753 91,800,045 90,758,505 EQUITY-BASED COMPENSATION EXPENSE INCURRED ON: Twelve Months Ended 12/31/23 Twelve Months Ended 3/31/24 Twelve Months Ended 6/30/24 Twelve Months Ended 9/30/24 Twelve Months Ended 12/31/24 One-time awards issued at IPO $ 4.4 $ 2.1 $ — $ — $ — Acquisition-related awards 4.1 5.6 7.1 8.6 10.9 Ongoing compensation 37.7 41.0 43.1 44.5 45.9 One-time discretionary awards 12.9 12.4 11.7 10.6 11.1 TOTAL EQUITY-BASED COMPENSATION EXPENSE $ 59.1 $ 61.1 $ 61.9 $ 63.7 $ 67.9 (A) In Q4 2021, Shift4 implemented a one-time discretionary equity award program for non-management employees. Shift4's Founder and CEO, Jared Isaacman, will fund half of this program through a contribution of the Founder's Class C shares. 2 2 22